
EURUSD
Fundamental Perspective
The EUR/USD experienced a significant decline during the late New York session, following a peak of 1.1009 over ten days. This downturn was triggered by a combination of factors, including positive data from the United States (US) exceeding expectations and a Eurozone (EU) business activity report indicating weaker performance.
Also, the Euro (EUR) received support from the European Central Bank (ECB) President Christine Lagarde's assertive stance, reminiscent of the approach taken by Fed Chair Jerome Powell. Powell, in contrast, failed to counter speculations about potential interest rate cuts, fueling the rally of EUR/USD beyond the 1.1000 threshold.
Technical Perspective
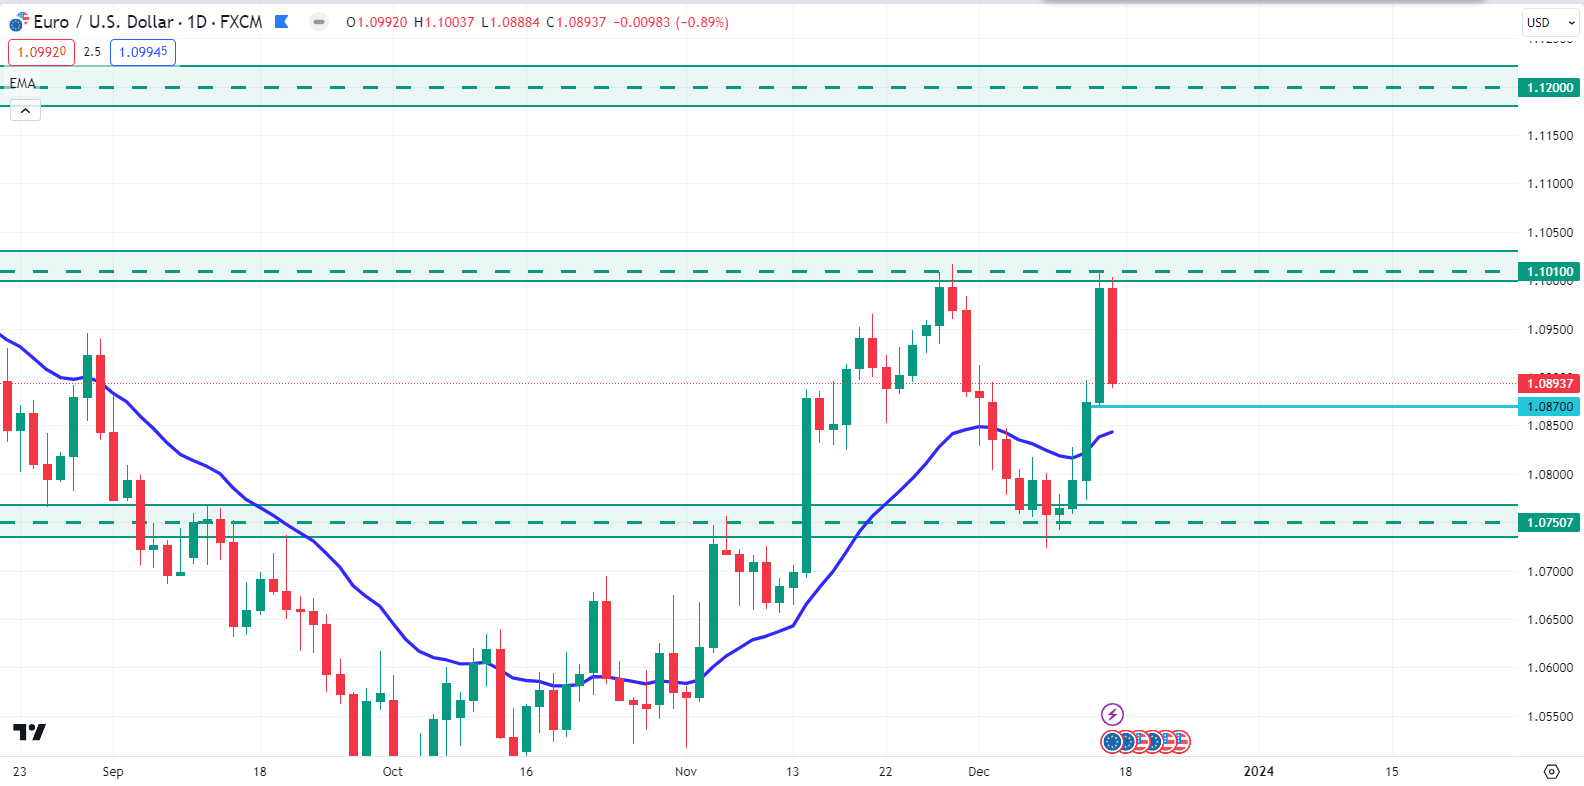
Source: TradingView
In the weekly chart, the EURUSD price was again rejected by the 1.1010 psychological resistance area and had a weekly candle close below it. However, the dynamic level of the 20-week EMA still holds the price as support.
In the daily timeframe, EURUSD had a strong daily bearish candle close after rejecting the 1.1010 resistance area last Friday. So, a daily bearish candle close below the 1.0870 price area could extend momentum and push the price down to the 1.0750 price area in the coming days.
On the bullish side, if bulls push the price higher and break above the 1.1010 resistance area, bulls may continue the bullish momentum toward the 1.1200 key area in the days ahead.
GBPJPY
Fundamental Perspective
The Pound Sterling (GBP) is receiving upward support against the Japanese Yen (JPY), a trend possibly influenced by the Bank of England (BoE) Governor Andrew Bailey's hawkish stance. Governor Bailey has indicated that there is still some distance to cover before inflation aligns with the target, contributing to an overall hawkish sentiment. Despite this, the BoE opted to maintain interest rates at 5.25% in Thursday's decision.
In addition, the GFK Consumer Confidence for December declined by an anticipated 22 readings, following a previous drop of 24. Investor attention is now focused on the forthcoming Purchasing Managers Index (PMI) data from the United Kingdom (UK) scheduled for release on Friday.
Technical Perspective
Source: TradingView
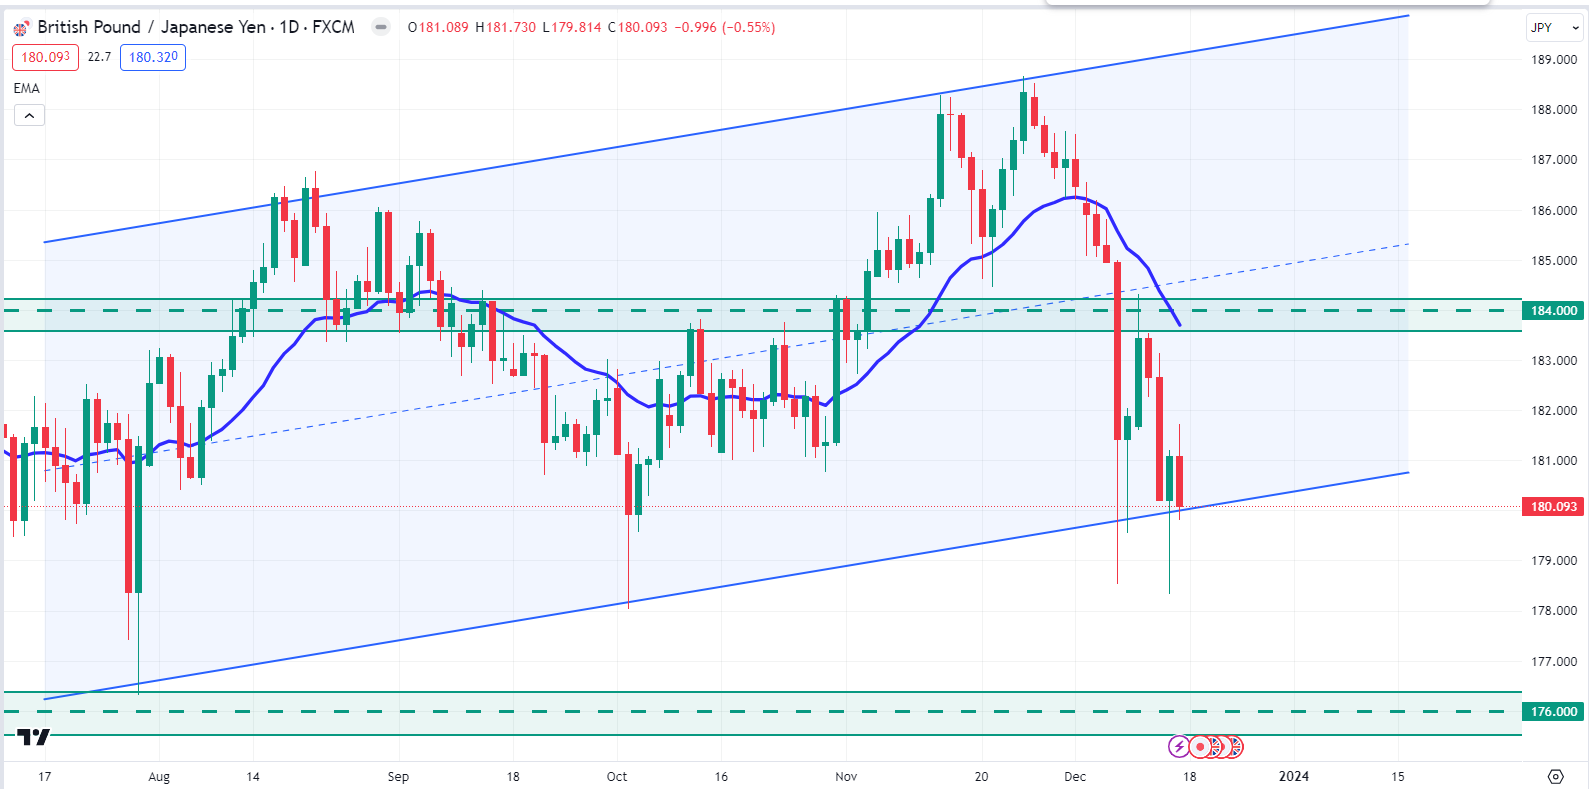
In the weekly chart, GBPJPY bulls still hold prices above the 178.00 psychological price area. However, the price faced strong support at the bullish channel and had a weekly close above it.
In the daily chart, GBPJPY had a bullish pin bar close after bouncing from the bullish channel's support last Thursday. However, the Friday daily close was bearish. So, if the price breaks below the bullish channel's support with a daily bearish candle, bears may push the price down to the 176.00 price area in the days ahead.
On the bullish side, if the price can have a bullish close above the bullish channel's support, bulls may regain momentum and push the price upward toward the 184.00 price area again.
Nasdaq 100 (NAS100)
Fundamental Perspective
Based on current market patterns, the NAS100 is expected to see a positive trajectory in the week of December 18–22, 2023. Strong economic indicators and encouraging corporate earnings reports bolster this upbeat view. Analysts predict further gains thanks to strong tech stocks and advantageous macroeconomic circumstances. Growth-oriented sectors may present chances for traders.
It is necessary to monitor prospective inflationary pressures and geopolitical developments. To summarize, a tactical approach that coincides with a bull market mood may produce great outcomes in the NAS100.
Technical Perspective
Source: TradingView
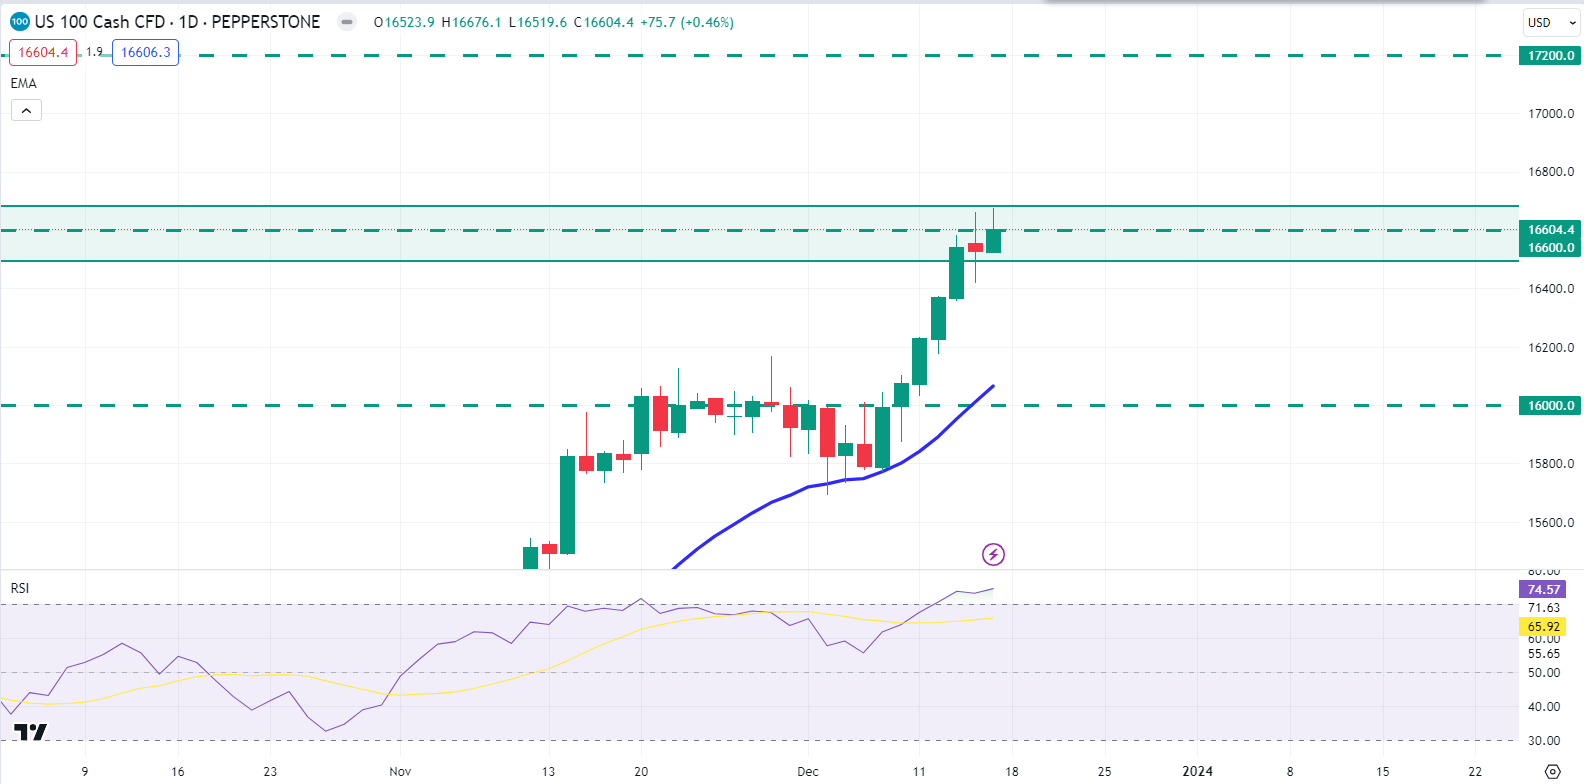
In the weekly chart, NAS100 hit the psychological weekly resistance level of $16600.0 price area. After bouncing from the $14250.0 support level, bulls regained momentum and impulsively pushed the price higher, hitting November 2021's high.
In the daily chart, if the price rejects from the $16600.0 resistance level with a strong daily bearish candle close, bears may regain momentum and retrace lower toward the $16000.0 price area. Moreover, the RSI indicator also indicates that bears may regain momentum in the days ahead.
On the bullish side, if the price breaks above the $16600.0 key resistance area with a strong bullish candle close, bulls may sustain the bullish momentum toward the $17200.0 price area in the coming days.
S&P500 (SPX500)
Fundamental Perspective
Positive company profits and strong economic indicators are expected to support the S&P 500's resiliency on December 18–22, 2023. Sustaining investor confidence and favorable conditions in key sectors should support a bullish trend. Analysts stress the significance of keeping an eye on interest rate dynamics and foreign economic indicators to make well-informed decisions. With the market sentiment generally optimistic, traders can identify opportunities in cyclical equities.
All the same, given the possible uncertainty in the market, a cautious approach is recommended. If one follows current market patterns and maintains a balanced approach, the S&P 500 could perform well during this time.
Technical Perspective
Source: TradingView
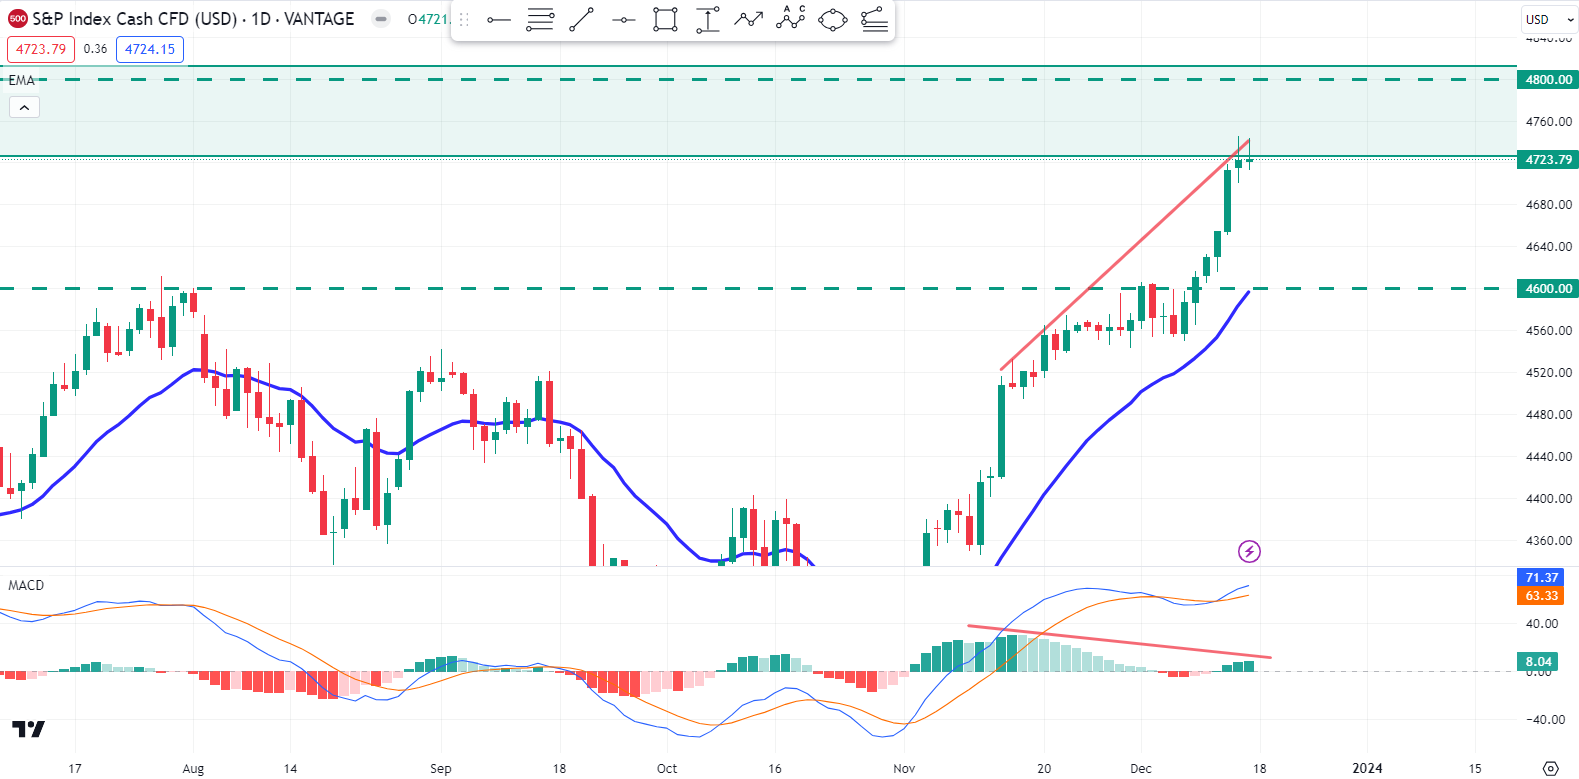
In the weekly chart, the S&P 500 hit the weekly order block area, which is around $4730.00 - $4810.00 price area. Bulls impulsively pushed the price higher after bouncing from the $4135.00 support level and hitting the December 2021 high.
In the daily chart, if the price can have a daily bearish candle close below the weekly order block area, bears may regain momentum and push the price down to the $4600.00 support level in the days ahead. However, the MACD indicator created a bearish divergence, which indicates that bears may regain momentum.
On the bullish side, if the price retraces down to the $4600.00 support level and bounces with a daily bullish candle close, bulls may push the price higher to the $4800.00 key area in the coming days.
Hang Seng Index (HK50)
Fundamental Perspective
Analysts predict the HK50 will have a strong week from December 18–22, 2023, driven by strong economic data and encouraging trade developments. It is anticipated that important industries like technology and finance will propel market advances, offering profitable prospects to investors. The positive view is bolstered by geopolitical stability and global market trends.
However, careful observation of any policy changes is advisable. Value can be found by traders in growth-oriented stocks. In conclusion, navigating the HK50 during this projected expansion phase may benefit from a strategic strategy aligned with current market dynamics.
Technical Perspective
Source: TradingView
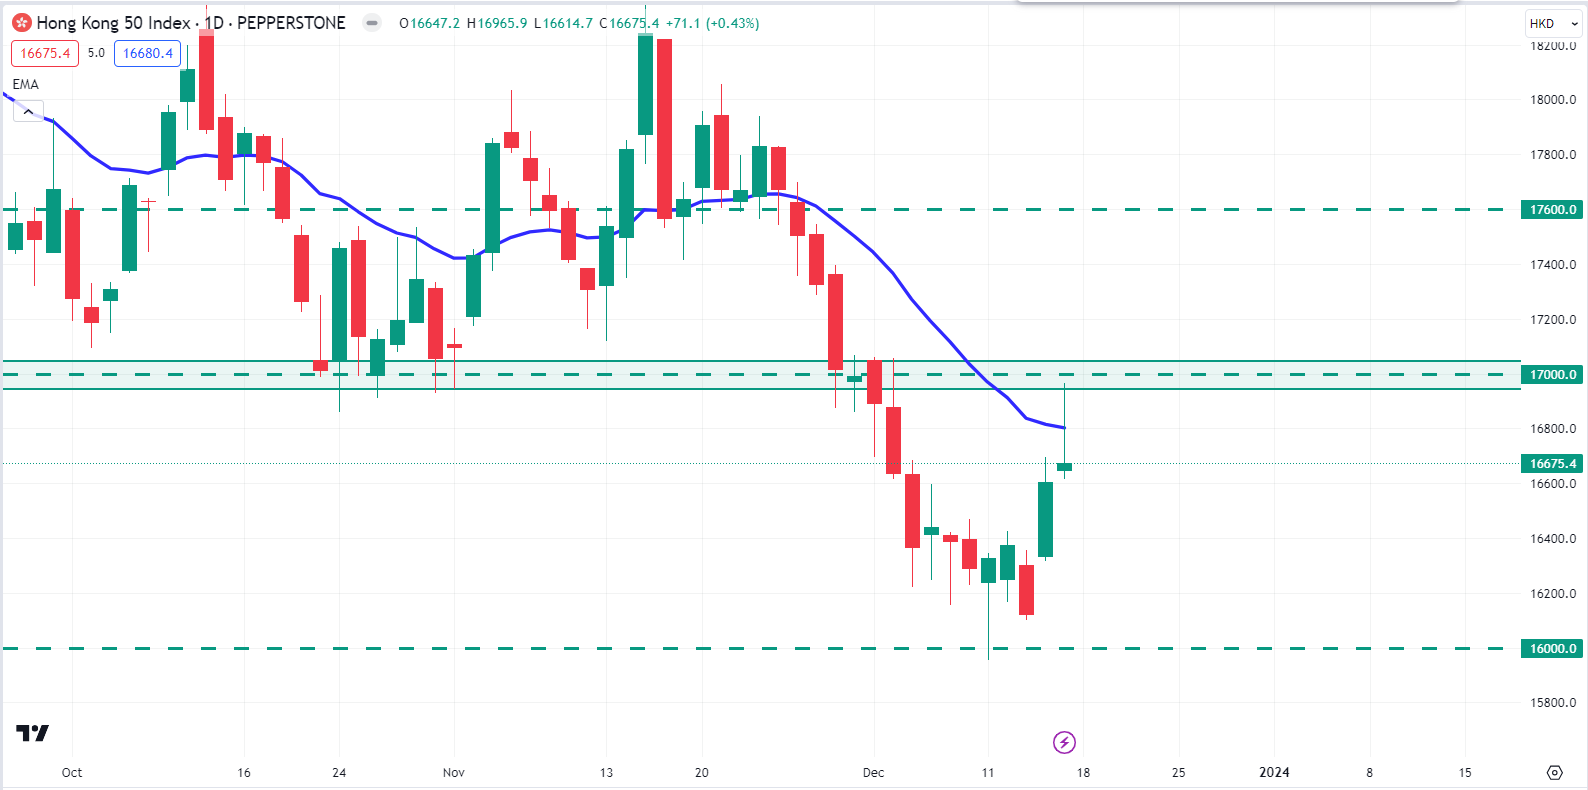
In the weekly chart, HK50 returned to the $17000.0 psychological event level and had a weekly candle close below it. However, the momentum was still bearish on the weekly timeframe.
In the daily chart, if the price can have a daily bearish candle close below the dynamic level of 20 EMA, bears may push the price down to $16000.0 price area in the coming days.
On the bullish side, with a bullish break above the dynamic level of 20 EMA with a daily bullish candle, bulls may retrace further toward the $17600.0 price area.
Bitcoin (BTCUSD)
Fundamental Perspective
BTC expects a bullish trajectory driven by encouraging regulatory developments and increasing institutional interest in the week of December 18–22, 2023. The fact that more people are using Bitcoin as a store of value is supported by recent data. Analysts predict possible price increases as long as the market mood is positive. To make more informed decisions, monitoring regulatory pronouncements and macroeconomic variables is necessary.
Volatility can present possibilities for traders, but it is best to take it slow. To sum up, Bitcoin is poised for possible increases, but traders should continue to monitor changing conditions to make well-informed decisions this coming week.
Technical Perspective
Source: TradingView
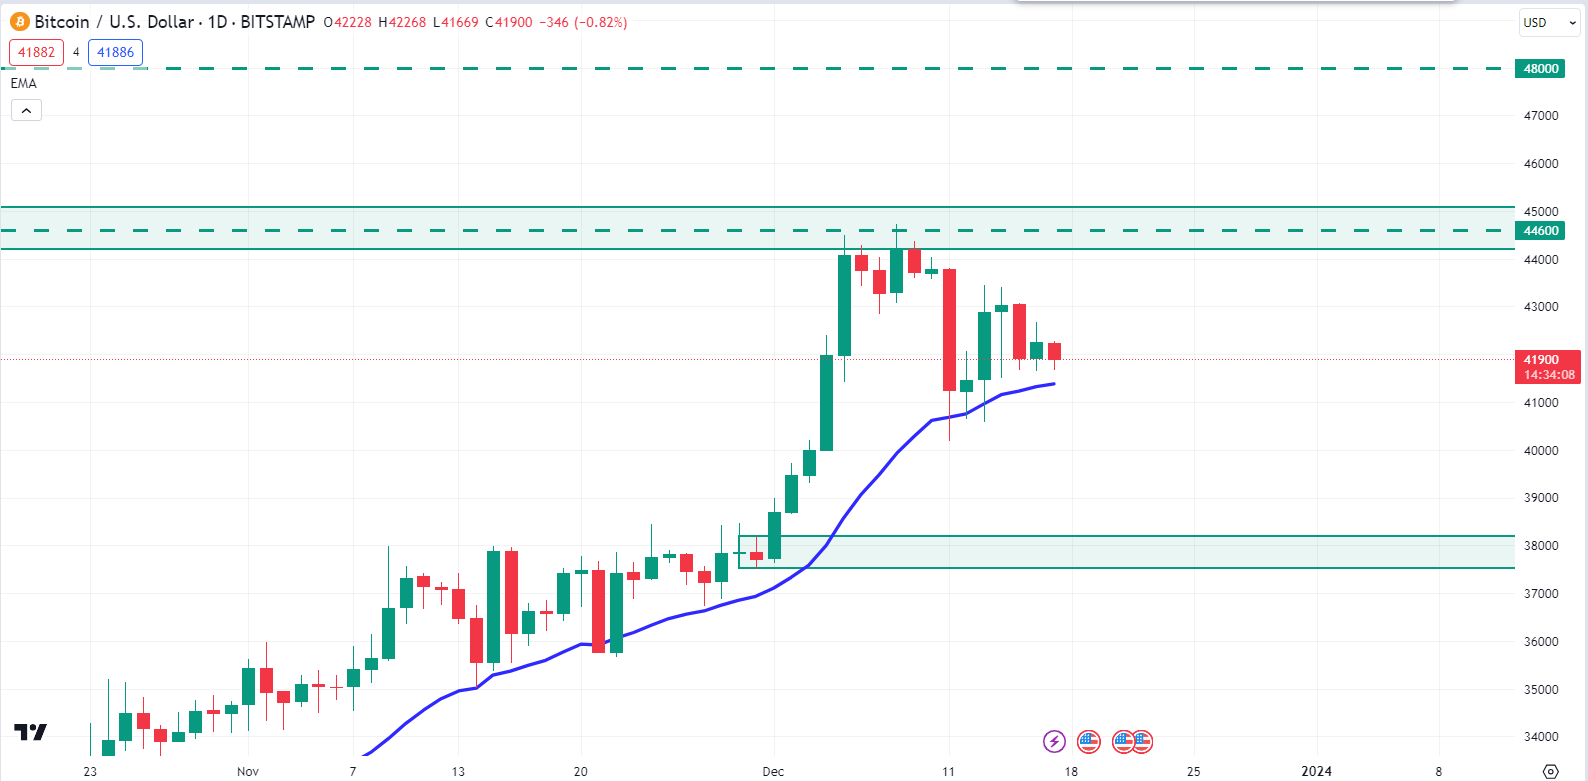
BTC had a weekly bearish candle close in the weekly chart after rejecting the $44600 psychological event level. After an extended period of bullish momentum, the price faced resistance and pushed lower.
The dynamic level of 20 EMA in the daily chart still holds the price as strong support. So, if the price bounces higher from the dynamic level of 20 EMA and has a daily bullish candle close above the $44600 price area, bulls may sustain the bullish bias toward the $48000 price area in the coming days.
On the bearish side, if the price breaks below the dynamic level of 20 EMA with a daily bearish candle close, bears may regain momentum and push the price down to the $38000 price area.
Ethereum (ETHUSD)
Fundamental Perspective
According to analysts at JP Morgan in a recent note, Ethereum (ETH) is expected to outshine Bitcoin in terms of price performance in 2024. After approximately three weeks of consolidation, Ether was trading around $2,400. However, the upward momentum appears to be losing steam as Bitcoin faces a downturn this week.
Despite the buzz surrounding the approval of a Bitcoin ETF, Ethereum (ETH) remains relatively neutral, with other alternative cryptocurrencies outperforming Ether. Ethereum is anticipated to enter a period of sideways movement in the coming days for several reasons. These include a decrease in on-chain activity, a delay in the approval of the ETF by the US Securities and Exchange Commission (SEC), the imminent holiday season, and a lack of momentum to drive up Bitcoin prices.
Technical Perspective
Source: TradingView
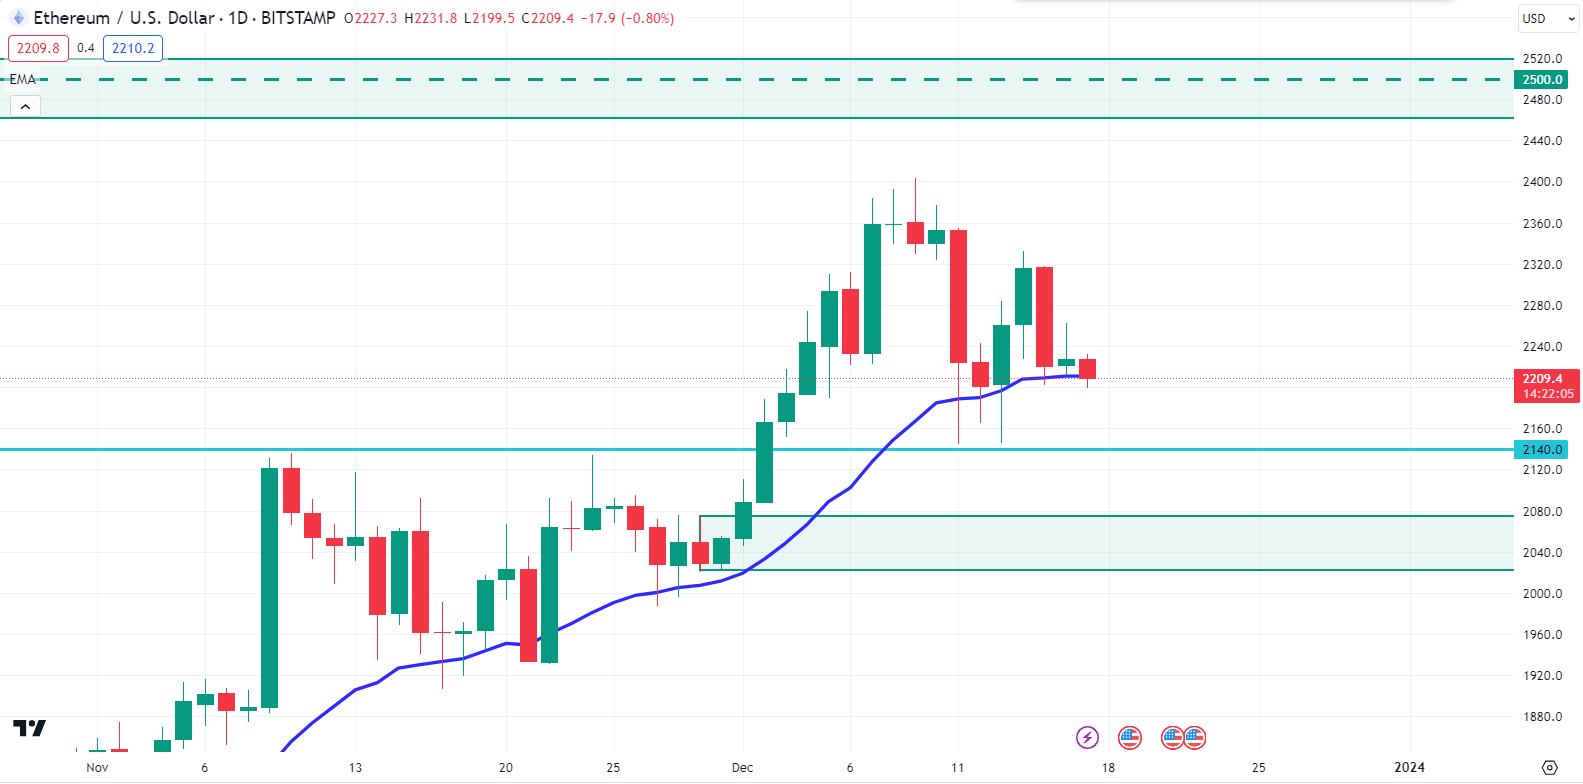
In the weekly chart, bulls still hold bullish momentum above the $2140.0 price area. After bouncing from the bullish trend line, bulls regained momentum, pushed the price higher impulsively, and broke above the $2140.0 neckline area.
In the daily chart, if the price can have a daily bullish candle close above the dynamic level of 20 EMA, bulls may sustain the bullish pressure toward the $2500.0 price area in the days ahead.
On the bearish side, if the price breaks below the 20 EMA with a daily bearish candle, the ETH may retrace further lower toward the daily demand zone area, around the $2025.0 - $2075.0 price area.
Tesla Stock (TSLA)
Fundamental Perspective
TSLA looks promising, thanks to strong demand for electric cars and excellent production numbers. According to recent studies, Tesla is continuously increasing its market share and innovating. Analysts highlight the optimistic attitude of investors when projecting possible stock increases. However, short-term performance might be impacted by possible supply chain interruptions. For a well-informed strategy, investors should monitor industry advancements and macroeconomic changes.
Even if TSLA looks to be headed for growth, it's important to be cautious, given the volatile nature of the market. To sum up, TSLA may benefit from a cautious but hopeful approach that is in line with current trends next week.
Technical Perspective
Source: TradingView
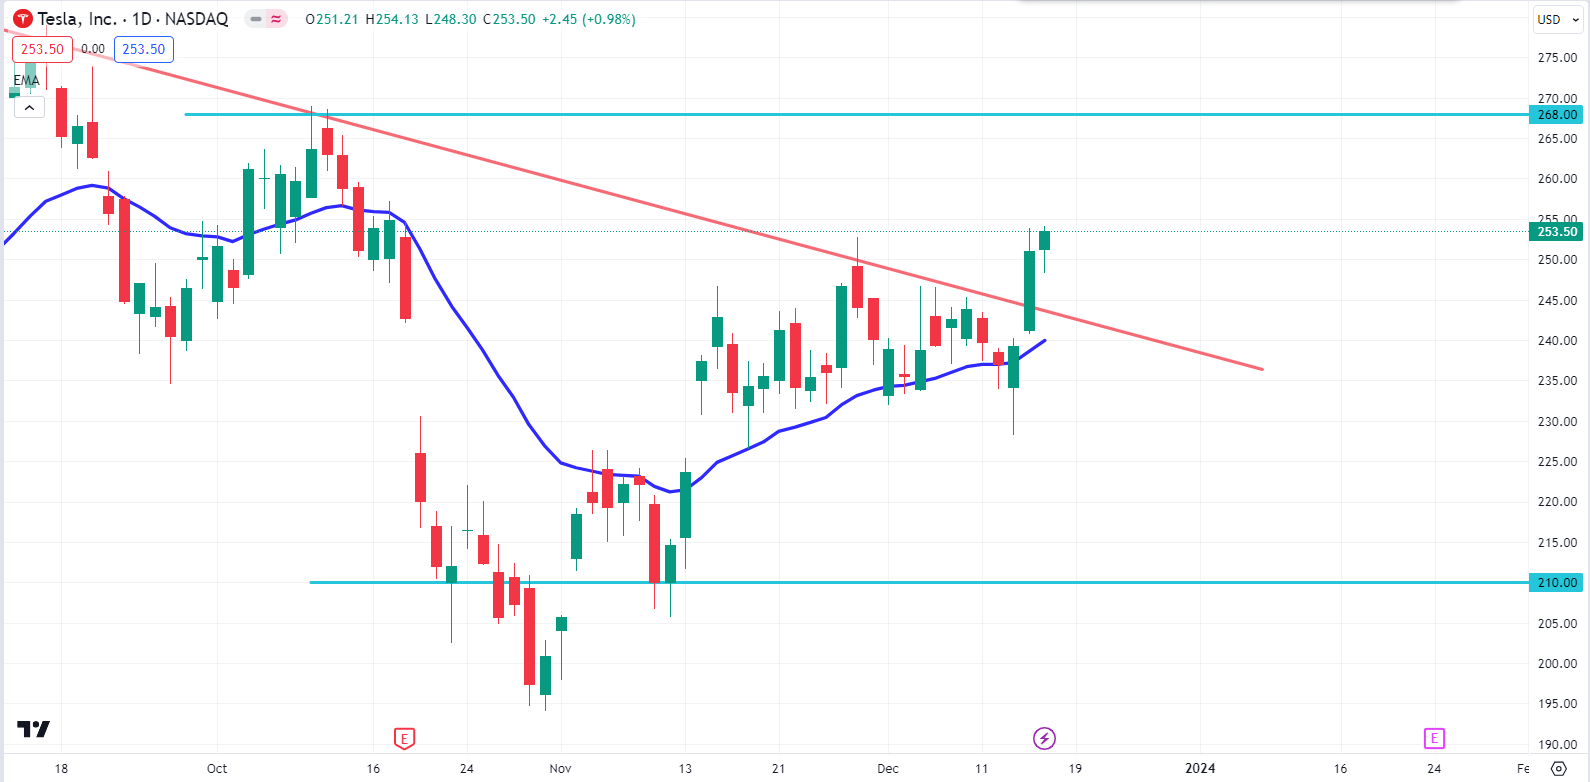
In the weekly chart, TSLA stock price broke above the bearish trend line with an impulsive weekly bullish candle close.
On the daily chart, if the price returns to the bearish trend line and bounces higher with a daily bullish candle, bulls may sustain the bullish momentum toward the $268.00 price area in the coming days.
On the bearish side, if the price comes down and has a daily bearish candle close below the bearish trend line, bears may regain momentum and push the price down to the $210.0 support area.
GOLD (XAUUSD)
Fundamental Perspective
Gold prices (XAU/USD) fell from the $2,040 resistance as the US Dollar (USD) rose. This happened after the Federal Reserve's (Fed) President and CEO, John Williams, downplayed expectations of rate hikes in March. The Greenback showed resilience despite a lower-than-expected NY Empire State Manufacturing Index in December, which dropped to -15.5, below the expected 2 readings, following a 9.1% reading in November.
Although the overall trend remains positive, with the precious metal staying within the week's range, the Fed's unexpectedly bearish tone on Wednesday hinted at the end of the hiking cycle and the possibility of rate cuts. This led to a decline in US bond yields and the US Dollar.
Technical Perspective
Source: TradingView
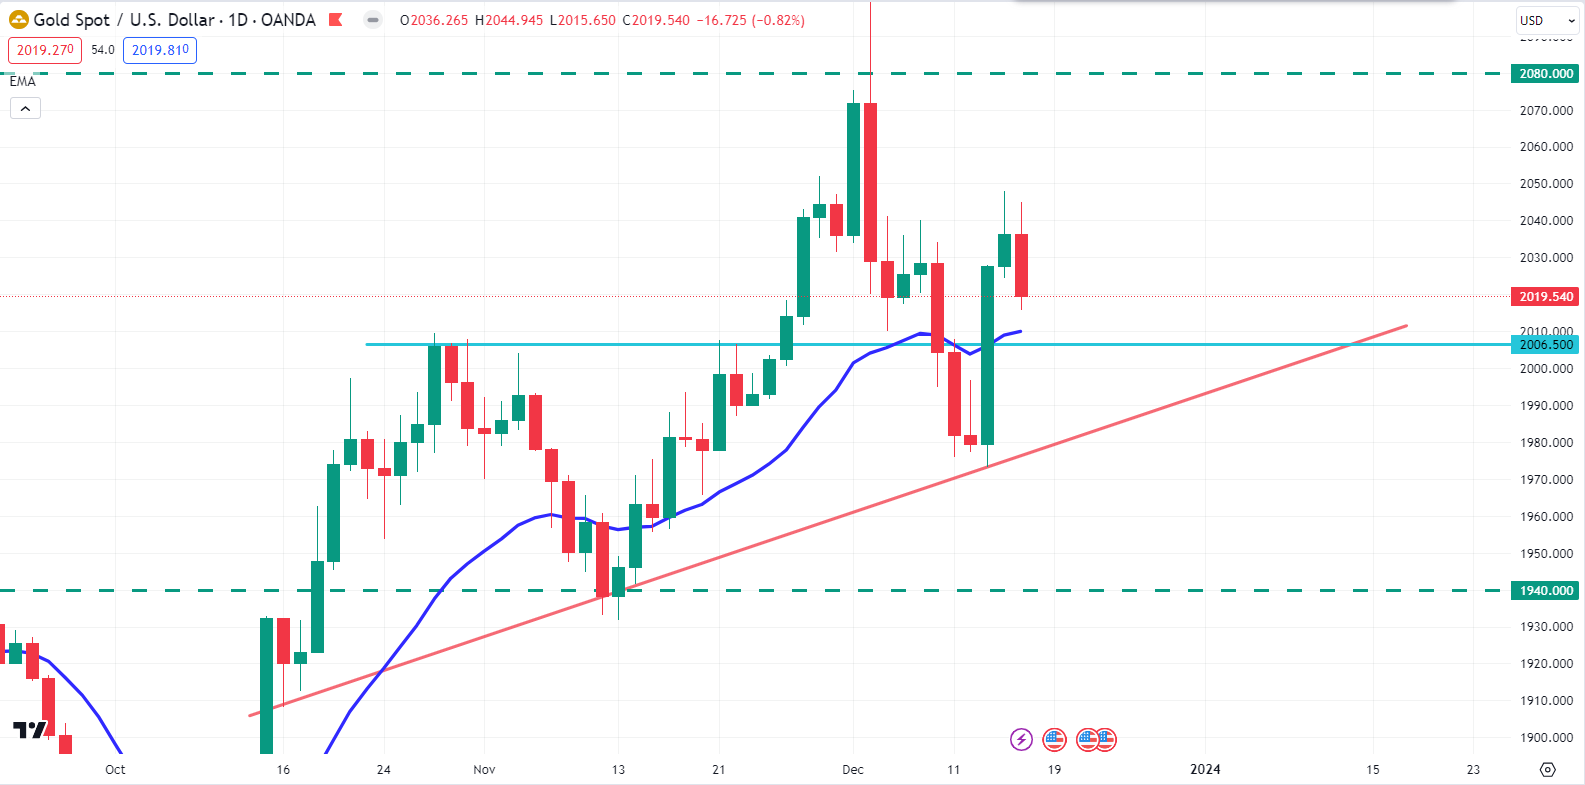
In the weekly chart, Gold's price remains below the $2080.00 psychological area. However, the dynamic level of 20 EMA still holds the price as strong support.
In the daily chart, the price may retrace down to the $2006.50 neckline area. So, if the price retraces to the $2006.50 neckline area and bounces with an impulsive bullish candle close, bulls may recover upward toward the $2080.00 price area in the coming days.
On the bearish side, if the price breaks below the bullish trend line with an impulsive daily bearish candle, bears may regain momentum and push the price down to the $1940.00 price area.
WTI Crude Oil (USOUSD)
Fundamental Perspective
West Texas Intermediate (WTI) Crude Oil prices dropped to around $70.65 before returning to just below $72.00. Crude Oil markets face challenges, with bullish momentum encountering resistance at familiar technical points. This week's optimism, triggered by the US Federal Reserve (Fed) hinting at potential rate cuts next year, only managed to bring WTI prices back to where the week started. However, upward movements are constrained as global oil demand decreases faster than the Organization of the Petroleum Exporting Countries (OPEC) can reduce production.
Technical Perspective
Oil had a bullish pin bar close in the weekly chart after rejecting the weekly order block area. After an impulsive bearish momentum, the price found support around the $68.00 area.
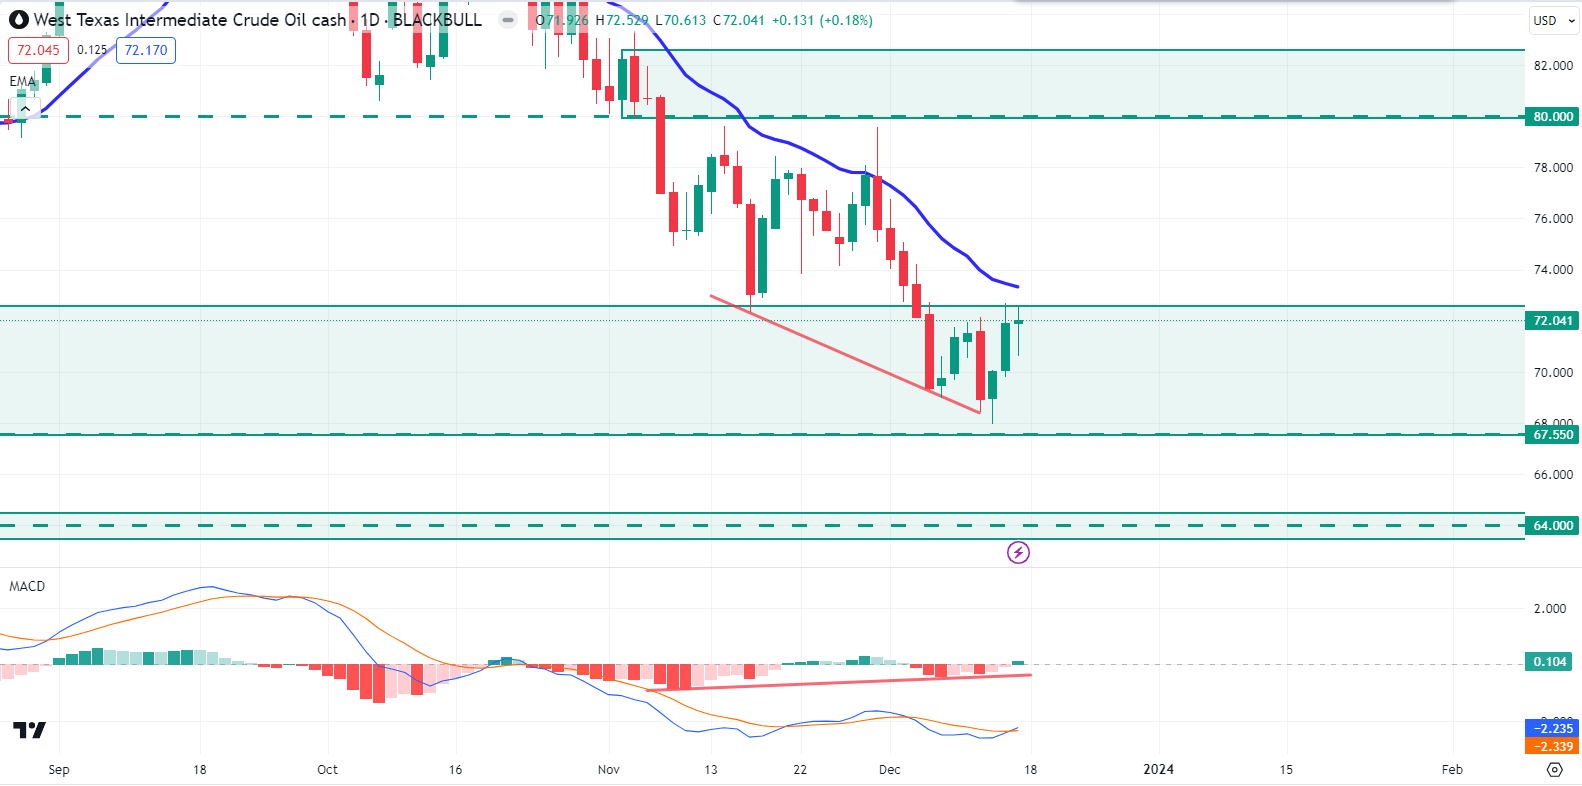
Source: TradingView
In the daily chart, if the price can break above the dynamic level of 20 EMA with a daily bullish candle close, bulls may recover higher toward the $80.00 price area in the days ahead. Moreover, the MACD indicator created a bullish divergence, indicating that bulls may recover upward.
On the bearish side, if the price rejects the dynamic level of 20 EMA with a daily bearish candle close, bears may push the price down to the $64.00 price area in the coming days.