EURUSD
Fundamental Perspective
The EURUSD pair closed the week lower as the US Dollar gained strength in a risk-averse market, though the currency pair remained within a tight range. Investor caution supported the Greenback, while profit-taking in the final hours relieved the Euro. The pair finished below the 1.0500 mark as traders prepared for the last central bank meetings of the year.
The European Central Bank (ECB) lowered its primary interest rates by 25 basis points each, in line with expectations, reducing the deposit facility, primary refinancing, and marginal lending rates to 3.00%, 3.15%, and 3.40%, respectively. Although the ECB revised its growth projections for the coming years, President Christine Lagarde’s less hawkish rhetoric suggested the bank is approaching a neutral stance. While risks to inflation are now seen as balanced, the ECB emphasized that decisions will remain data-dependent.
In the US, inflation data showed slight increases, with the November Consumer Price Index rising by 2.7% year-on-year and the Producer Price Index increasing by 3%. These figures aligned with expectations but did little to alter market expectations for a 25 basis point Fed rate cut next week.
Looking ahead, the economic calendar is busy with key data releases, including US Retail Sales, EU inflation, and the final Q3 GDP estimate, while central bank meetings will dominate market attention.
Technical Perspective
EURUSD finished with a red candle on the weekly chart, holding the support. The red candle comes after a doji, indicating the bearish trend is intact, leaving sellers optimistic.
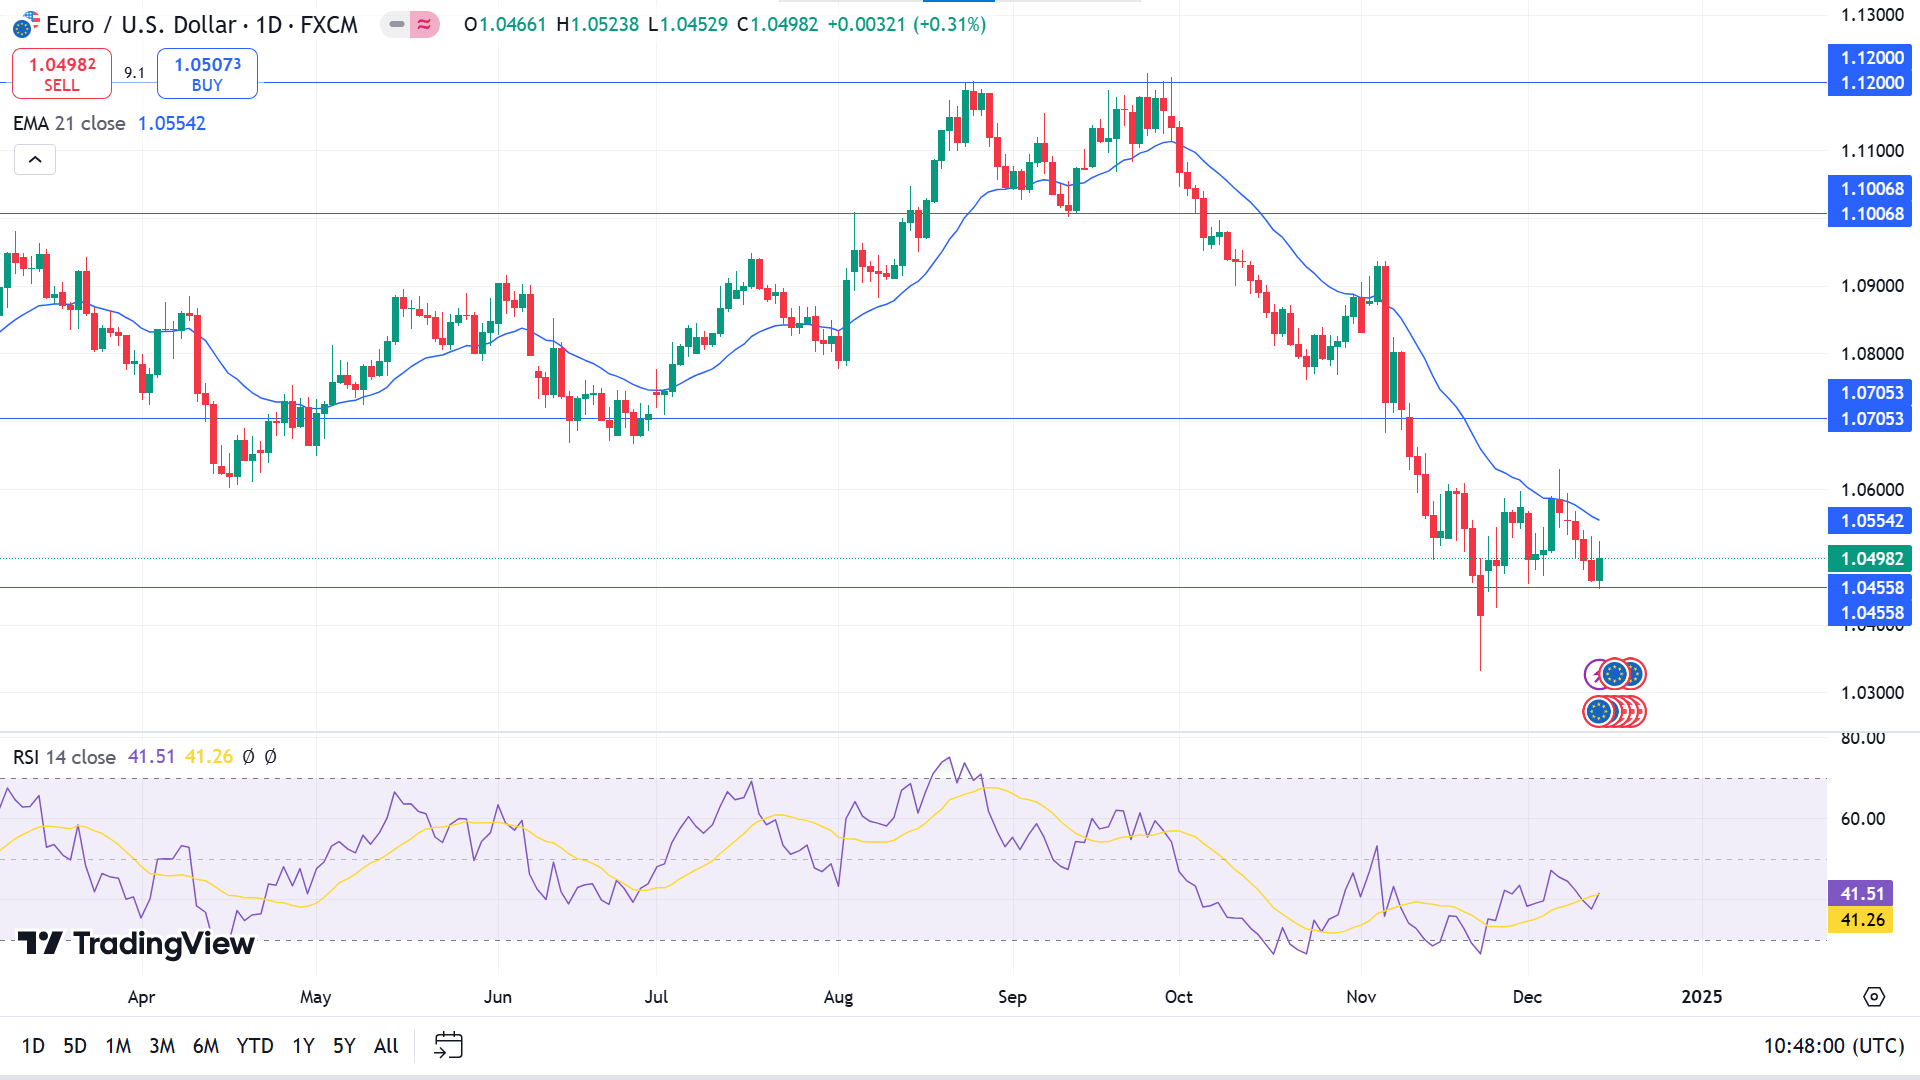
The price moved below the EMA 21 declaring a bearish trend, supported by the Relative Strength Index (RSI) below the neutral line. However, the RSI line edged upward, declaring recent support can sustain and bulls can take control.
Based on this structure, the broader market context suggests sellers looking at the primary barrier near 1.0455 as breaking that level might trigger the price toward a further downside of 1.0345.
Meanwhile, the sell signal might lose validity after overcoming the 1.0455 level. If the support sustains, the pair might hit the primary resistance near 1.0705.
GBPJPY
Fundamental Perspective
The Japanese Yen (JPY) regained some ground after hitting a two-week low against the Japanese Yen. A slight shift in global risk sentiment, driven by rising geopolitical tensions and trade war concerns, sparked some safe-haven demand, providing modest support to the yen.
However, expectations that the Bank of Japan (BoJ) is unlikely to raise interest rates at its upcoming policy meeting next week may limit further upside for the JPY.
This week holds key events, starting with the UK inflation report on Wednesday, followed by the Federal Reserve’s interest rate decision, the Dot Plot chart, and Chairman Jerome Powell’s press conference. On Thursday, the Bank of England's policy decision will take center stage, along with US data, including Jobless Claims and Existing Home Sales. The week will conclude with UK Retail Sales and the US core Personal Consumption Expenditure (PCE) Price Index. In addition, ongoing geopolitical developments in the Middle East and global trade updates will remain essential market drivers.
Technical Perspective
Two consecutive green candles on the weekly chart confirm buyers' activities as the price recovers from the losses of previous bearish weeks.
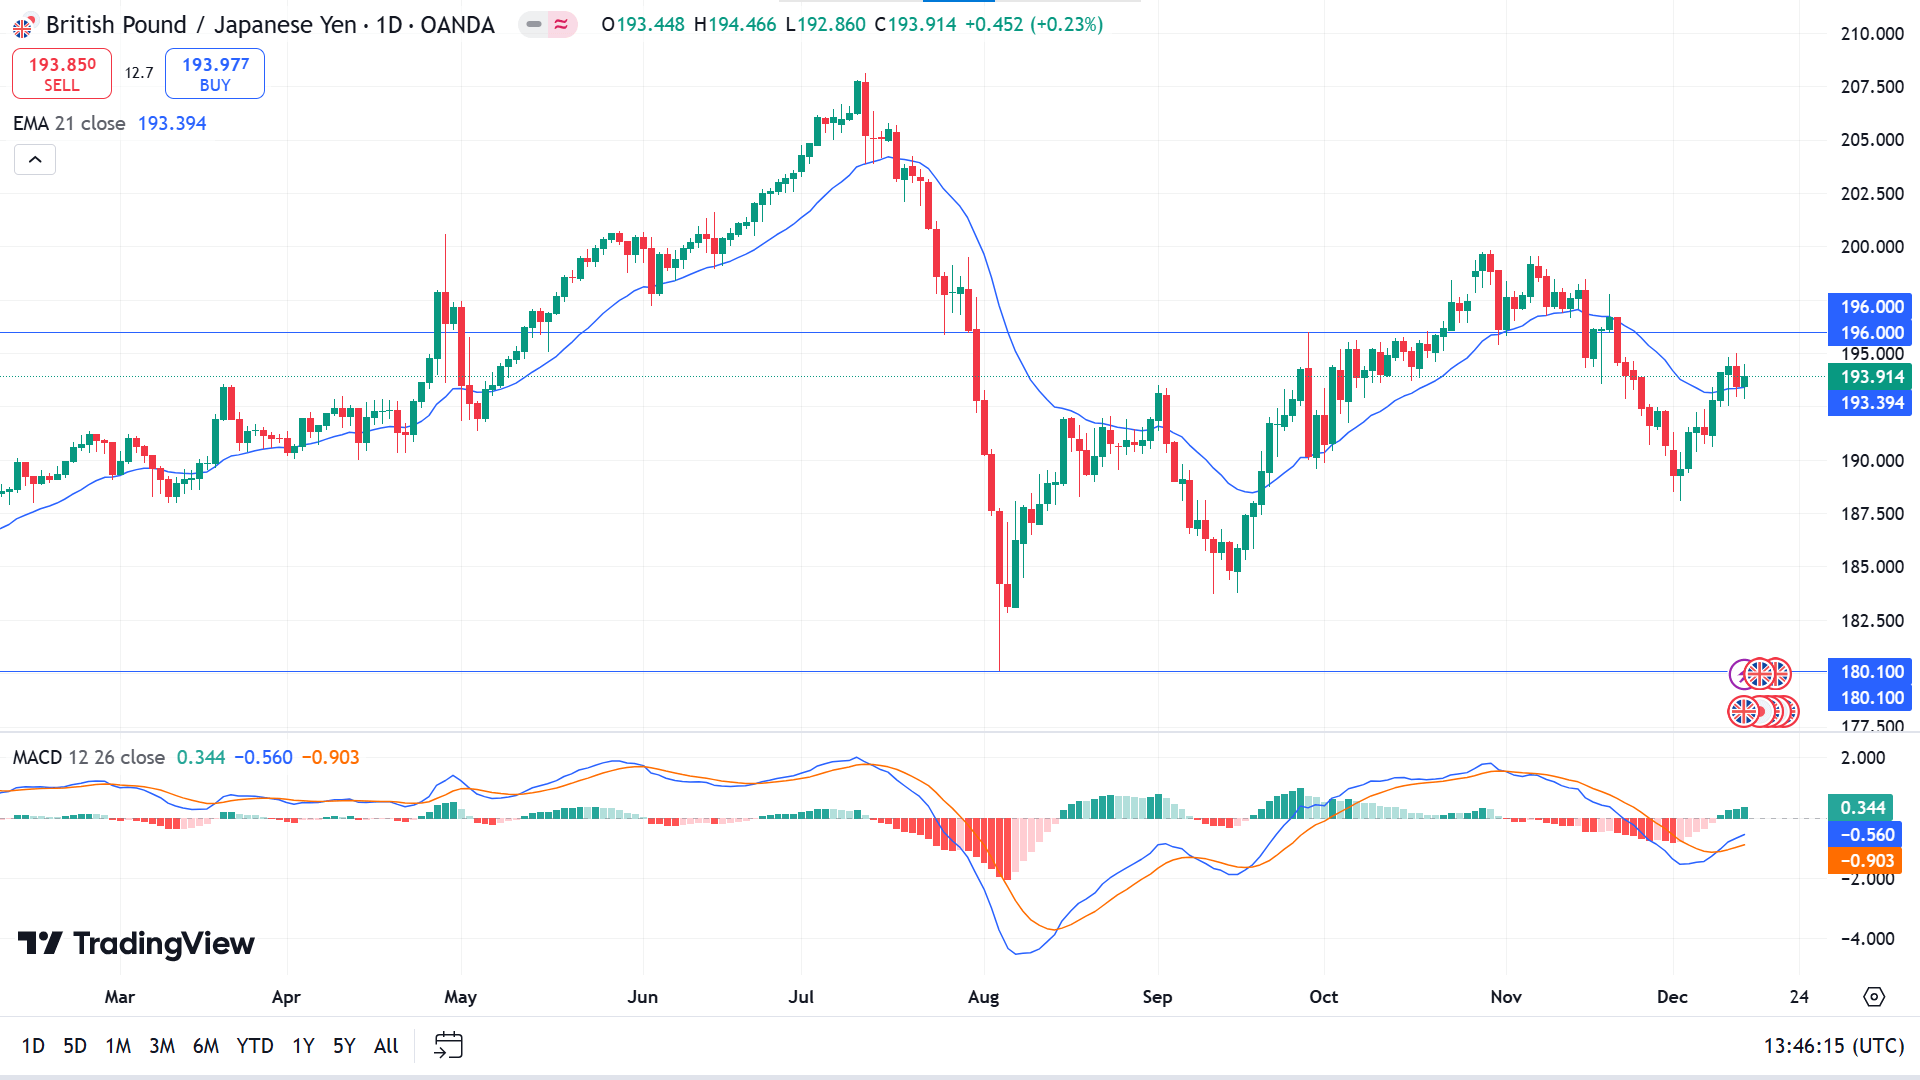
The price climbs above the EMA 21 line on the daily chart, confirming bullish pressure. The MACD indicator reading also supports the move, as the dynamic signal line creates a bullish crossover.
For this week, sellers might consider the 196.00 level historically essential. As long as the price hovers below this crucial line, it can dive toward support at 180.10.
Meanwhile, the sell signal will be invalid if the price breaks above the 196.00 level; it might turn buyers toward the primary resistance near 199.80, followed by the next resistance near 208.12.
NASDAQ 100 (NAS100)
Fundamental Perspective
U.S. stock index gained last week, with Nasdaq 100 futures leading the charge, following an optimistic forecast from Broadcom. The chipmaker projected quarterly revenue exceeding Wall Street’s expectations, driven by strong demand for custom AI chips. This announcement sent Broadcom's shares up by 14.5% in premarket trading.
Broadcom reported $14.1 billion in revenue for its most recent quarter, and the positive outlook lifted sentiment across the semiconductor sector. Marvell Technology saw a 5.7% rise, Micron Technology gained 1.2%, and Nvidia advanced 1.1%.
This surge in technology stocks follows a strong rally that lifted the Nasdaq above 20,000 for the first time on Wednesday. A stable inflation reading bolstered expectations for a 25-basis-point rate cut from the Federal Reserve this week, adding to the momentum. Trader bets on the rate cut stand at over 96%, although some anticipate a pause in January.
Technical Perspective
The Nasdaq 100 index hit ATH, declaring excessive bullish pressure on the asset price, and the trend remains bullish, leaving buyers optimistic.
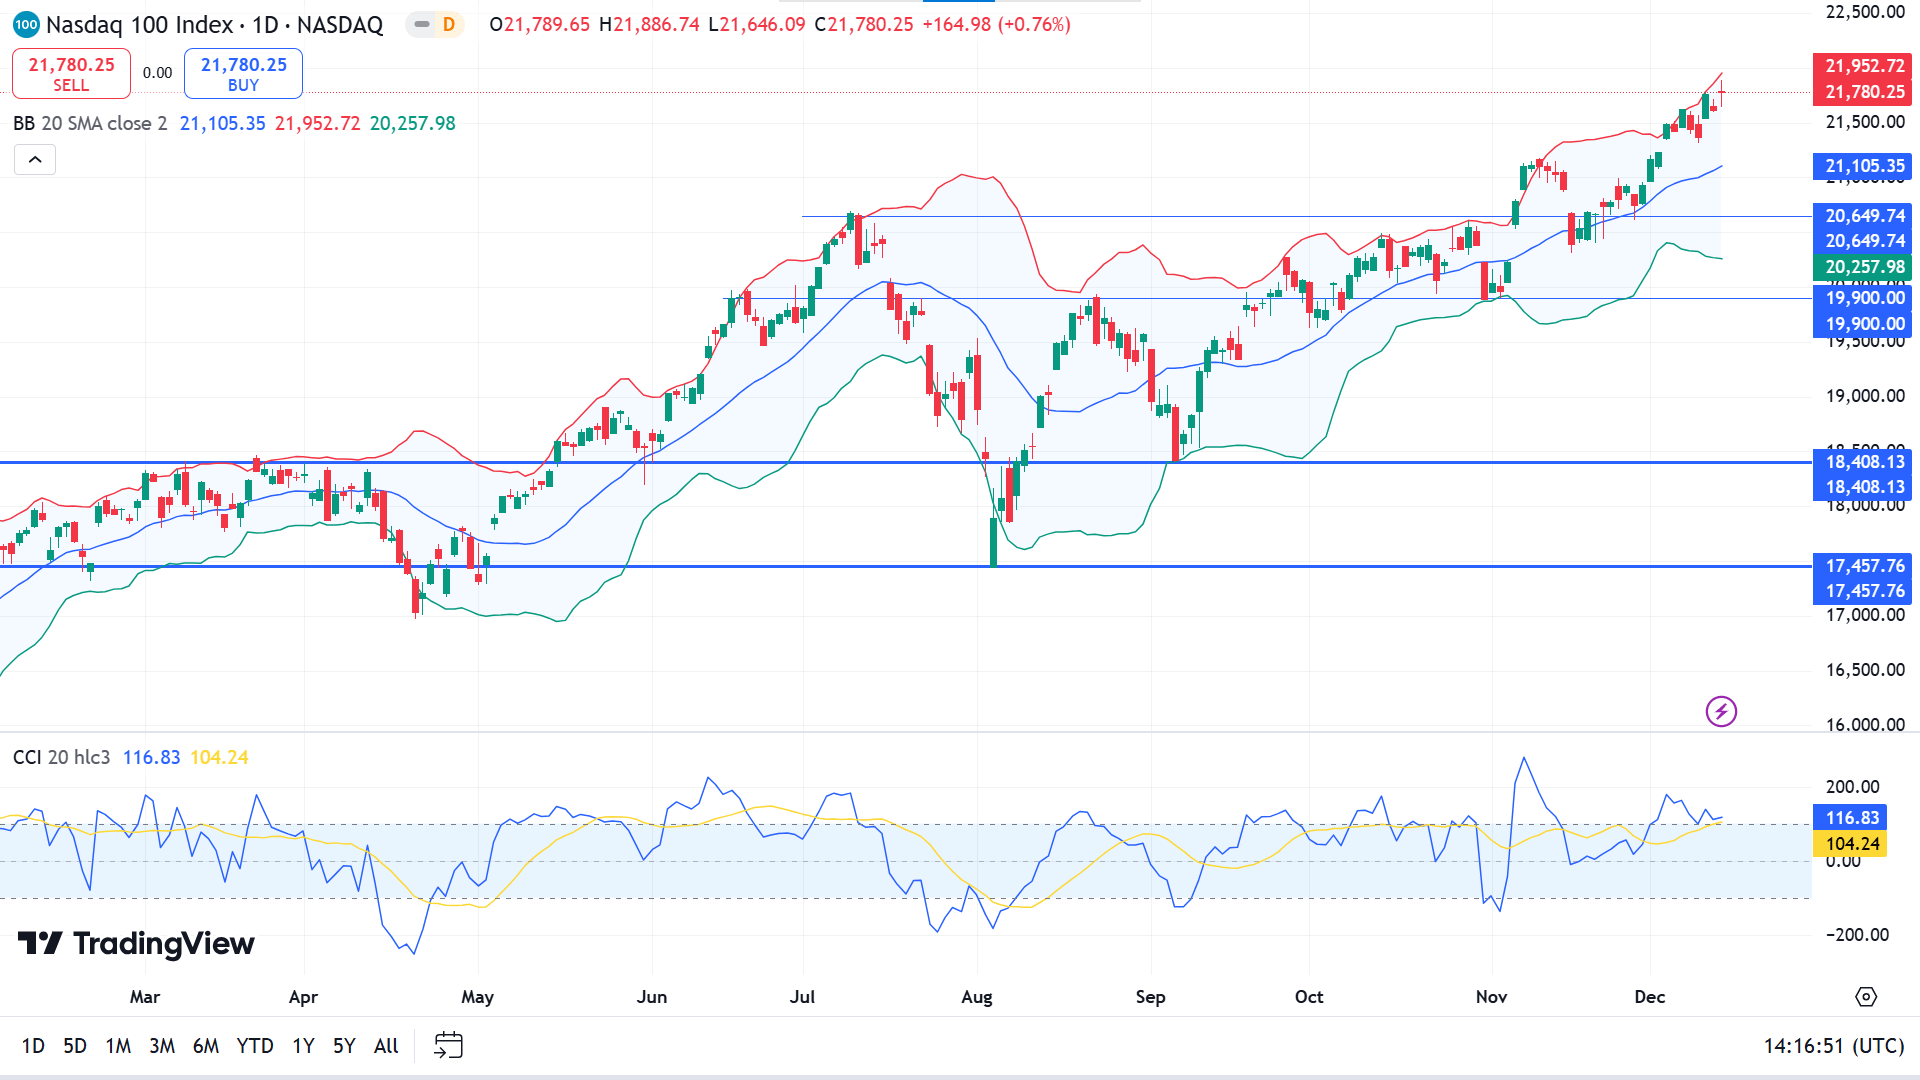
The price moves along with the upper band of the Bollinger band, demonstrating the gradual bullish pressure on the asset price. In contrast, the CCI indicator window confirms the bullish trend through the dynamic line floating above the upper line of the indicator window. Price on the upper band of the Bollinger band and the CCI dynamic line above the upper line of the indicator window signs overbought and a potential retracement.
According to this price action, buyers may primarily look at the 21,140.65 to open adequate long positions; the buy zone can extend toward 20649.74, which can turn the price toward the ATH or beyond.
On the other hand, if the price declines below 20649.74, it might disappoint buyers to reconsider their positions. It might invalidate the current bullish signal, and turn short-term sellers toward support near 19900.00.
S&P 500 (SPX500)
Fundamental Perspective
U.S. benchmark equity indexes passed sideways week as investors awaited the Federal Reserve’s upcoming decision on monetary policy. The S&P 500 remained flat at 6,051.1, with communication services experiencing the most considerable losses, while technology stocks were the leading gainers.
For the week, the S&P 500 fell 0.6%, the Nasdaq increased by 0.3%, and the Dow retreated by 1.8%.
U.S. economic data showed that consumer inflation in November met market expectations, while producer prices exceeded forecasts. According to the CME FedWatch tool, the likelihood of a 25-basis-point rate cut by the Federal Open Market Committee rose to 93%, up from 86% a week earlier.
The two-year yield increased by 6.1 basis points to 4.25%, while the 10-year U.S. Treasury yield rose 7.3 basis points to 4.4%
Technical Perspective
The last red candle closed within the range of the previous green candle in the weekly chart, reflecting the consolidation phase and providing mixed signals to investors.
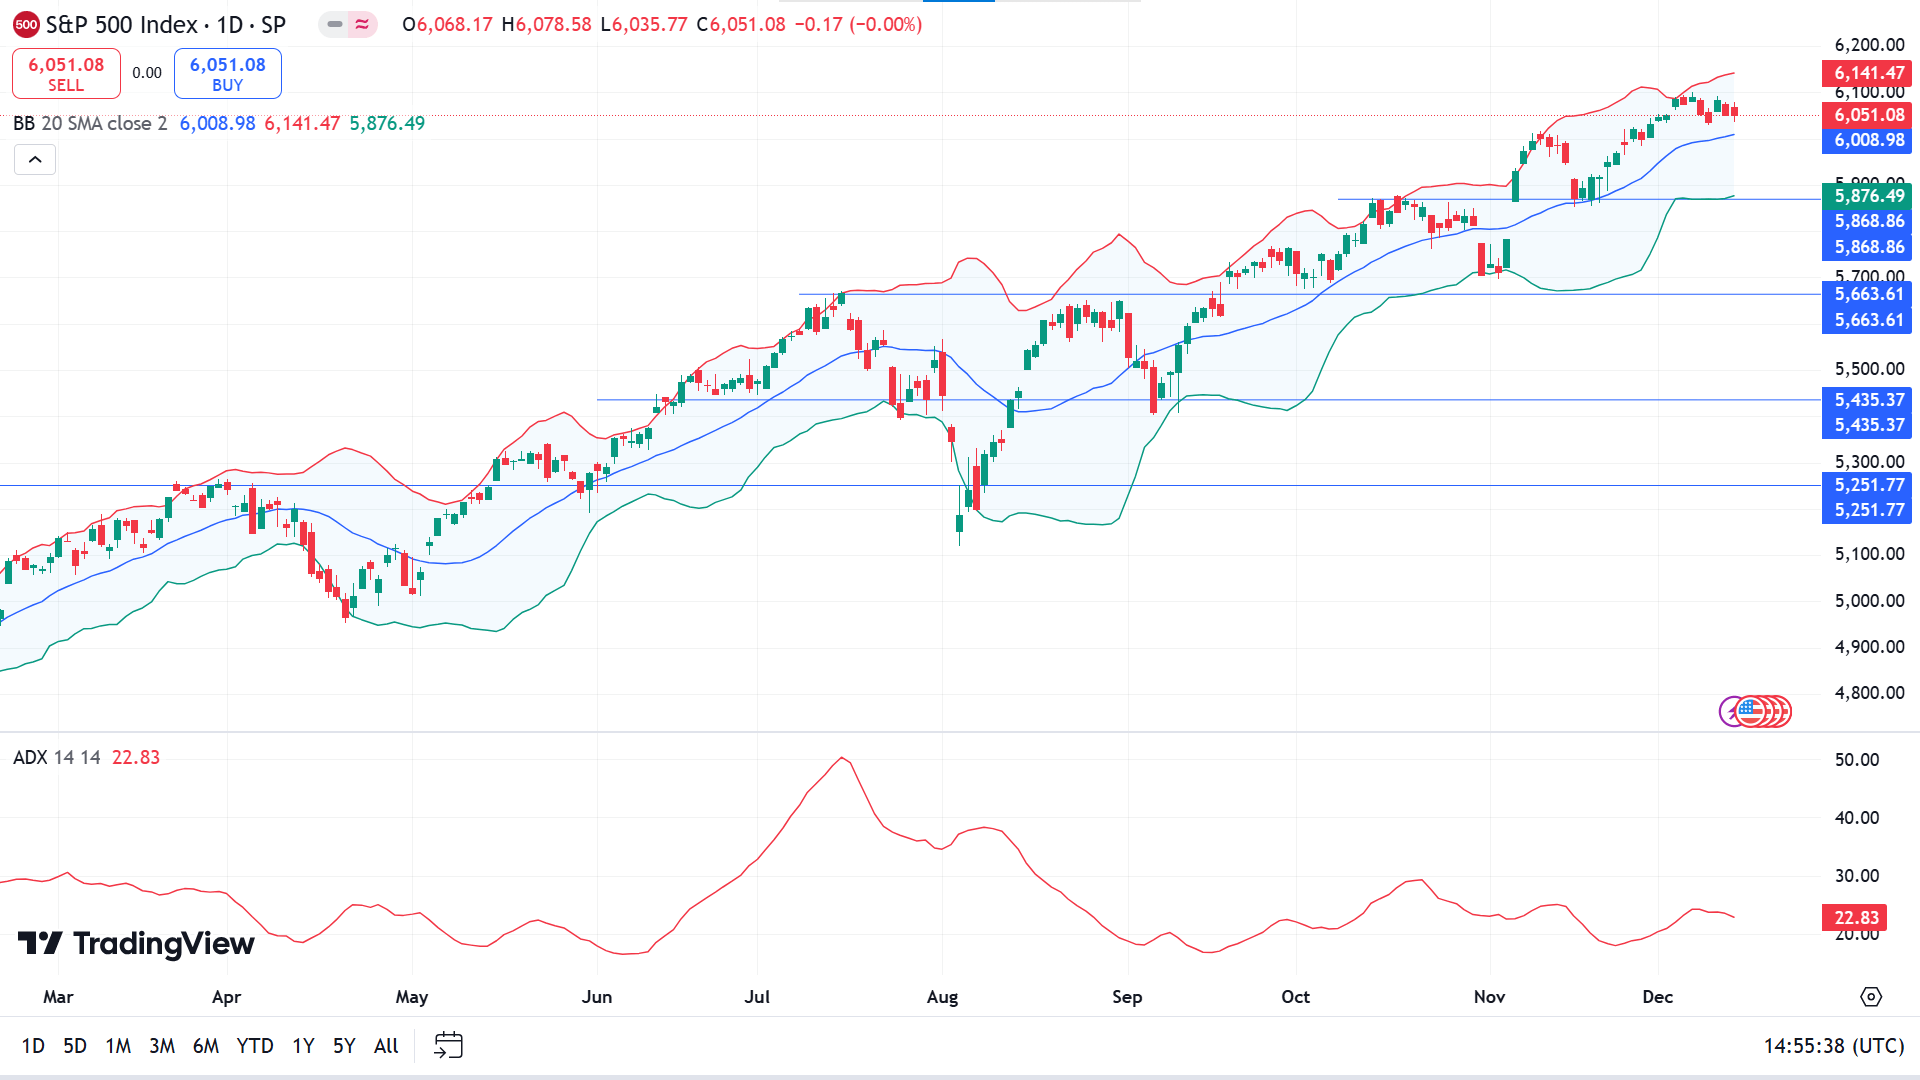
The S&P 500 index remains on the upper channel of the Bollinger band indicator while creating smaller candles and moves sideways on the daily chart. In the meantime, the ADX reading reaches below 25, declaring the current trend may lose power and signal potential retracement downward.
According to this price action, buyers may look primarily at the 6003.75 level, whereas more adequate long positions can be open near 5868.86.
Meanwhile, if the price dives below 5868.86, it might reject the bullish signal, disappoint buyers, and trigger short-term sellers toward the support level near 5663.61.
Gold (XAUUSD)
Fundamental Perspective
Gold (XAU/USD) regained ground after two weeks of losses but struggled to hold above $2,700 due to mixed market signals. Support came from the People's Bank of China, which reported a five-ton increase in gold reserves in November, marking its first purchase in six months. Additional momentum stemmed from China’s pledge to adopt more accommodative monetary and fiscal policies in 2024, improving the demand outlook. The metal rose 1% Monday and extended gains Tuesday as China’s trade surplus widened to $97.44 billion in November.
However, mixed U.S. data later shifted market dynamics. The Consumer Price Index rose to 2.7% in November, bolstering speculation of a Fed rate cut in December and briefly lifting Gold above $2,700. Yet, stronger-than-expected Producer Price Index data and rising U.S. Treasury yields reversed gains. Meanwhile, easing geopolitical tensions, including a UN-backed ceasefire call in Gaza, weighed further on Gold.
Markets now focus on the Fed’s policy decision, which is widely expected to deliver a 25 bps rate cut and revised economic projections. Any dovish shift could weaken the USD and lift Gold, while cautious messaging from Chair Powell may keep gains in check. Year-end volatility could add further unpredictability.
Technical Perspective
The last weekly candle closed as an inverted hammer with a small green body and long upper wick reflecting bearish weight on the asset price, leaving sellers optimistic.
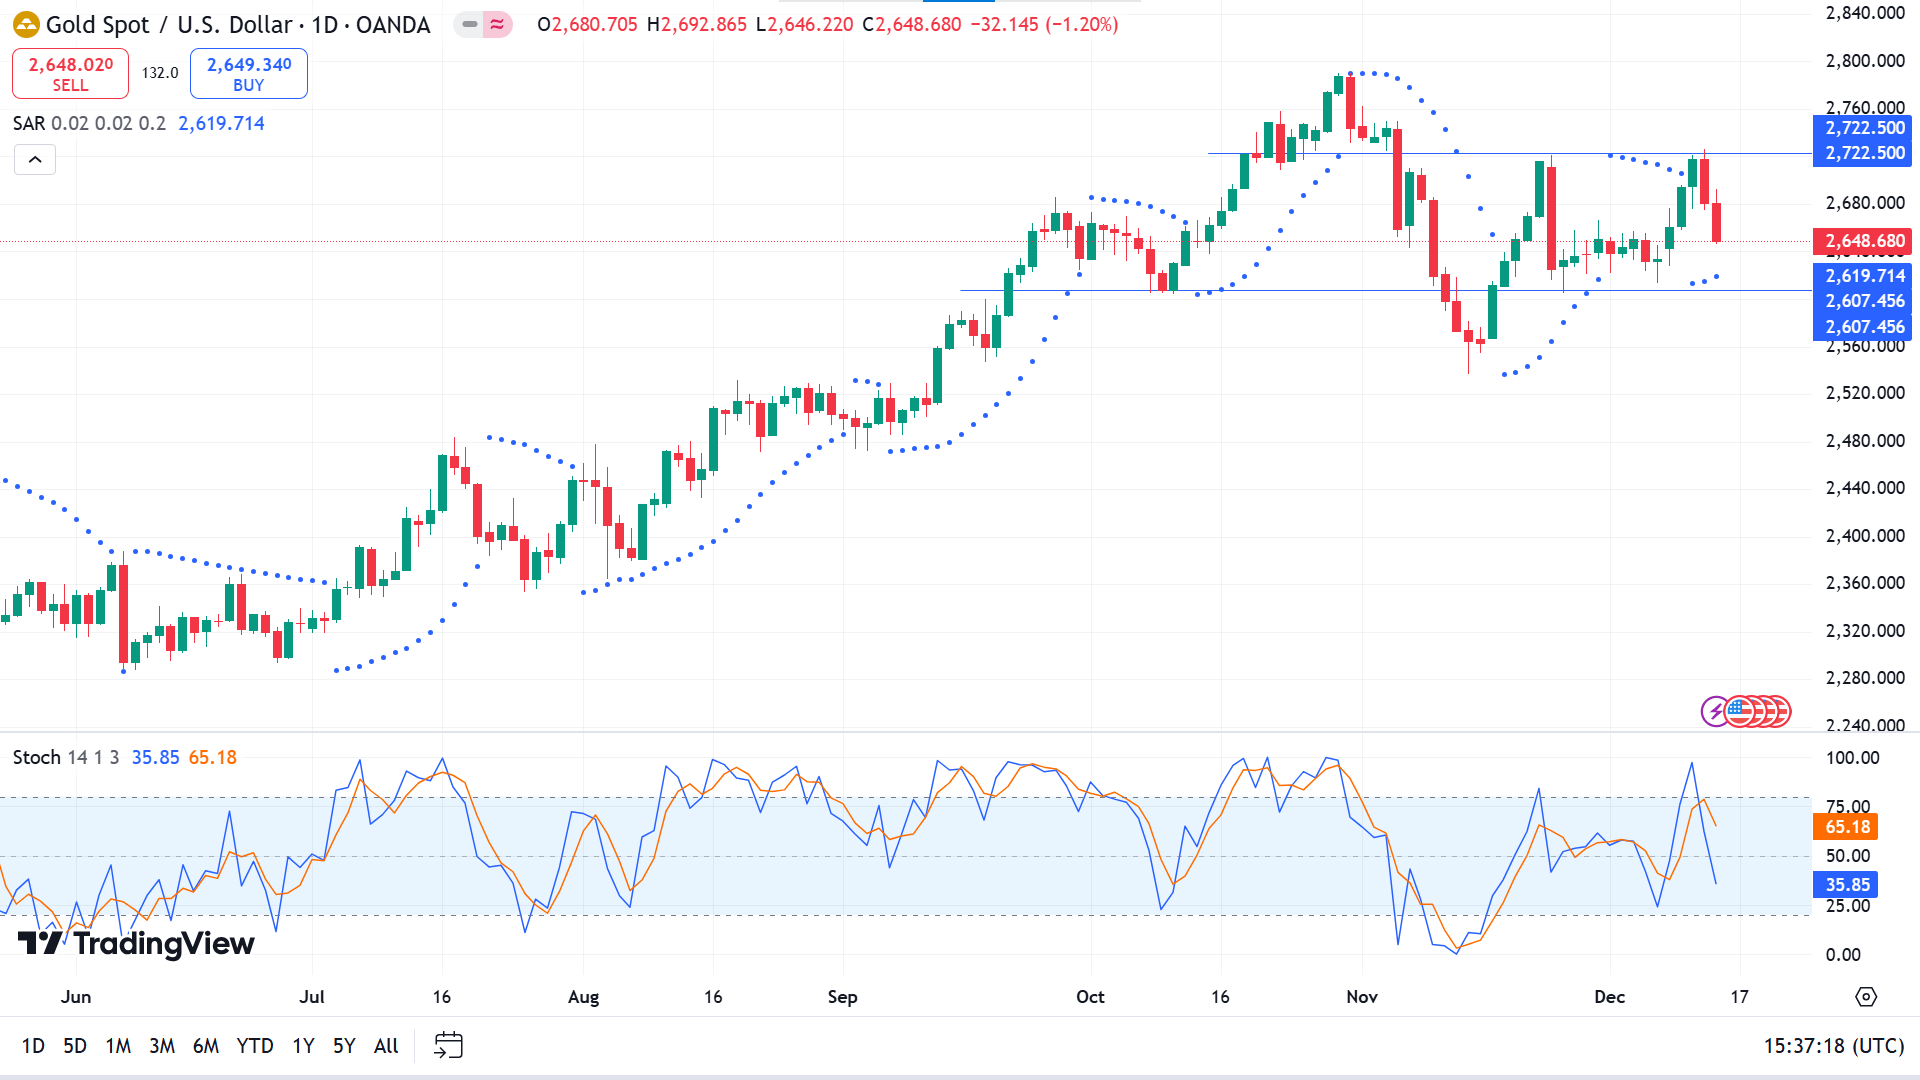
On the daily chart, the price created a bottom near 2536.85 after the head and shoulder pattern, then bounced back toward 2722.50 and returned to support near 2607.45. A double top is visible when the Parabolic SAR still creates dots below the price candles, reflecting bullish pressure. Still, the Stochastic indicator window shows significant bearish pressure, leaving a mixed signal for precious metal investors.
Traders may wait for the price to reach the range bottom near 2607.45 to open adequate long positions toward the resistance near 2722.50, following the ATH near 2790.17.
Meanwhile, if the price drops below 2607.45, it would invalidate the bullish signal and trigger short-term sellers as the overall trend remains bullish. If the price dives below 2607.45, it can continue to fall toward the November low near 2536.85, extending toward the next support near 2474.95.
Bitcoin (BTCUSD)
Fundamental Perspective
Bitcoin (BTC) reclaimed the $100K threshold on Friday, trading near $100,100 after a week of heightened volatility.
CoinGlass said over $1.69 billion was liquidated across the crypto market, with $180 million directly tied to BTC. Analysts noted that traders rushing into leveraged longs were caught in a cascade of liquidations as prices reversed sharply.
Profit-taking was another key factor, as Sentiments Network Realized Profit/Loss metric surged from $743.2 million on Sunday to $5.95 billion by Monday, signaling significant sell-offs. Microsoft’s rejection of a proposal to include Bitcoin on its balance sheet further weighed on sentiment, with the board citing price volatility and adherence to traditional investment strategies. The proposal argued for Bitcoin as an inflation hedge, but the decision briefly pressured BTC prices to lower.
Institutional interest remained robust despite the setback, with Bitcoin ETFs recording $1.72 billion in inflows by Thursday. Arjun Vijay, COO of Indian exchange Giottus, emphasized the growing incentive for corporations to adopt BTC, citing MicroStrategy’s success as a precedent. Vijay predicts that more companies will revisit this decision as Bitcoin’s price milestones prompt shareholder inquiries.
Bitcoin surged past $100K midweek, buoyed by optimism following U.S. CPI data meeting expectations at 2.7%, raising hopes for a Federal Reserve rate cut. While concerns over quantum computing advances, such as Google’s “Willow” chip, briefly resurfaced, experts maintain that Bitcoin's encryption remains secure.
Technical Perspective
The weekly candle ended as a hammer with a green body and long upper wick, posting consecutive gaining weeks after the range breakout, leaving buyers optimistic as the price remains above the 100k mark.
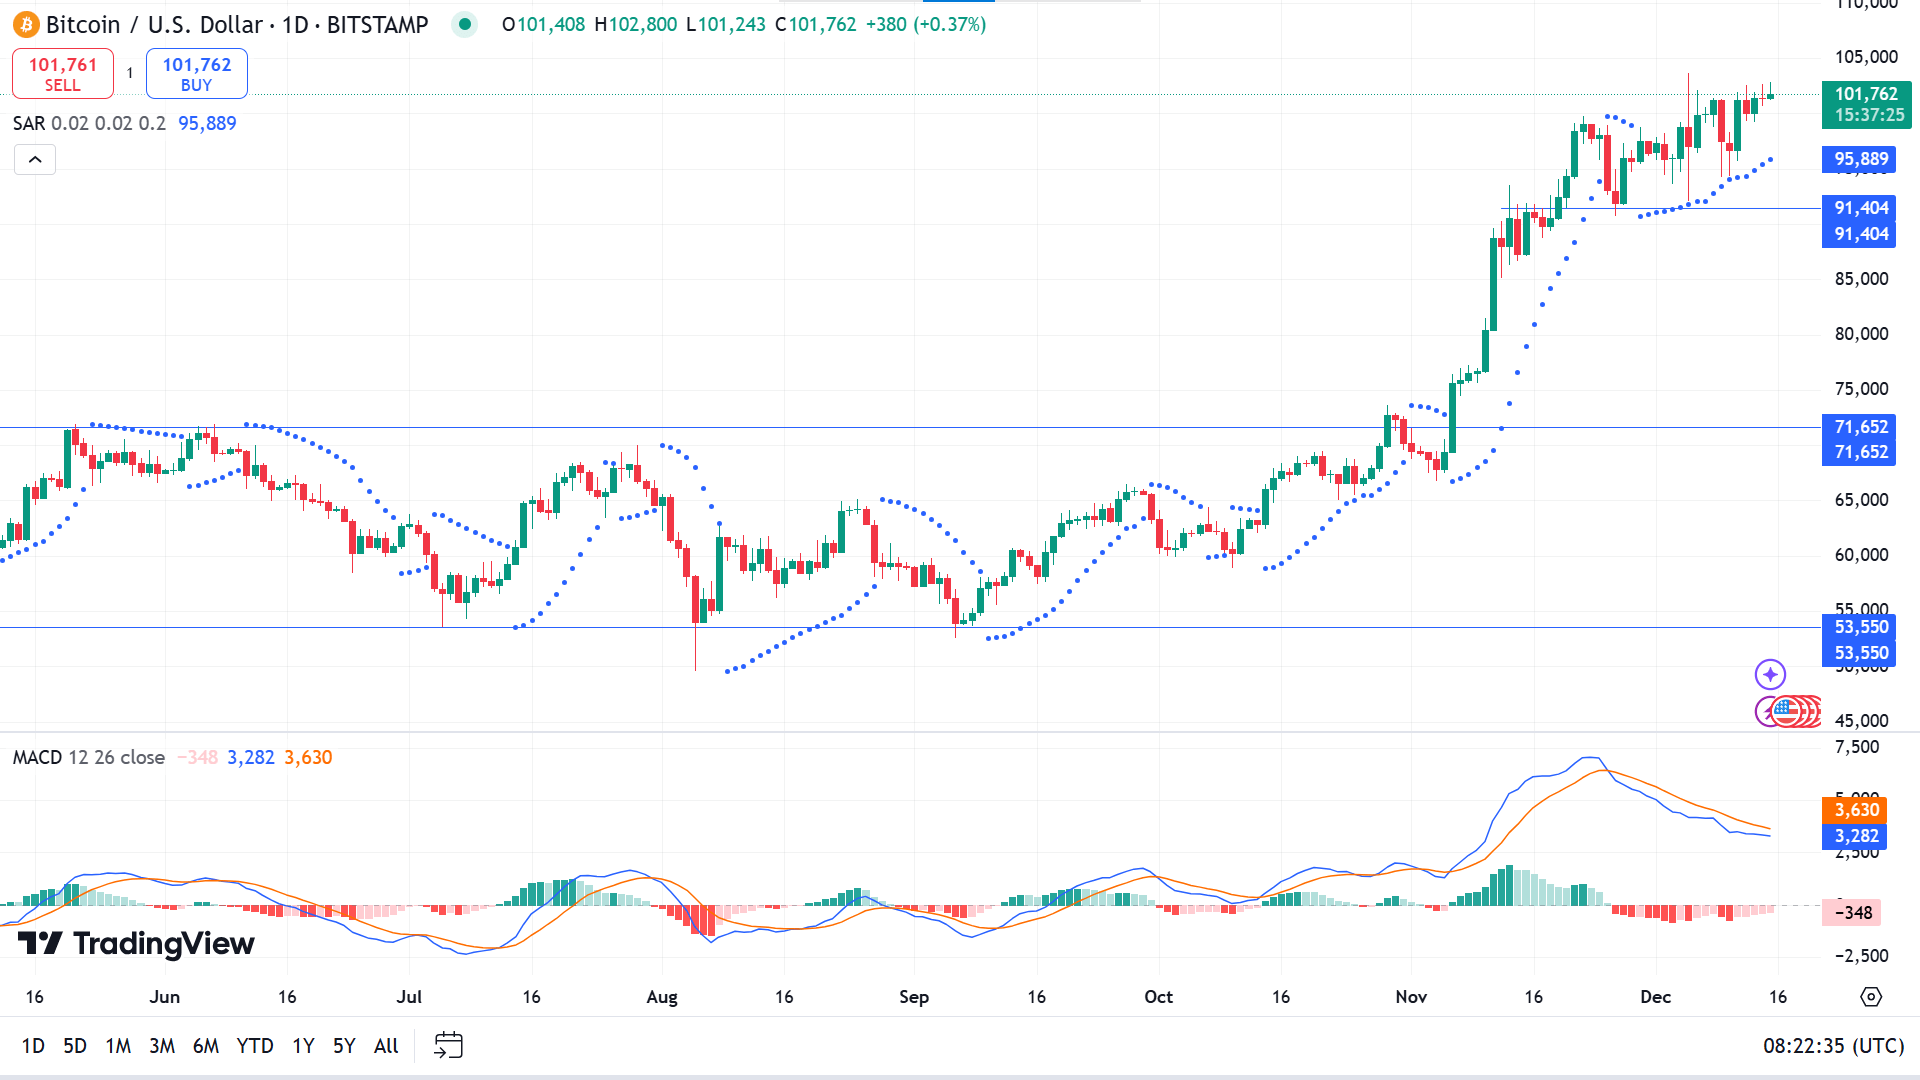
The price is increasing on the daily chart as the Parabolic SAR dots appear below price candles. At the same time, the MACD reading shows opposing force through a bearish crossover between dynamic signal lines and red histogram bars below the midline of the indicator window. Combining all these leaves a mixed signal to the investors.
Price action traders may observe 91,404 to open adequate long positions, as the level looks like an acceptable support level and works as a seller barrier, which can turn the price toward the ATH.
However, the bullish signal would be invalidated if the price declines below 91,404, which might trigger short-term sellers toward support near 80,563.
Ethereum (ETHUSD)
Fundamental Perspective
Ethereum (ETH) rose 1% on Friday, bolstered by optimism over increased inflows into ETH exchange-traded funds (ETFs). Market expectations are growing that a change in SEC leadership could lead to the regulator permitting staking in ETH ETFs, a development that may push ETH beyond the key $4,000 level.
Ethereum ETFs have maintained strong momentum, recording $273.7 million in net inflows on Thursday, extending their streak to 14 consecutive days, according to Coinglass data. BlackRock’s iShares Ethereum (ETHA) and Fidelity’s Ethereum Fund (FETH) have been the primary contributors, with cumulative inflows of $3.19 billion and $1.37 billion, respectively. Despite $3.52 billion in outflows from Grayscale’s ETHE, the ETH ETF category has netted $2.24 billion, reflecting robust demand.
Jay Jacobs, US Head of Thematic and Active ETFs at BlackRock, remarked that the current inflow levels for both BTC and ETH ETFs are merely the beginning. He emphasized BlackRock’s strategy to expand the reach of its existing products rather than pursuing ETFs for other altcoins.
VanEck has predicted that staking will be integrated into ETH ETFs by 2025. Although the SEC previously opposed staking features, the nomination of Paul Atkins as the next SEC Chair could signal a more favorable regulatory approach. Such a shift may drive further inflows, potentially elevating Ethereum ETFs above Bitcoin ETFs in popularity.
Technical Perspective
The last weekly candle ended hammer with a red body and lower wick, reflecting a pause in the current uptrend as the price hit a yearly high on the previous week, leaving buyers optimistic as the trend remains intact.
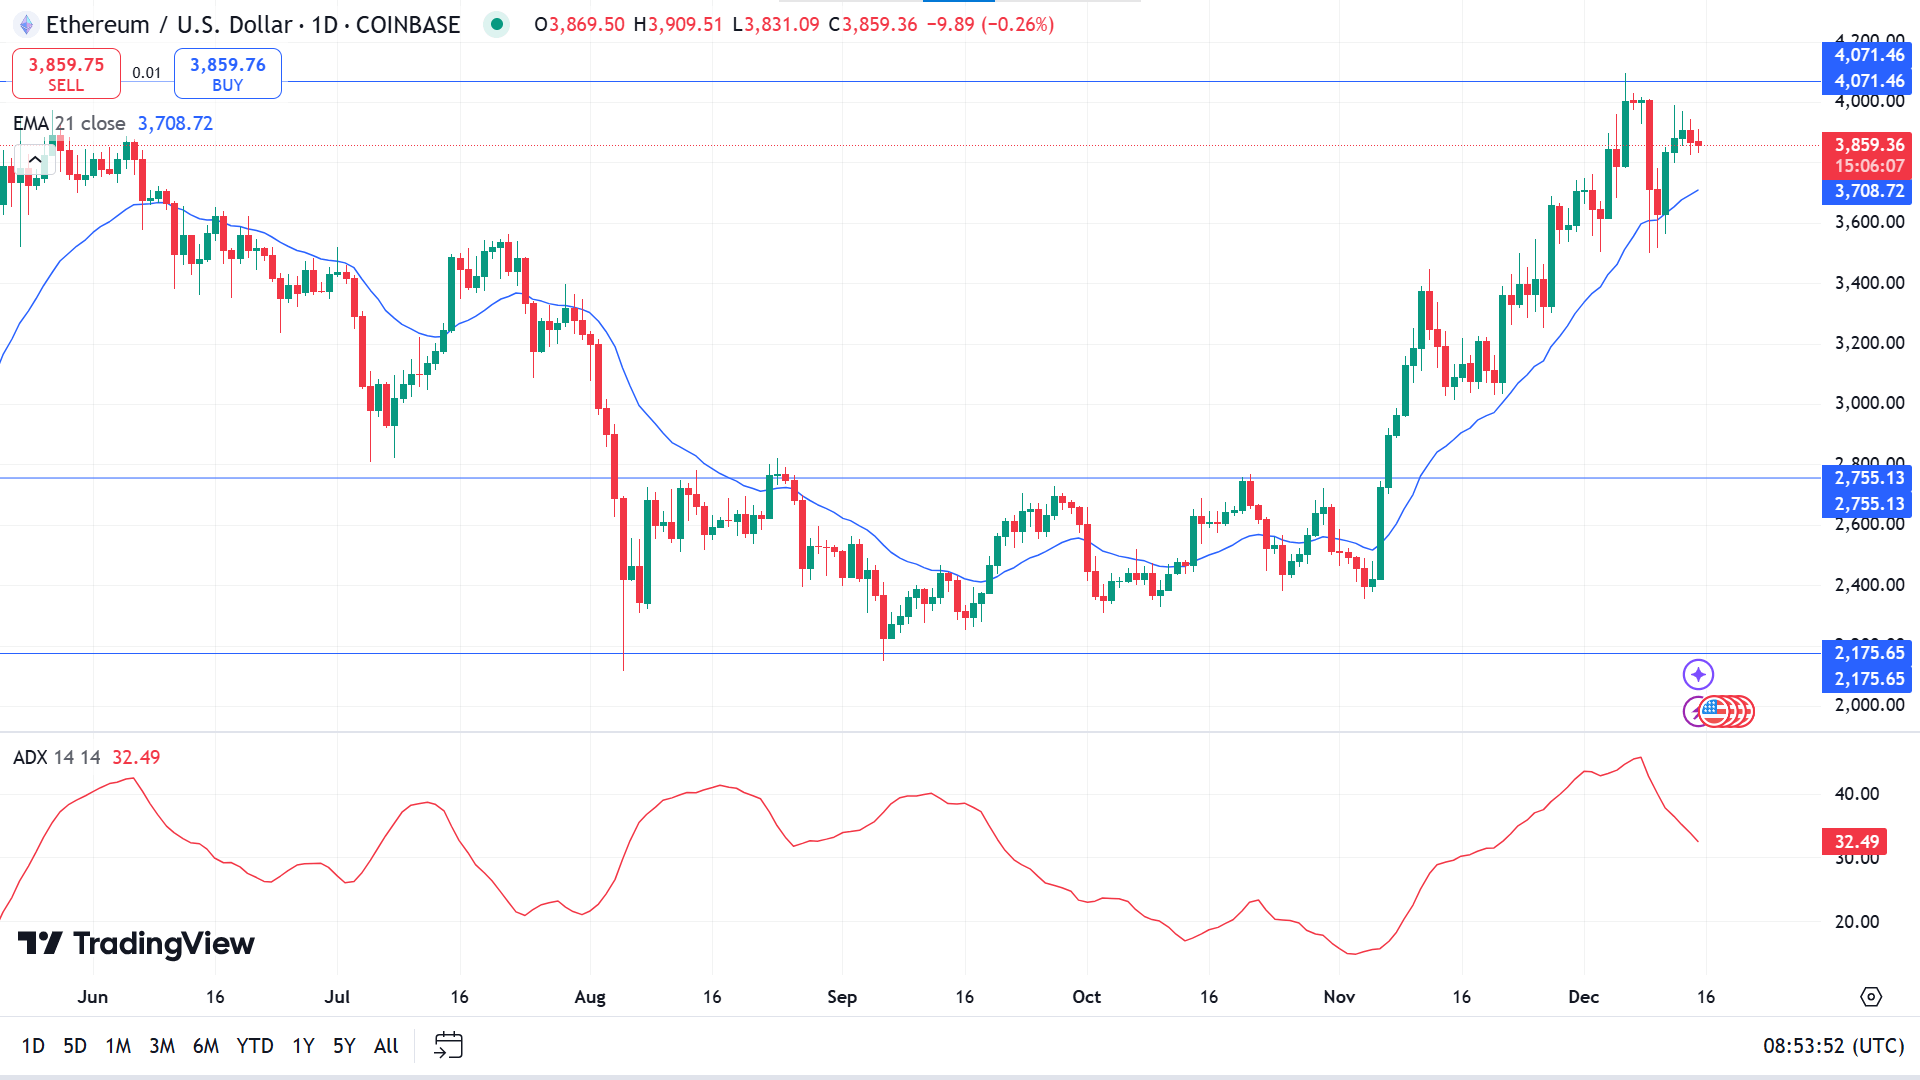
Ethereum remains bullish on the daily chart as the candles move above the EMA 21, whereas the ADX dynamic line slopes downward on the indicator window. However, the value is still above 30, indicating sufficient active pressure on the current trend.
Evaluating the market context through price action concepts, sellers are primarily observing the 4071.46 to open adequate short positions as the price can dive toward 3377.71 for accumulation.
Meanwhile, if the price successfully breaks above the distribution level of 4071.46, it would invalidate the bearish signal and enable buying opportunities toward the next resistance near 4782.23.
Tesla Stock (TSLA)
Fundamental Perspective
Tesla (TSLA) has rallied 69% since Donald Trump’s recent election victory, driven by expectations of regulatory easing for autonomous vehicles under the new administration. On Wednesday, Tesla’s stock reached an all-time closing high of $424.77, surpassing its previous peak of $409.97 in November 2021. This surge has pushed the company’s market value up 71% in 2024, with November alone contributing a 38% gain, its strongest monthly performance since January 2023.
Elon Musk’s outspoken support for Trump has added momentum to the stock’s rise. Federal Election Commission records show Musk contributed $277 million to pro-Trump efforts, funding voter registration in key states. Musk’s close alignment with the incoming administration has earned him the role of leading the “Department of Government Efficiency,” where he is expected to influence federal policies, including expediting the approval process for self-driving vehicles, which is currently managed at the state level.
Wall Street’s optimism has further bolstered Tesla’s momentum. Goldman Sachs and other analysts raised price targets, citing Tesla’s AI potential and the broader market’s forward-looking sentiment. Analyst Craig Irwin noted that Musk’s alliance with Trump has likely doubled Tesla’s fan base, boosting credibility and demand for the company’s vision.
Technical Perspective
The weekly chart shows solid bullish pressure on the asset, reaching ATH and reflecting excessive positive pressure on the asset, which keeps buyers optimistic.
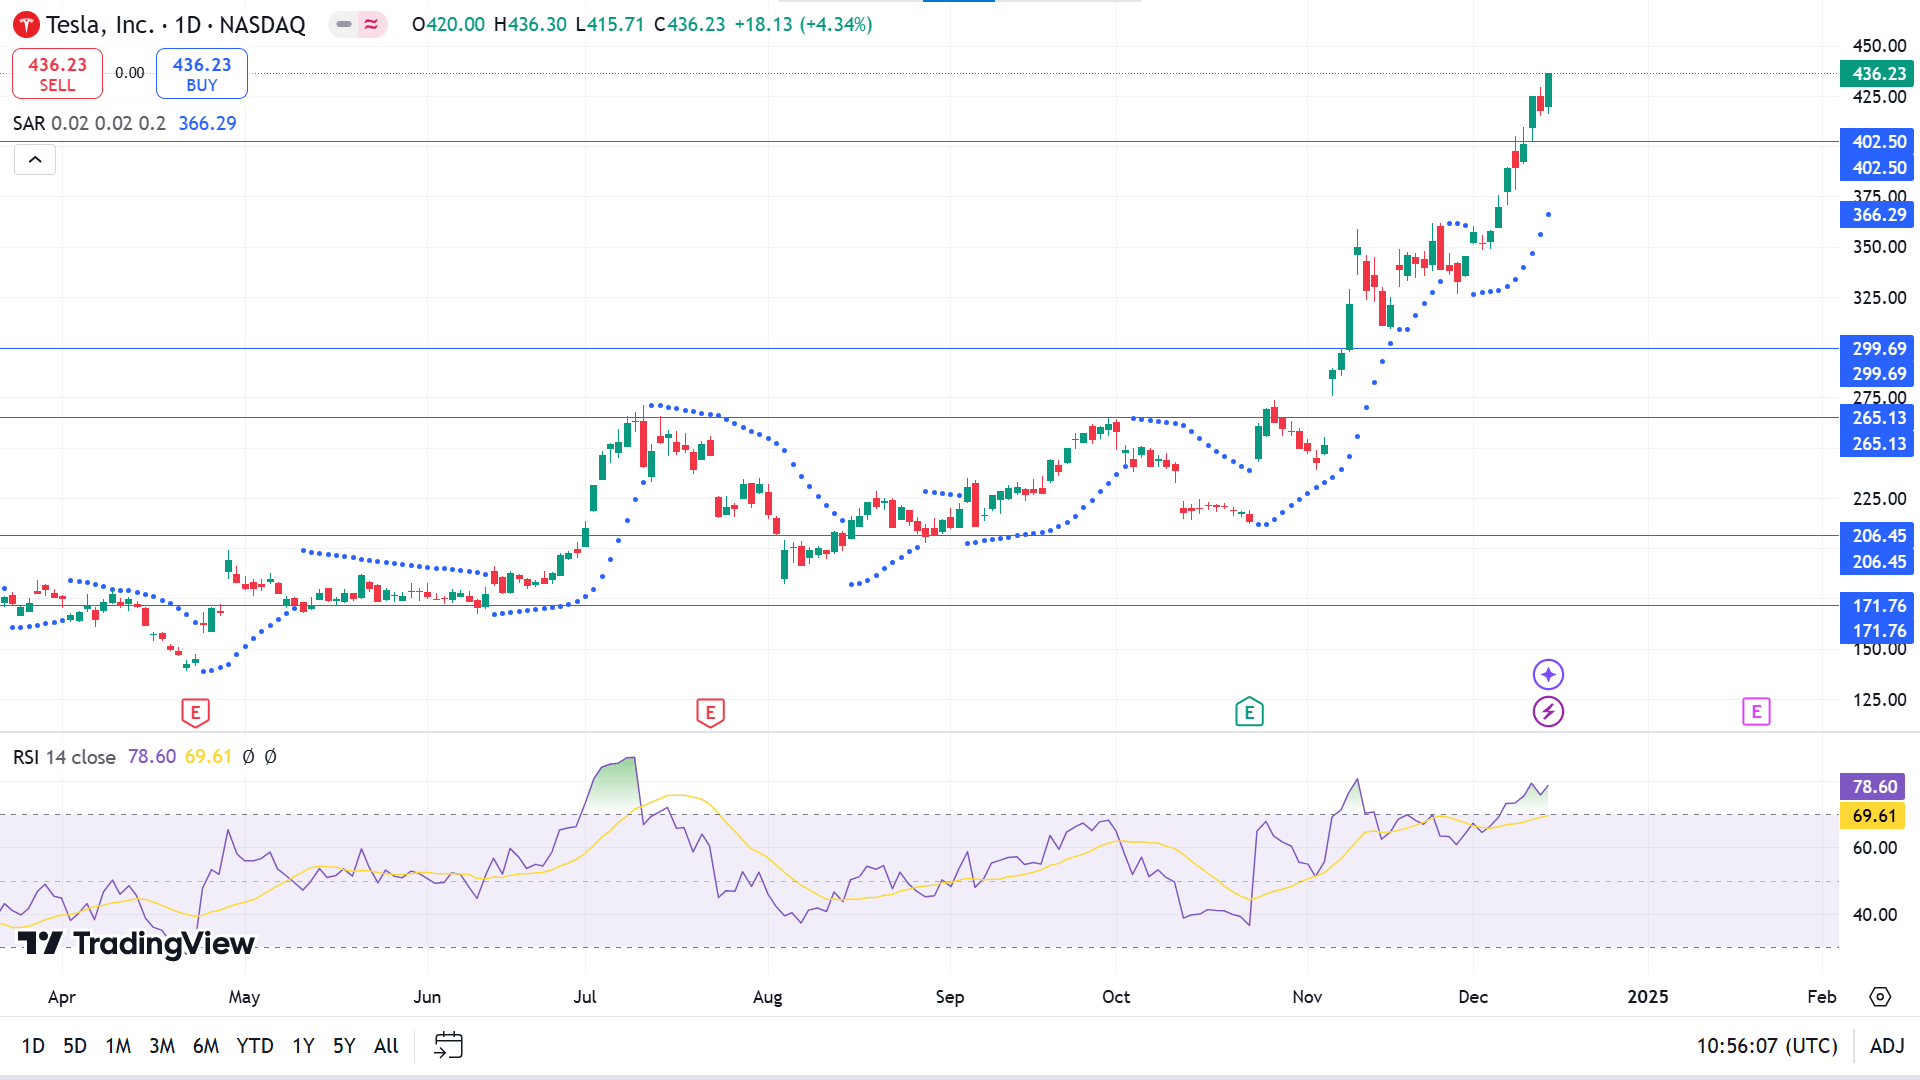
The price breaks above the previous peak and reaches a new ATH on the daily chart; the Parabolic SAR continues creating dots below the price candles, while the RSI dynamic line floats above the upper line of the indicator window, supporting the robust bullish pressure.
When combining all these market contexts through price action concepts, buyers may wait till the price returns to 402.50, validating the breakout to open potentially profitable long positions toward new ATH.
In contrast, a daily red candle close below 402.50 would invalidate the bullish signal, disappoint buyers, and might spark selling opportunities toward 340.30 to accumulate bullish pressure.
Nvidia Stock (NVDA)
Fundamental Perspective
Nvidia CEO Jensen Huang anticipates data center operators will invest $1 trillion over the next four years to upgrade infrastructure, driven by growing AI demands. This estimate could be conservative, given forecasts from other sources. Nvidia's stock has the potential to rise another 82%, surpassing $200 by 2025, fueled by its next-generation Blackwell architecture and dominance in AI data center chips.
The H100 GPU dominated the market in 2023, securing a 98% share. While it remains a top performer, Nvidia’s Blackwell GPUs, offering a 30-fold improvement in AI inference speed, are rapidly gaining traction. A single GB200 GPU, part of the Blackwell-based NVL72 system, costs approximately $83,000—double the price of the H100—but its superior efficiency translates into substantial cost savings for companies scaling AI workloads.
Microsoft is leading Blackwell purchases, using the GPUs for internal AI projects and renting capacity to other developers via Azure. Other cloud giants like Amazon Web Services, Google Cloud, and Oracle are expected to follow suit. Nvidia shipped 13,000 Blackwell units in its fiscal Q3 2025 and is projected to ship up to 300,000 units in late 2024 and 800,000 in early 2025, reflecting staggering demand. Oracle alone plans to deploy over 131,000 Blackwell GPUs, underscoring the technology's transformational potential.
Technical Perspective
NVDA returns to the baseline in the weekly chart, creating a red candle and reflecting the consolidating phase as it creates hammers of different colors at the peak, sometimes indicating a trend-changing environment.
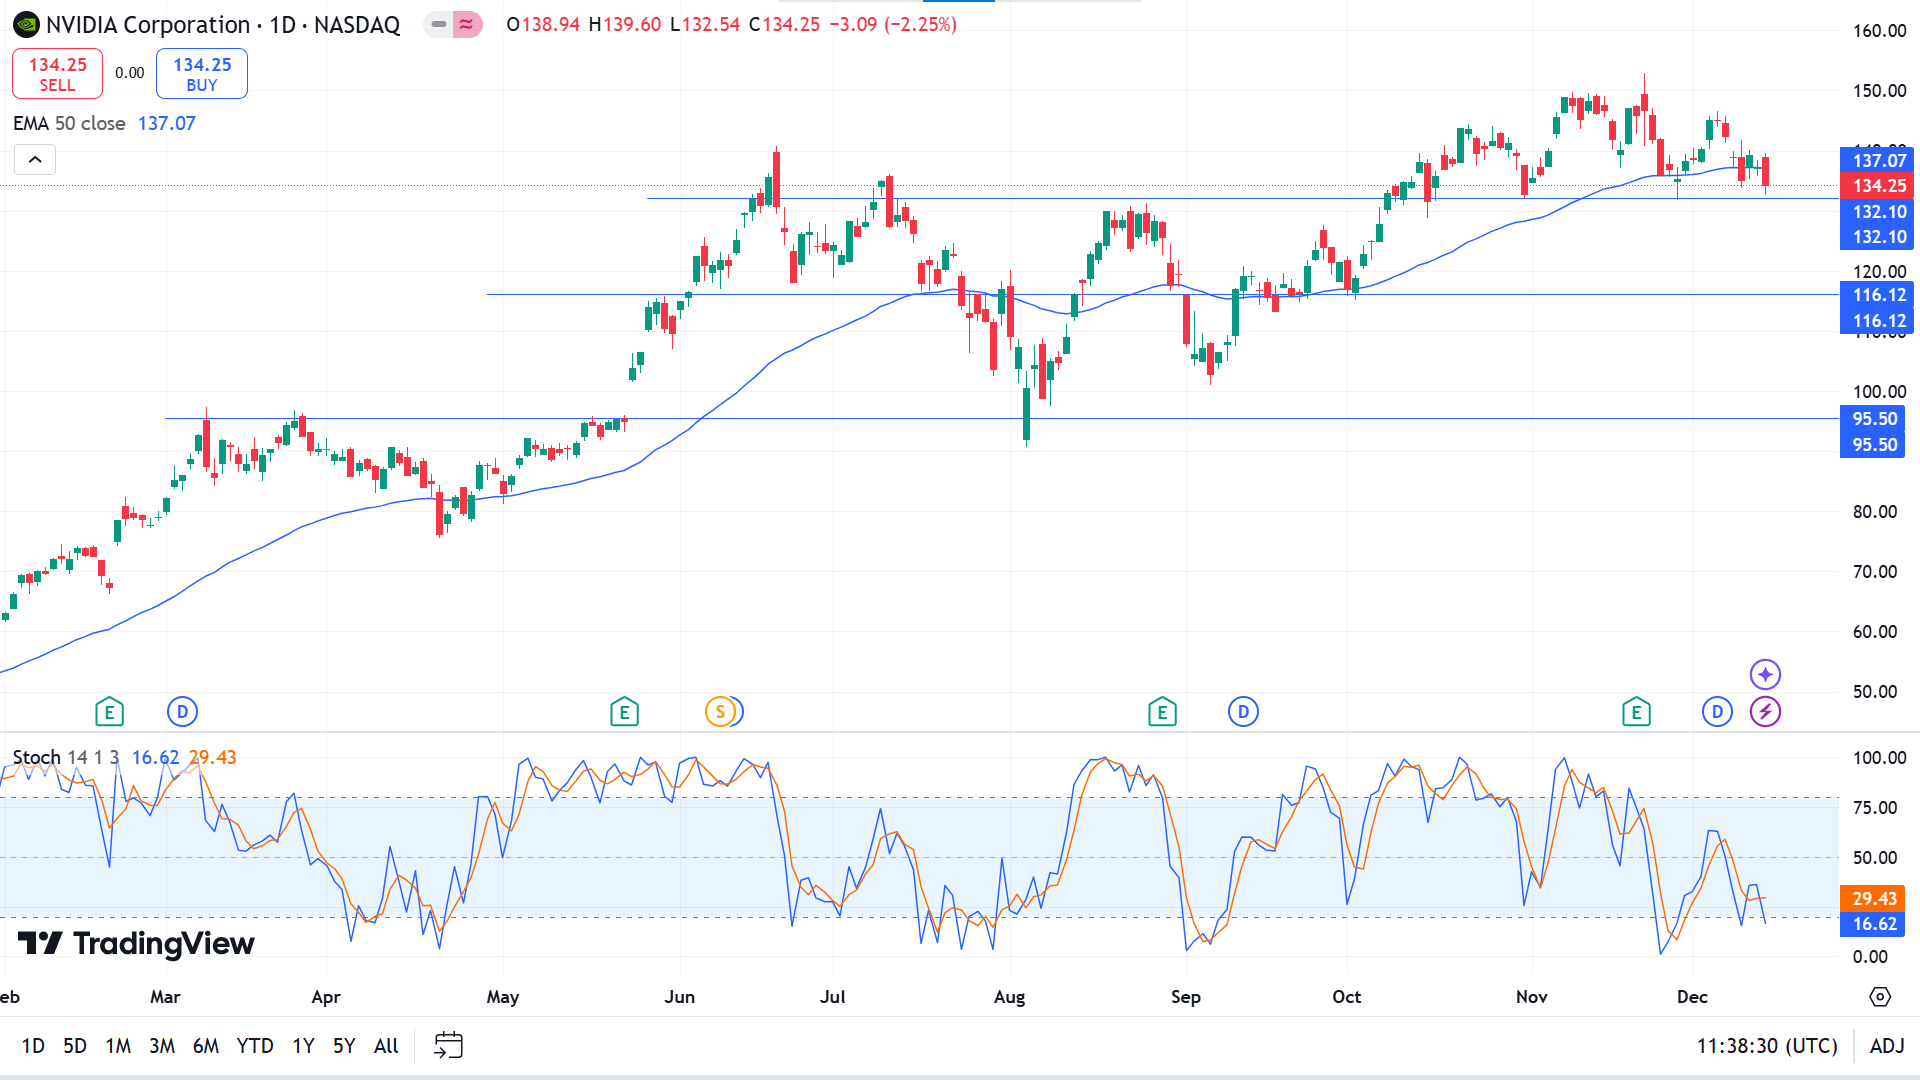
The price returns to an acceptable support level near 132.10 on the daily chart and reaches below the EMA 50 line, declaring bearish pressure on the asset price. At the same time, the Stochastic indicator window confirms the bearish pressure through dynamic signal lines floating near the lower level of the indicator window edging downward.
According to the price action concepts, buyers are still optimistic as the support level is sustained, which can turn the price toward resistance near 152.01 or beyond.
However, if the support of 132.10 fails and the price dives below that level, buyers should reconsider their positions; besides, it might spark short-term selling opportunities toward 116.12 before bouncing back upside.
WTI Crude Oil (USOUSD)
Fundamental Perspective
Crude oil is edging back above $70.00, with markets remaining cautious despite earlier this week's rally. The OPEC+ report provided some upward momentum for oil prices, but concerns linger over 2025 projections as President-elect Donald Trump prepares to take office. His administration’s plans to significantly expand US oil production and exports could intensify the already oversupplied global market.
Meanwhile, the US Dollar Index (DXY), which measures the USD against a basket of currencies, is holding its recent gains ahead of the Federal Reserve’s meeting. The strengthening of the Greenback is fueled by a widening interest rate gap between the US, China, and Europe, drawing investor inflows.
In the oil market, Abu Dhabi National Oil Company (Adnoc) has reportedly reduced crude allocations to some Asian buyers, according to Bloomberg. However, analysts warn weak fundamentals could weigh on oil prices in 2025, with a potential supply glut overshadowing the effects of geopolitical tensions, sanctions, and OPEC+ production cuts.
Typically, US crude exports rise in December as suppliers work to minimize tax burdens, but seasonally low Gulf Coast inventories may disrupt this pattern, Reuters reports. As the year-end approaches, these dynamics highlight the challenges ahead for crude markets.
Technical Perspective
The last solid green candle on the weekly chart confirms that buyers are active on the asset price, reaching the range top near 72.09, as the price has been moving sideways since October. Investors may observe the price movement at this level as it might determine the trend.
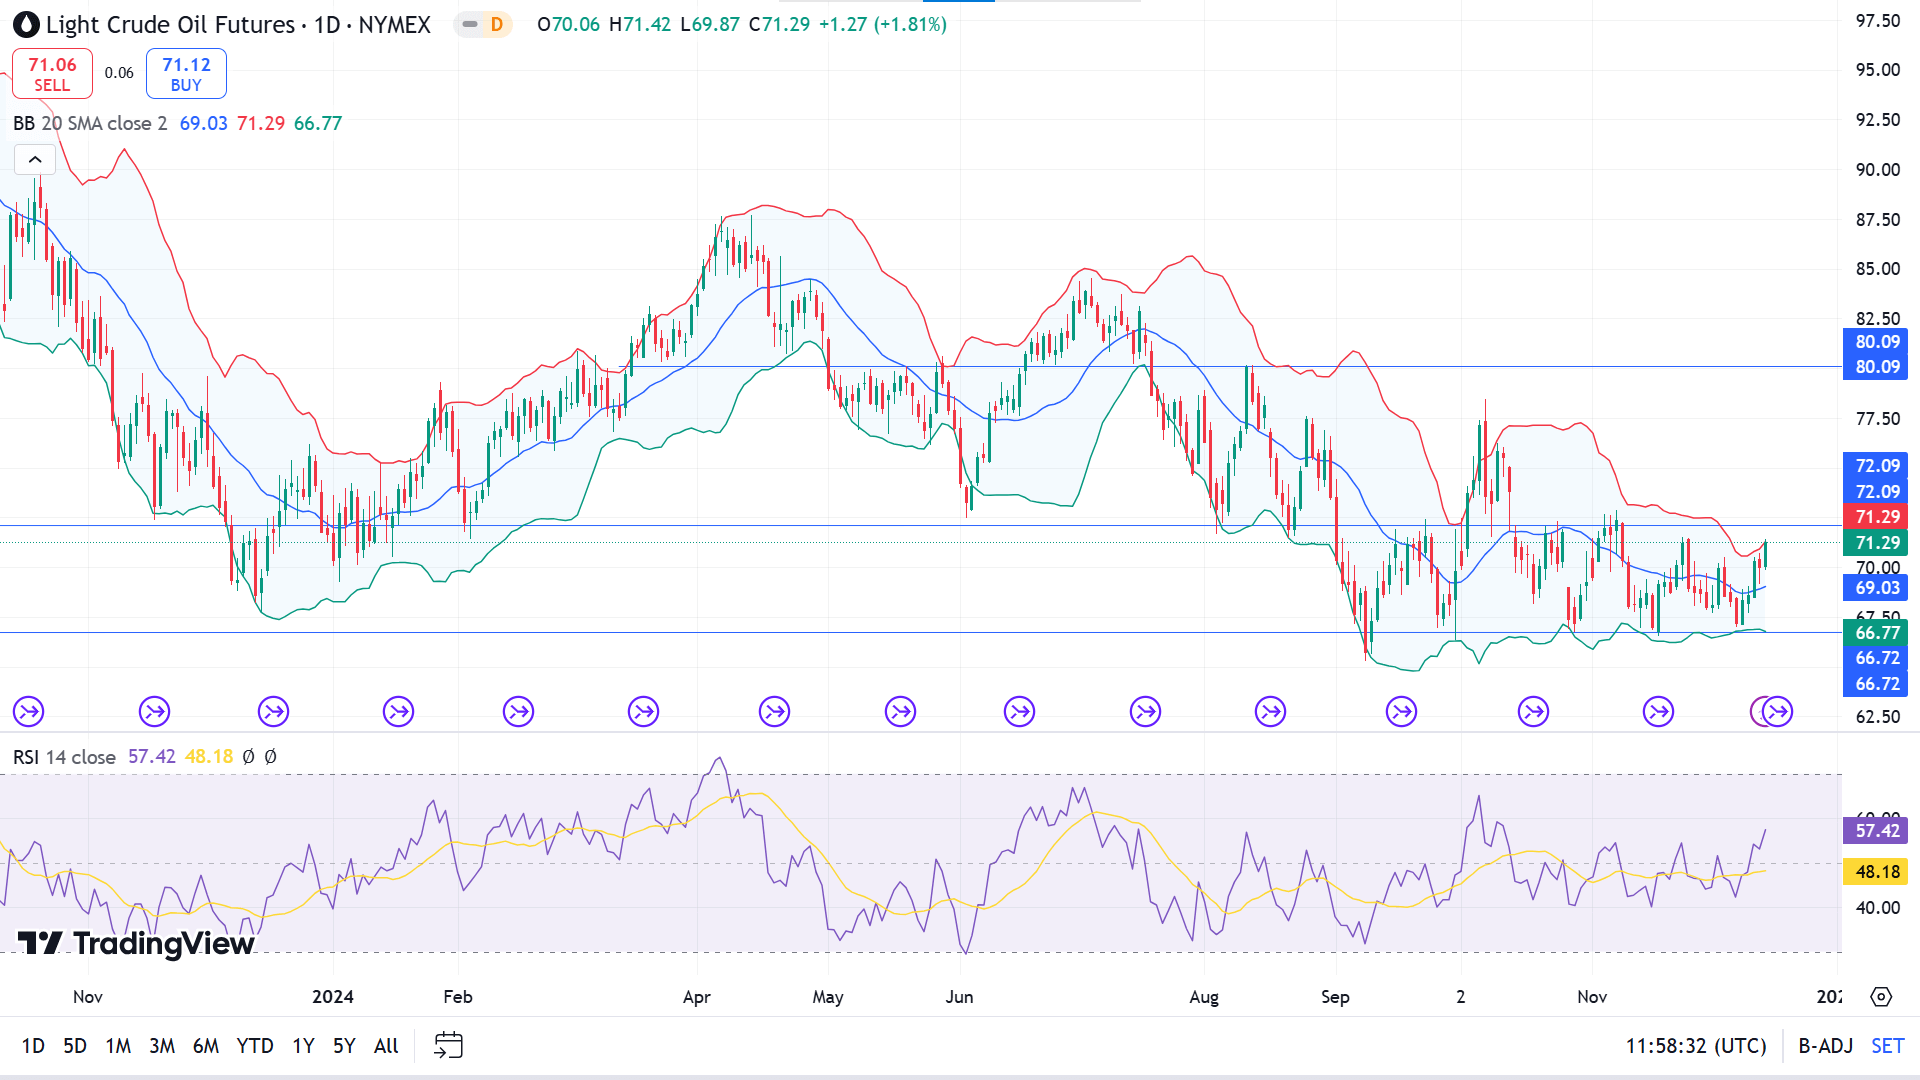
The price bounces back to the top of the range at the daily chart, creating consecutive bullish candles and moving along the upper band of the Bollinger band indicator. In contrast, the RSI dynamic line moves upward, edging upside, supporting bullish pressure on the asset.
This week, sellers would observe price reactions near the 72.09 level, which might enable selling opportunity toward the range low near 66.72.
Meanwhile, the sell signal would be invalid if a daily green candle closes above the 72.09 level, which might disappoint sellers and make buyers optimistic toward the primary resistance near 77.34.


