
EURUSD
Fundamental Perspective
Despite Powell's hawkish words, the dollar struggled to gain momentum. Additionally, the euro is set to end the week with a 0.60% loss, despite having gained over 2% since mid-November.
Chairman Powell acknowledged a decline in inflation, highlighting that core inflation remains high. He stressed the importance of gathering more evidence to assess progress toward the 2% inflation target. Powell noted that interest rates are acting as a constraint but cautioned against prematurely declaring that monetary policy has become sufficiently restrictive. He emphasized that decisions in this regard would continue to be based on incoming data.
Turning to economic indicators, the Institute for Supply Management (ISM) Manufacturing PMI for November came in at 46.7, matching the previous figure but falling short of the expected 47.6. Looking ahead, investors will closely monitor the upcoming release of the monthly Nonfarm Payrolls report from the US next week.
Technical Perspective
Source: TradingView
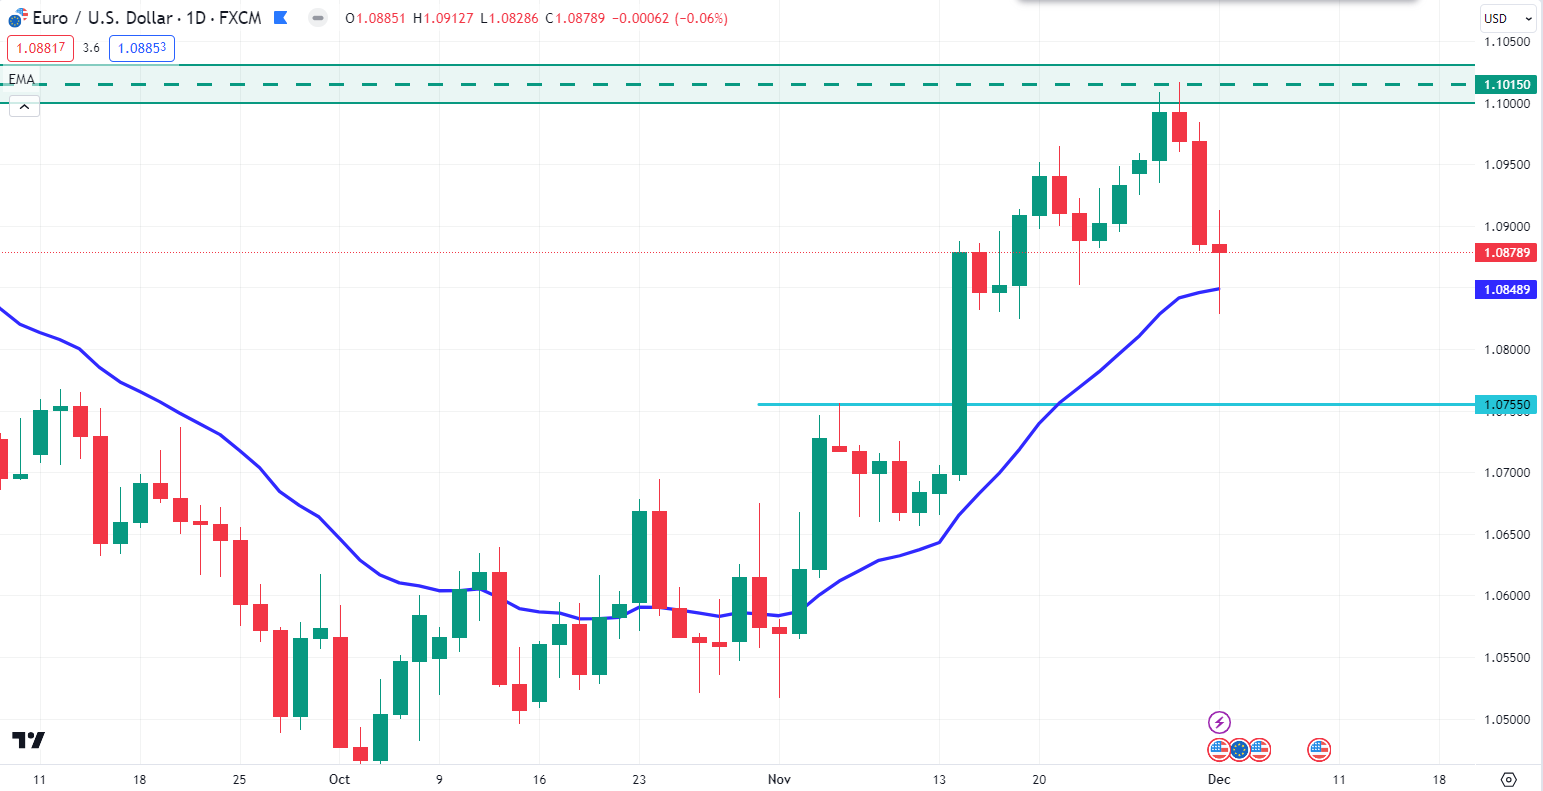
In the weekly chart, EURUSD hit the psychological resistance level of 1.1015 price area last week from where a selling pressure indicated a possible downside continuation opportunity.
In the daily timeframe, EURUSD had a strong daily bearish candle on Friday but found support on the dynamic 20 EMA. Therefore, a short-term bullish opportunity is potent in this pair, but investors should monitor how the price reacts from the dynamic support.
On the bearish side, the weekly candle seems positive, which indicates a downside extension toward the 1.0755 price area in the coming days.
GBPJPY
Fundamental Perspective
Despite the Bank of England's (BoE) Governors emphasizing their commitment to maintaining higher rates for an extended period, the Japanese Yen's strength is putting pressure on the Pound Sterling (GBP).
Currently, as of the latest update, the pair is trading at 186.56, reflecting a 0.24% decline.
Technical Perspective
Source: TradingView
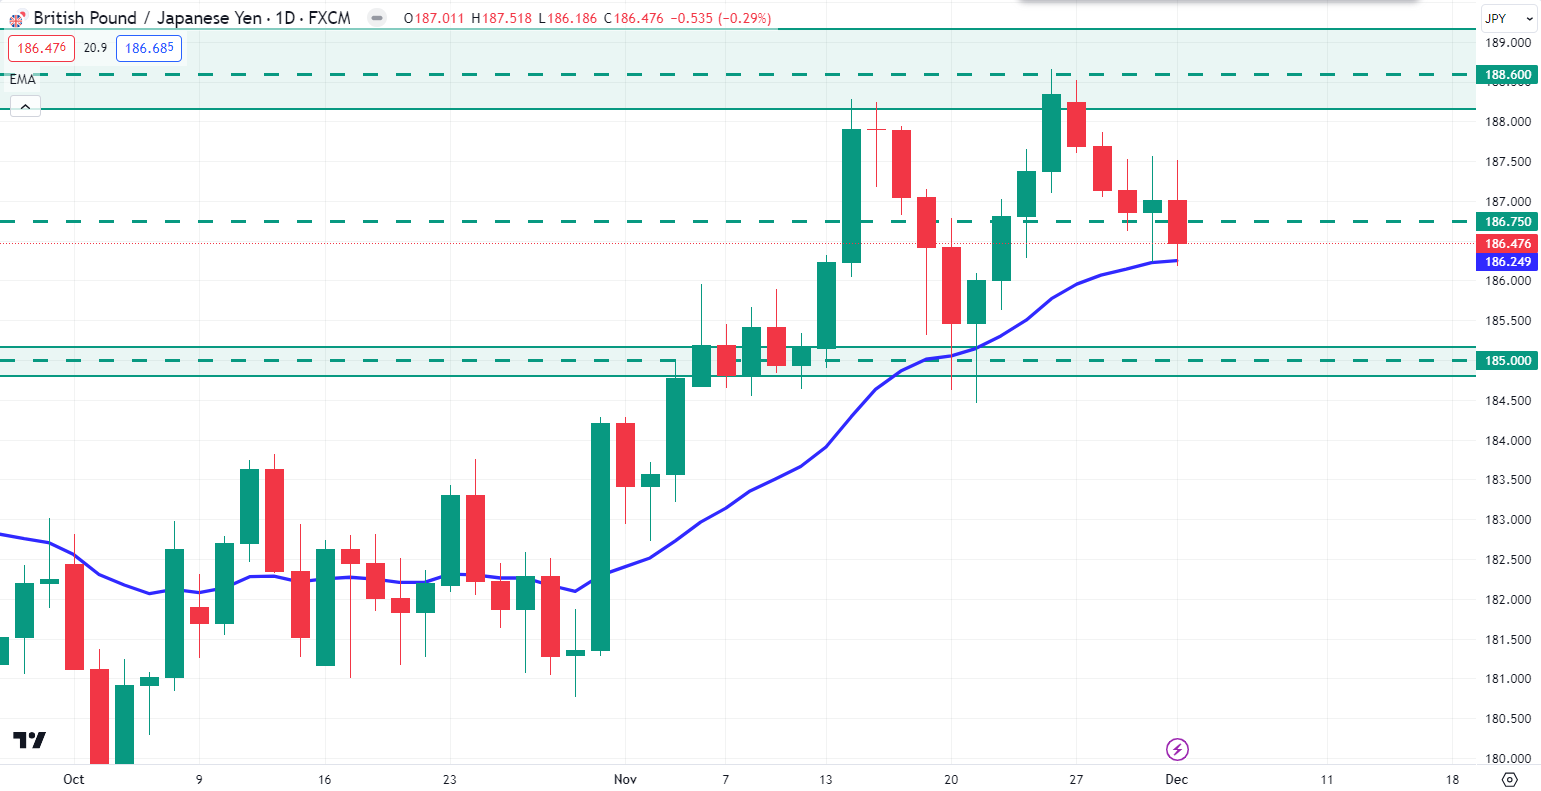
In the weekly chart, GBPJPY price had a bearish candle close after hitting the key resistance level of 188.60 area. Earlier, GBPJPY broke above the 186.75 resistance level area with a strong weekly bullish candle but failed to sustain the bullish.
In the daily chart, the dynamic level of 20 EMA still holds the price as strong support, indicating a bullish recovery toward the 189.00 price area in the coming days.
On the bearish side, the strong daily bearish candle close below the 186.75 psychological event level indicates a bearish continuation toward the 185.00 price area.
Nasdaq 100 (NAS100)
Fundamental Perspective
As we step into the week of December 4th to 8th, 2023, the NASDAQ 100 (NAS100) finds itself at the crossroads of tech-driven energy and market forces. Recent data shows the technology sector holding strong, with major players reporting solid earnings.
However, there are concerns about inflation and possible interest rate hikes, introducing a note of caution. It's a good idea for investors to keep a close eye on important indicators, especially in the areas of technology and macroeconomics.
Technical Perspective
Source: TradingView
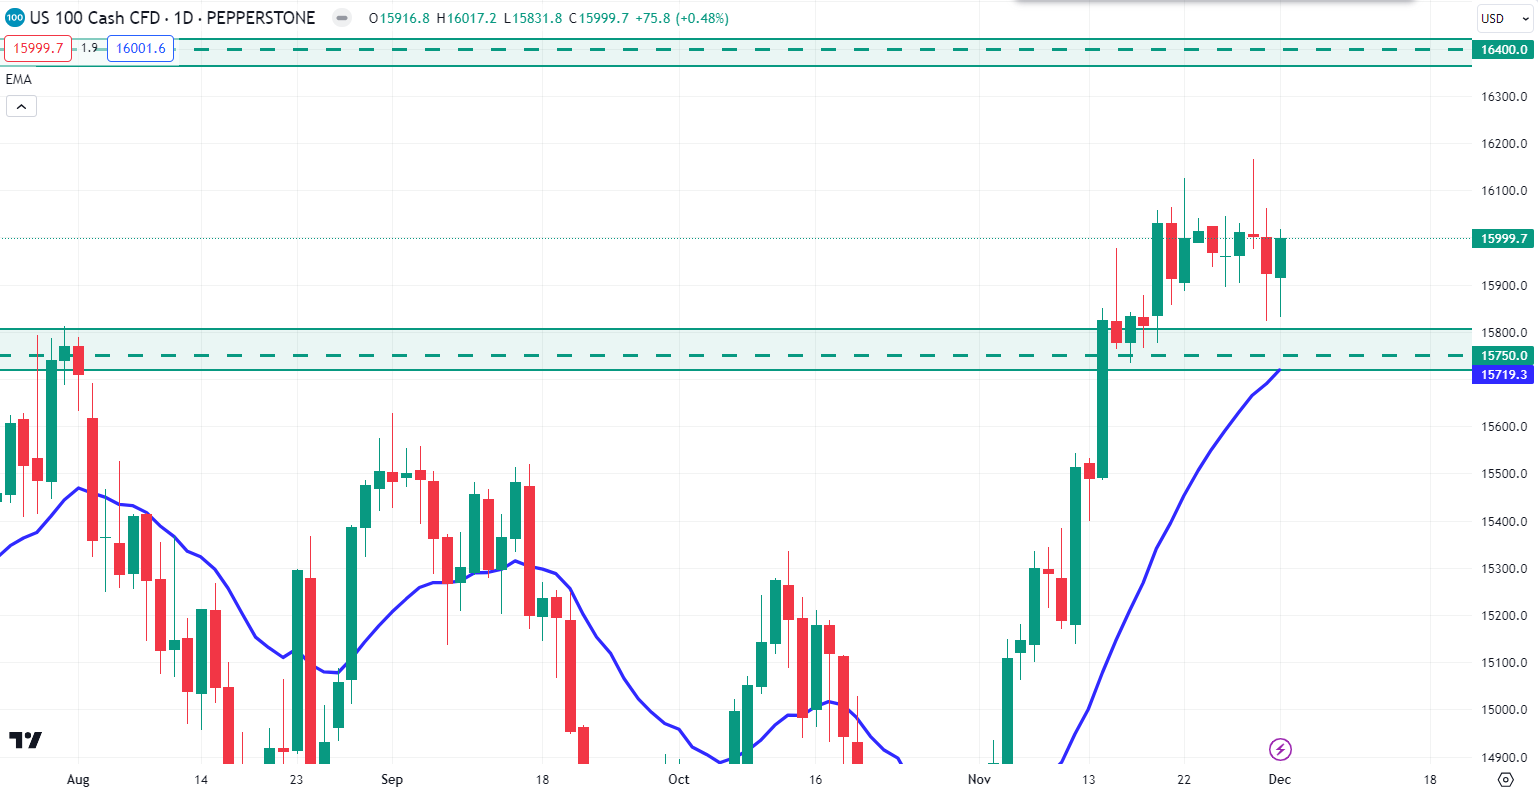
In the weekly chart, NAS100 bulls still hold bullish momentum above the $15750.0 price area. Moreover, the latest weekly candle indicates a bullish continuation opportunity as the weekly close recovered some early losses.
NAS100 had a strong daily bullish candle close last Friday, indicating that the bull may sustain the pressure toward the $16400.0 key area.
On the bearish side, the NAS100 price might retrace to the $15750.0 support level but breaking below this level with a D1 close could indicate a trend reversal.
S&P 500 (SPX500)
Fundamental Perspective
In the upcoming week, from December 4th to 8th, 2023, the S&P 500 index expects a lively mix of market forces. Recent economic data points to a steady recovery, boosted by positive corporate earnings that are adding to the optimistic vibe. Investors need to keep a close eye on key indicators like employment figures and inflation rates, as they can influence how the market moves.
Even though geopolitical events and central bank policies can make things a bit unpredictable, the overall direction seems sturdy.
Technical Perspective
Source: TradingView
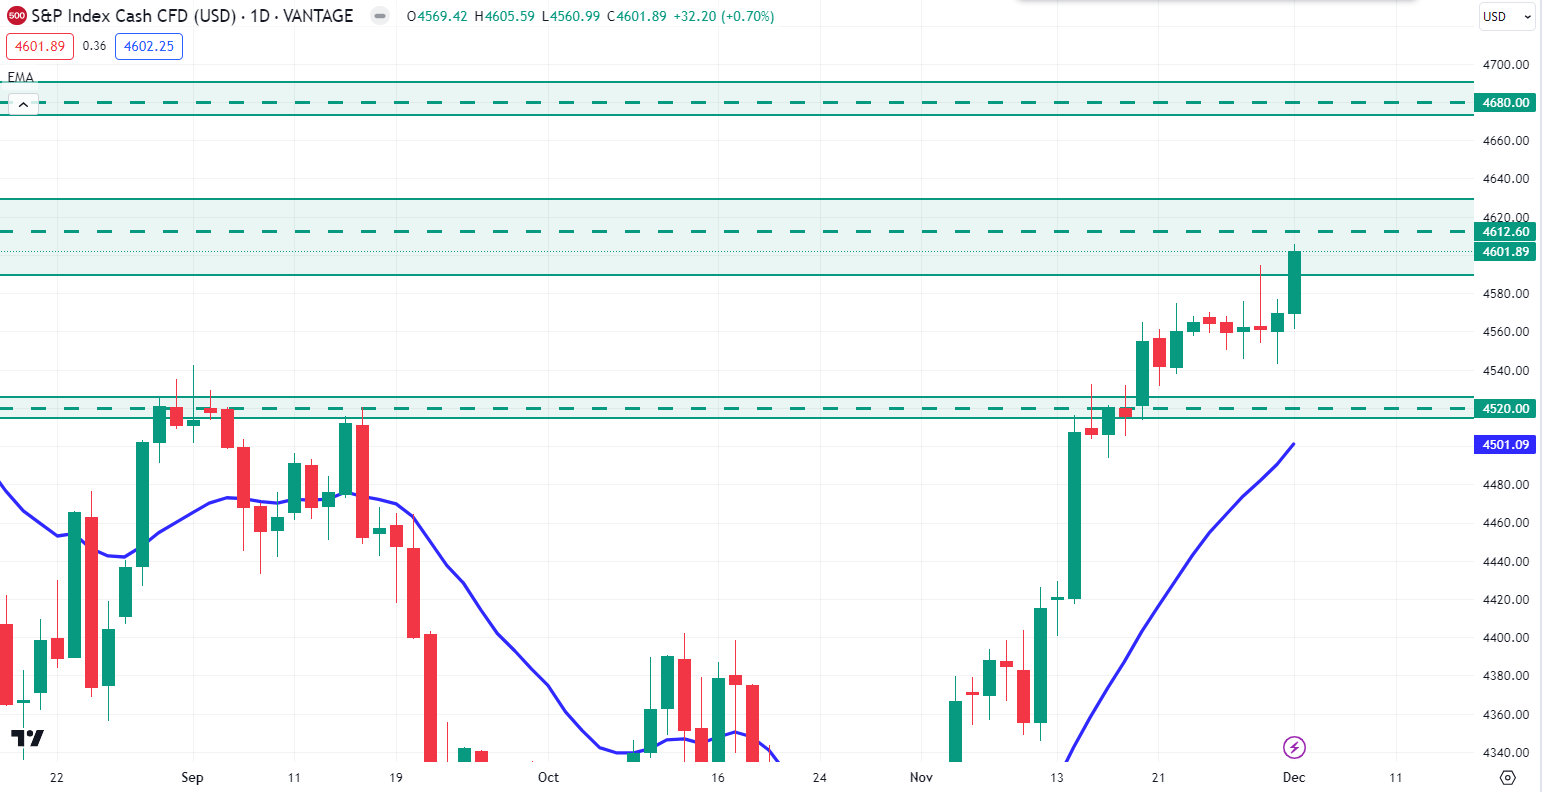
On the weekly timeframe, the S&P 500 price resides near the weekly key resistance level of the $4612.60 price area. After breaking above the dynamic level of 20 EMA, bulls impulsively pushed the price higher, which may work as a strong trend continuation opportunity.
A bullish break above the $4612.60 psychological level in the daily chart could sustain the momentum toward the $4680.00 price area.
However, on the bearish side, the S&P 500 price should retrace down toward the $4520.0 price area before continuing the bullish momentum in the coming days.
Hang Seng Index (HK50)
Fundamental Perspective
As we approach December 4th to 8th, 2023, the Hang Seng Index (HK50) is presenting a detailed picture. Recent market data suggests a careful sense of optimism influenced by changes in global politics and economic indicators. Sectors like technology and finance might feel the impact of new regulations, adding a bit of uncertainty. It's a good idea for investors to keep a close eye on how things unfold in Sino-U.S. relations, as any policy changes could affect the HK50.
Technical Perspective
Source: TradingView
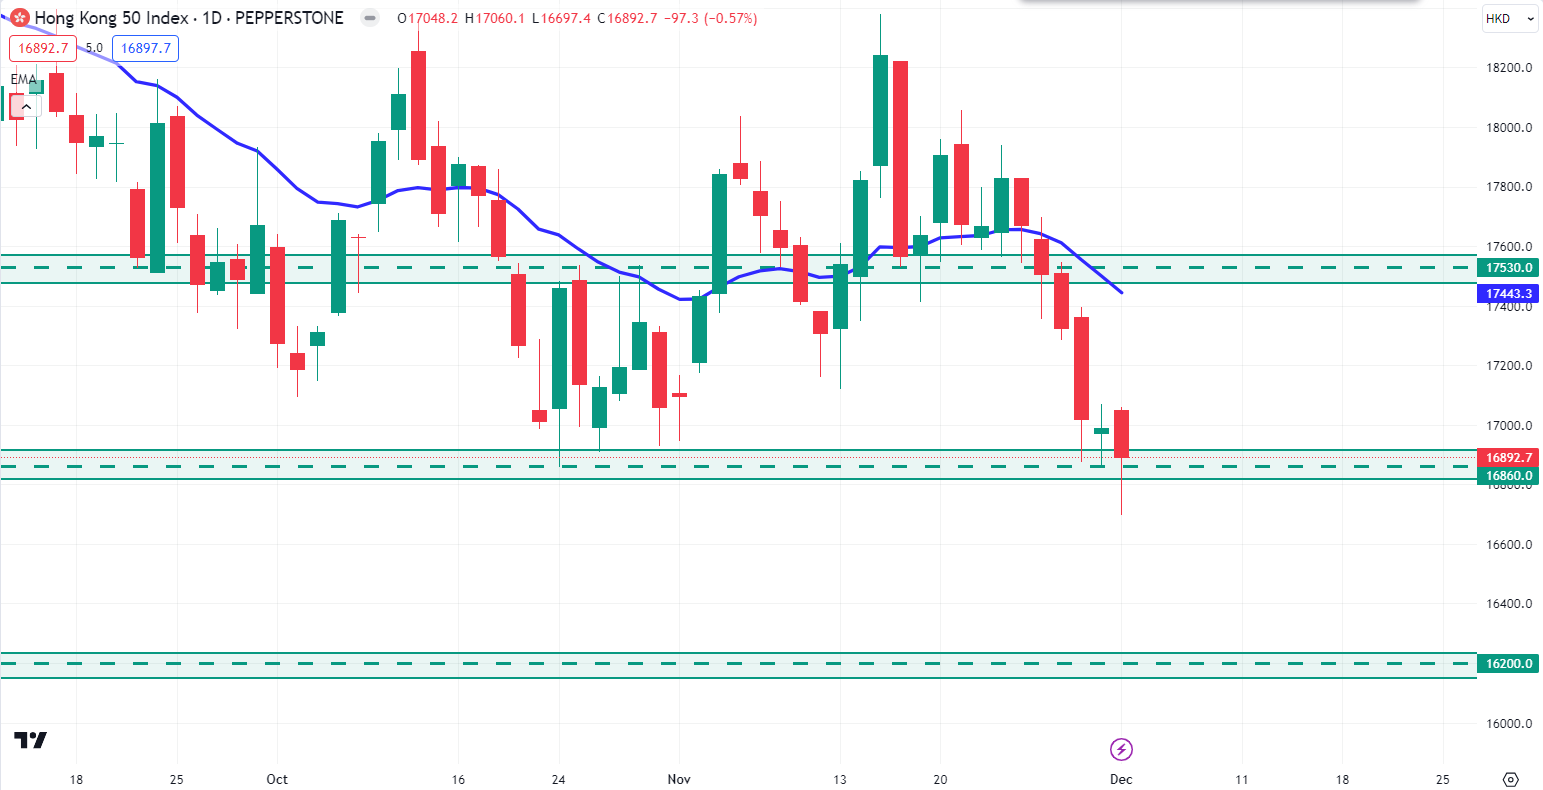
In the weekly chart, the HK50 price broke below the $17530.0 support level and hit the $16860.0 event area. However, the price failed to continue below the $16860.0 price area and had a weekly close above it.
In the daily timeframe, a new low below the October low suggests a bearish continuation opportunity, which may lower the price toward the $16200.0 price area in the coming days.
On the bullish side, a V-shape recovery from the $16860.0 support level will indicate a sell-side liquidity sweep, which may push the price higher toward the $17530.0 price area.
Bitcoin (BTCUSD)
Fundamental Perspective
Between December 4th and 8th, 2023, Bitcoin (BTC) is set for an interesting path driven by several factors. Recent data shows that more institutions are getting into Bitcoin, and regulatory changes indicate a growing acceptance of the cryptocurrency. Market people generally feel positive, and important technical signs suggest the possibility of Bitcoin going up.
Still, investors must stay alert because big-picture economic uncertainties and global events could make things a bit unpredictable. The ongoing use of blockchain technology in different areas is expected to stabilize BTC.
Technical Perspective
Source: TradingView
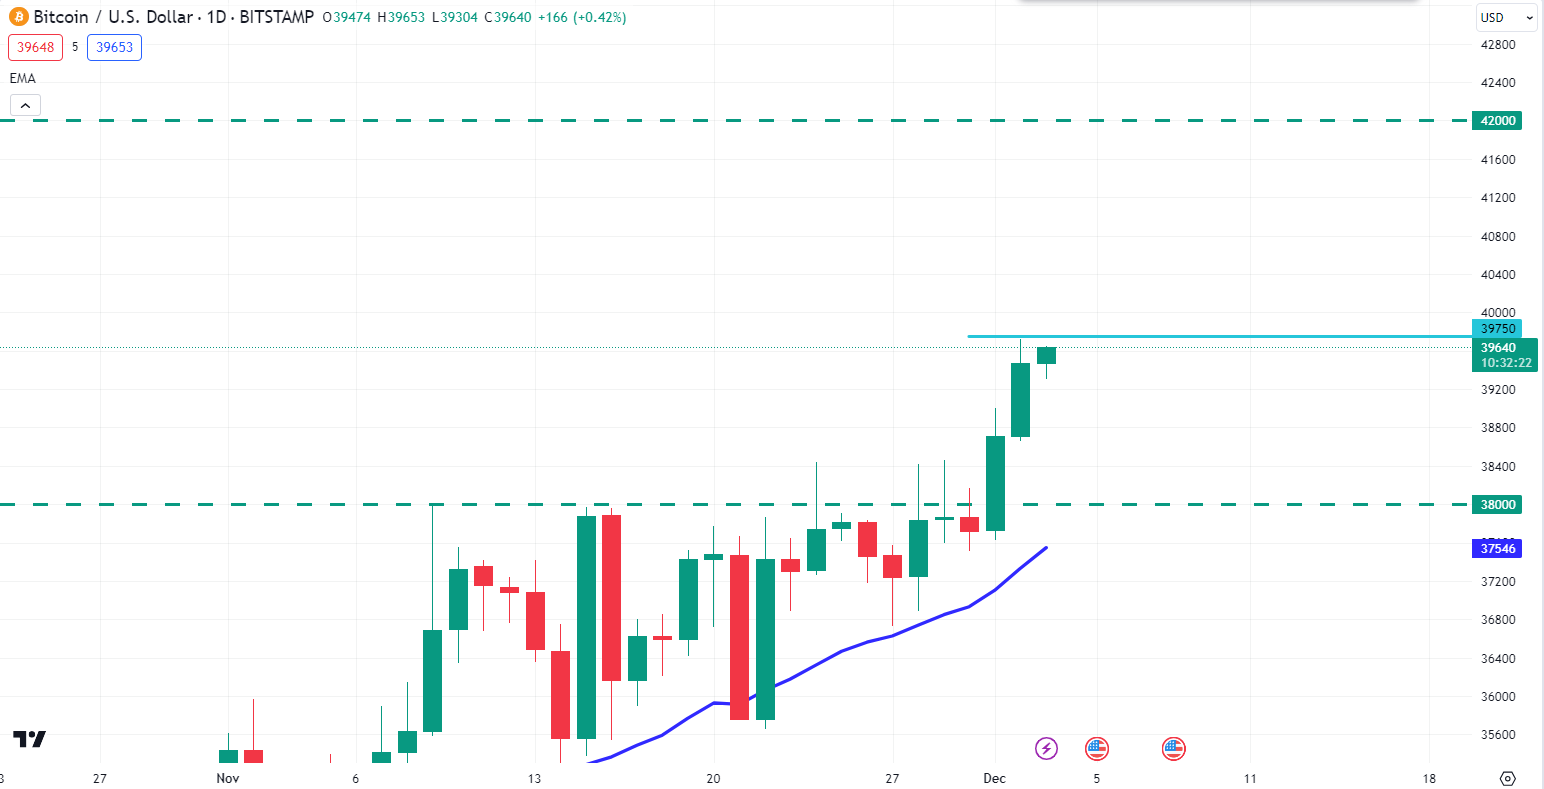
In the weekly chart, a sideways market within an existing bullish trend opened a strong upward possibility after having a strong bullish close.
In the daily chart, if the price can break above the $39750 price area with a bullish candle close, bulls may sustain pressure above the $42000 price area in the coming days.
On the bearish side, if the price rejects the $39750 price area with an impulsive bearish candle close, the price may retrace the downside toward the $38000 price area.
Ethereum (ETHUSD)
Fundamental Perspective
Based on recent market trends, Ethereum (ETH) is poised for a bullish trajectory in the upcoming week, from December 4th to December 8th, 2023. With growing institutional interest and increased adoption of decentralized finance (DeFi) applications, ETH is expected to experience a surge in value.
Vitalik Buterin's innovative upgrades, including Ethereum 2.0, enhance scalability and sustainability, fostering investor confidence. Technical indicators suggest a positive momentum, while the vibrant ecosystem continues to attract developers and users.
Keep a keen eye on ETH as it navigates the crypto landscape, potentially presenting lucrative opportunities during this forecasted period.
Technical Perspective
Source: TradingView
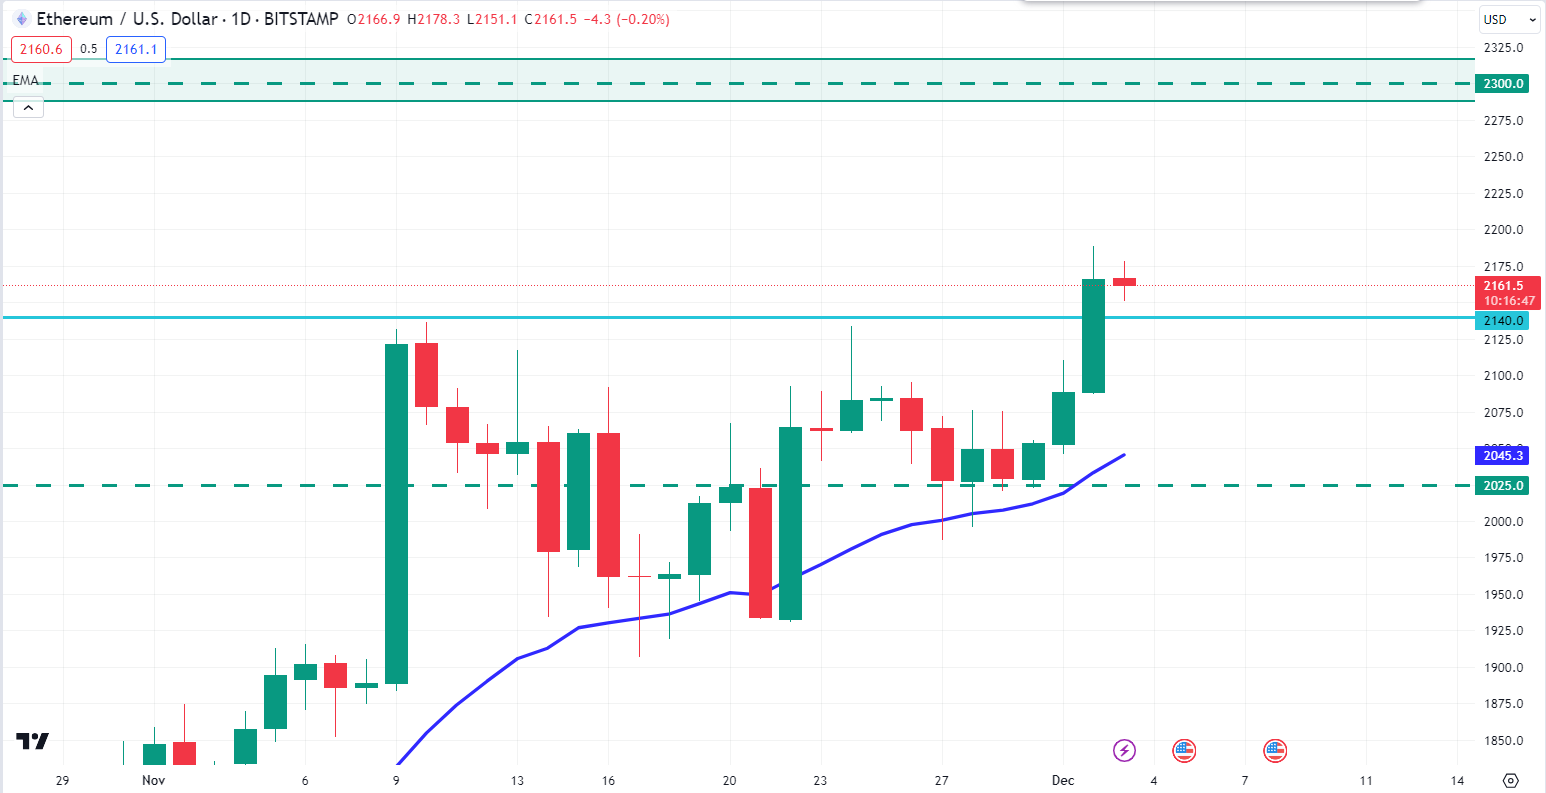
In the weekly chart, ETH price broke above the $2140.0 neckline area and is currently trading around the $2164.4 price area.
In the daily chart, ETH price may retrace down toward the $2140.0 price area before continuing the bullish momentum further toward the $2300 key resistance area in the coming days.
On the bearish side, if the price had a daily bearish candle close below the $2140.0 price area, the bears may regain momentum and push the price down to the $2025.0 price area in the days ahead.
Tesla Stock (TSLA)
Fundamental Perspective
At the Thursday unveiling of the Tesla Cybertruck, the standout news was that while the model distinguishes itself from other Detroit competitors, it might not significantly impact Tesla's profits. CEO Elon Musk openly acknowledged this, stating that achieving positive cash flow for the model would be challenging and require substantial volume. Only 10 units were delivered at the event.
Analysts echoed similar sentiments but expressed optimism about Tesla expanding its product range. Morgan Stanley's Adam Jonas sees the Cybertruck as Tesla's initial venture into manufacturing more mainstream trucks and SUVs in the latter part of the decade. Despite being announced in 2019, the Cybertruck is expected to remain a niche product.
Technical Perspective
Source: TradingView
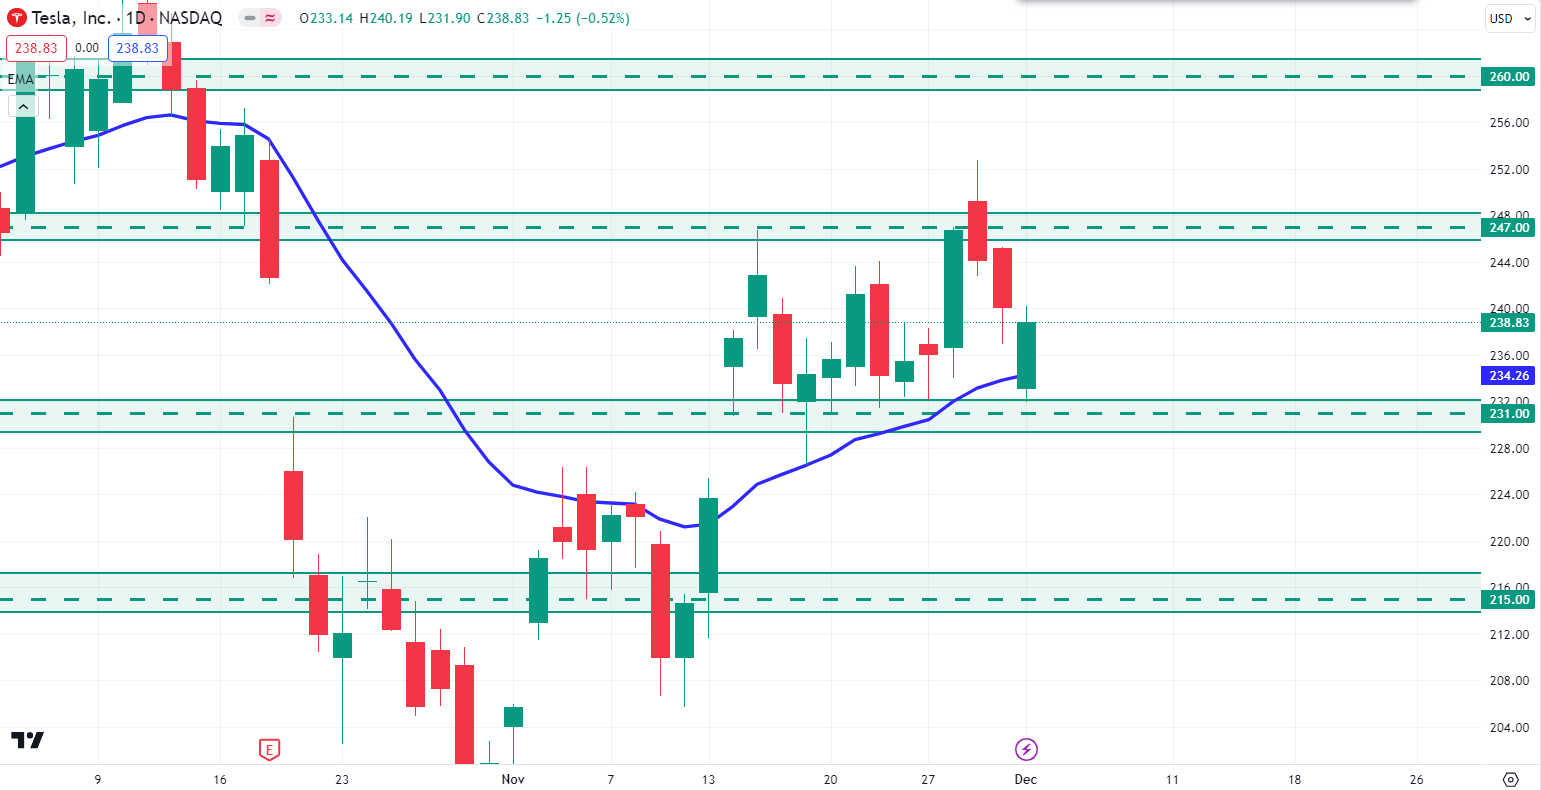
In the weekly chart, TSLA stock bulls failed to break above the $247.00 price area and had a weekly close below it. However, the dynamic level of 20 EMA is still holding the price as strong support.
In the daily chart, TSLA is still residing inside the range of $247.00 - $231.00 price area. However, last Friday, TSLA had an impulsive bullish candle close after bouncing from the $231.00 support level. So, if the price can break above the $247.00 resistance area with a daily bullish candle close, the bull may push the price higher toward the $260.00 price area in the coming days.
On the bearish side, if the price can break below the $231.00 support level with a daily bearish candle close, the bear may regain momentum and push the price down to the $215.00 price area.
GOLD (XAUUSD)
Fundamental Perspective
The trend of the 'bad news is good news' trade remains influential in the financial markets, where poorer economic data is seen as positive for risk assets. In simple terms, if the Federal Reserve changes its approach and stops quantitative tightening (QT), many investors believe that all their problems will vanish.
However, despite this storyline benefiting gold, a concerning economic situation could lead to significantly lower prices in the coming months.
Technical Perspective
Source: TradingView
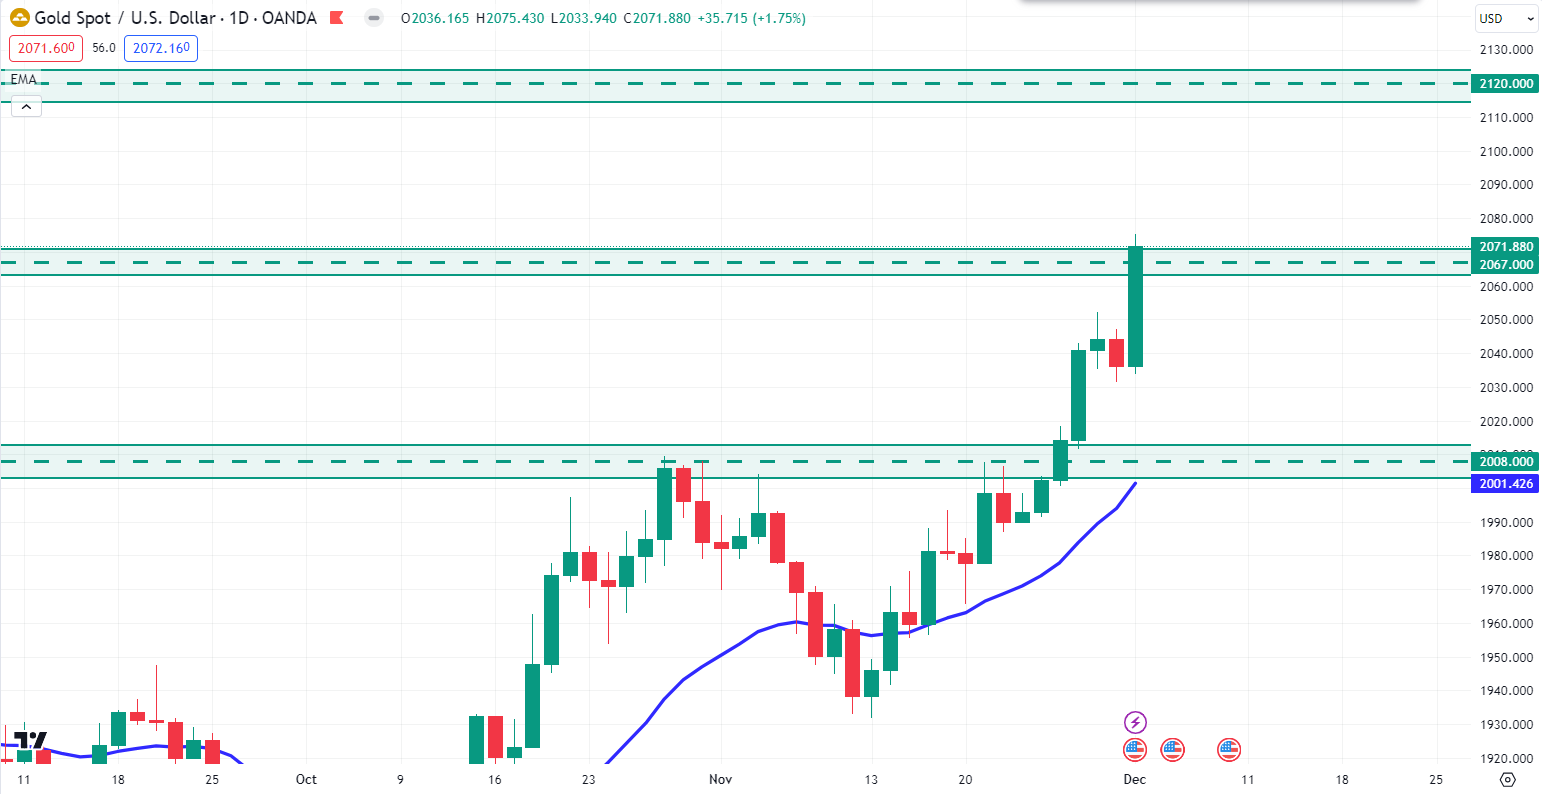
In the weekly chart, Gold price pushed higher after bouncing from the dynamic level of 20 EMA and had a weekly close above the $2067.00 key price area.
In the daily chart, if the price continues to increase further and has a daily bullish candle close above the $2067.00 price area on the upcoming Monday, the bull may sustain the bullish momentum toward the $2120.00 price area in the coming days.
On the bearish side, if the price pushed down and had a daily bearish candle close below the $2067.00 price area, the bears may regain momentum and push the price down to the $2008.00 price area in the days ahead.
Crude Oil (WTI)
Fundamental Perspective
West Texas Intermediate (WTI) Crude Oil had a fluctuating session in late-week trading on Friday, moving between $77.00 and $74.50 per barrel amidst volatile oil markets. Investors remain uncertain about the success of the Organization of the Petroleum Exporting Countries (OPEC) in implementing recently announced production cuts.
OPEC declared an additional one million barrels per day (bpd) reduction in Crude Oil pumping quotas. However, skepticism persists regarding OPEC's ability to enforce this unpopular production cap, with disagreements among member states over amounts, duration, and terms.
The lack of a concrete method for ensuring compliance with the voluntary cuts, expected until Q1 2024, raises concerns among fossil fuel investors. The modest one million bpd cut by OPEC may not offset the declining global demand for Crude Oil, potentially worsening supply overhangs in the coming months.
Technical Perspective
In the weekly chart, the Oil price broke below the $76.00 price area and had a weekly bearish pin bar close below it.
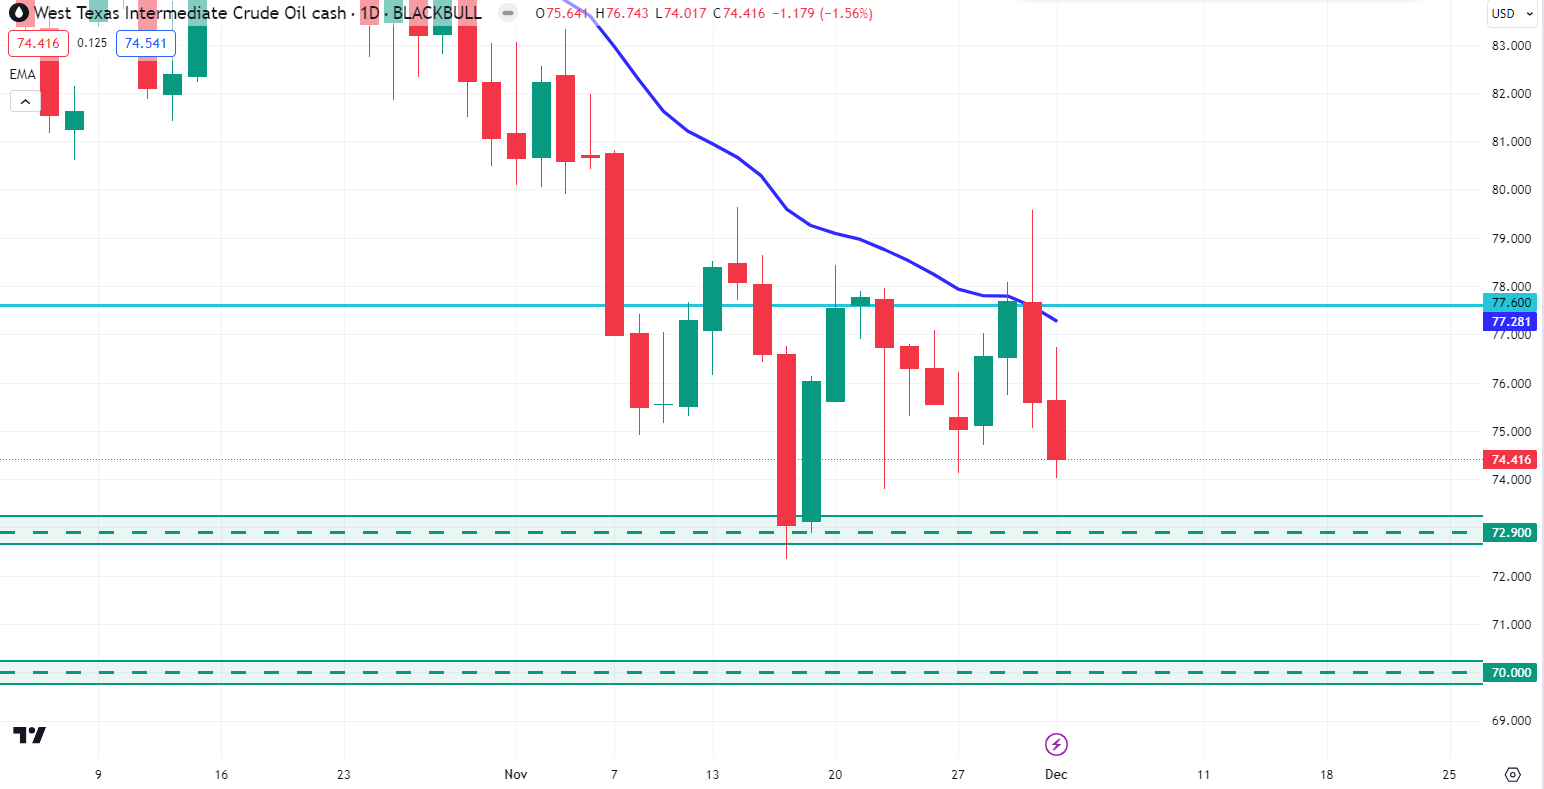
Source: TradingView
In the daily chart, the price may continue further down to the $72.90 support level. So, if the price bounces higher from the $72.90 support level and has a daily bullish candle close above it, the bull may regain momentum and push the price upward toward the $77.60 price area again in the coming days.
On the bearish side, if the price can break below the $72.90 support level with a daily bearish candle close, the bear may push the price down to the $70.00 price area in the days ahead.


