EURUSD
Fundamental Perspective
The EURUSD pair recovered from a three-week losing streak, approaching 1.0600 before meeting resistance, as the US Dollar retreated from its 2024 highs. After bottoming at 1.0332 on 22 November, the pair rebounded amid shifting sentiment driven by political and economic developments.
President-elect Donald Trump's nomination of Scott Bessent as Treasury Secretary hinted at a balanced economic strategy, as Bessent supported a gradual approach to tariffs. However, concerns resurfaced mid-week when Trump proposed imposing steep tariffs of 25% on Mexican and Canadian goods and up to 60% on Chinese imports, raising fears of inflationary pressures just as the Federal Reserve pivots toward easing monetary policy. Meanwhile, a temporary 60-day cease-fire between Israel and Hezbollah offered limited relief in geopolitical tensions.
In Europe, ECB board member Isabel Schnabel's hawkish tone offered short-term support for the Euro, as she emphasized a cautious rate-cutting approach amidst growth concerns linked to potential US trade actions. Inflation data showed modest easing, with Germany and the Eurozone reporting annual HICP increases below expectations. However, EU consumer confidence weakened further, highlighting lingering economic uncertainties.
The upcoming week will focus on critical US labor market data and PMI figures from both economies, which could shape the currency pair's trajectory amid ongoing geopolitical and inflationary pressures.
Technical Perspective
The EURUSD weekly chart shows a pause in the current downtrend after three consecutive losing candles; the last candle ended green, reflecting buyers' domination for the week.
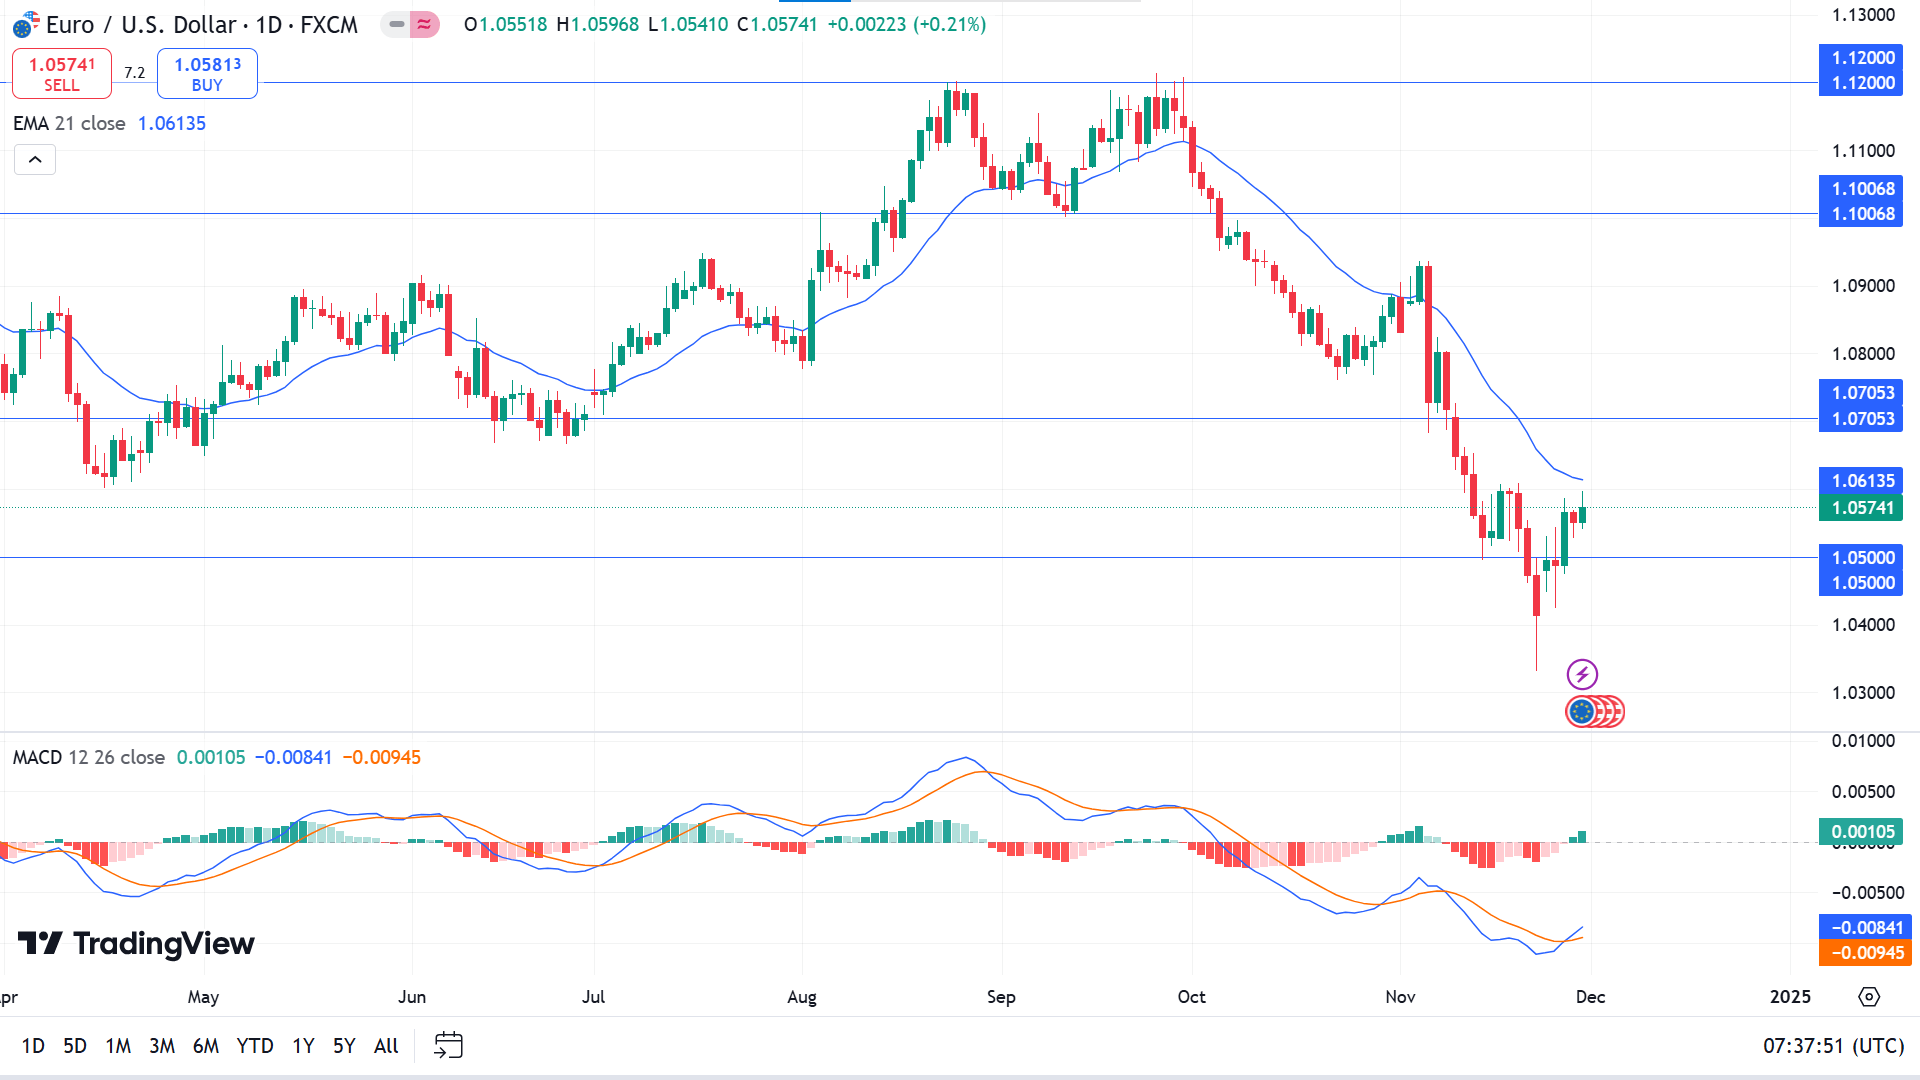
On the daily chart, the price pullbacks above the 1.05 mark after reaching the yearly low of 1.0331. The price is still in a downtrend as it floats below the EMA 21 line, whereas the MACD indicator window indicating fresh bullish pressure reflects mixed signals for investors.
Evaluating the current market context, the price returned above the 1.0500 level, easing bearish pressure. If the price remains above the 1.0500 level, short-term buyers may be optimistic toward the nearest resistance, 1.0705.
Meanwhile, the bullish signal would be invalid if the price declines below the 1.0500 level and keeps floating there; it can continue to the low of 1.0331 or further downside.
GBPJPY
Fundamental Perspective
The Japanese Yen (JPY) remained strong, keeping the GBPJPY pair below the 196.00 psychological mark, slightly above its September low. Consumer price data from Tokyo showed an uptick for the first time in three months, strengthening expectations for a potential Bank of Japan (BoJ) rate hike in December. Persistent geopolitical tensions and trade uncertainties further bolstered demand for the Yen.
Across the channel, the UK saw a quiet week regarding high-impact data, with the Bank of England (BoE) maintaining a cautious tone. Deputy Governor Clare Lombardelli emphasized the need for more explicit evidence of easing inflation before supporting additional rate cuts. This measured approach reflects the BoE's focus on balancing price stability and economic growth amid ongoing global uncertainties.
Technical Perspective
GBPJPY couldn't hit the previous peak and continues to lose for the fifth straight week. It ended below a prominent support sector selling opportunity as bulls lost control over the asset.
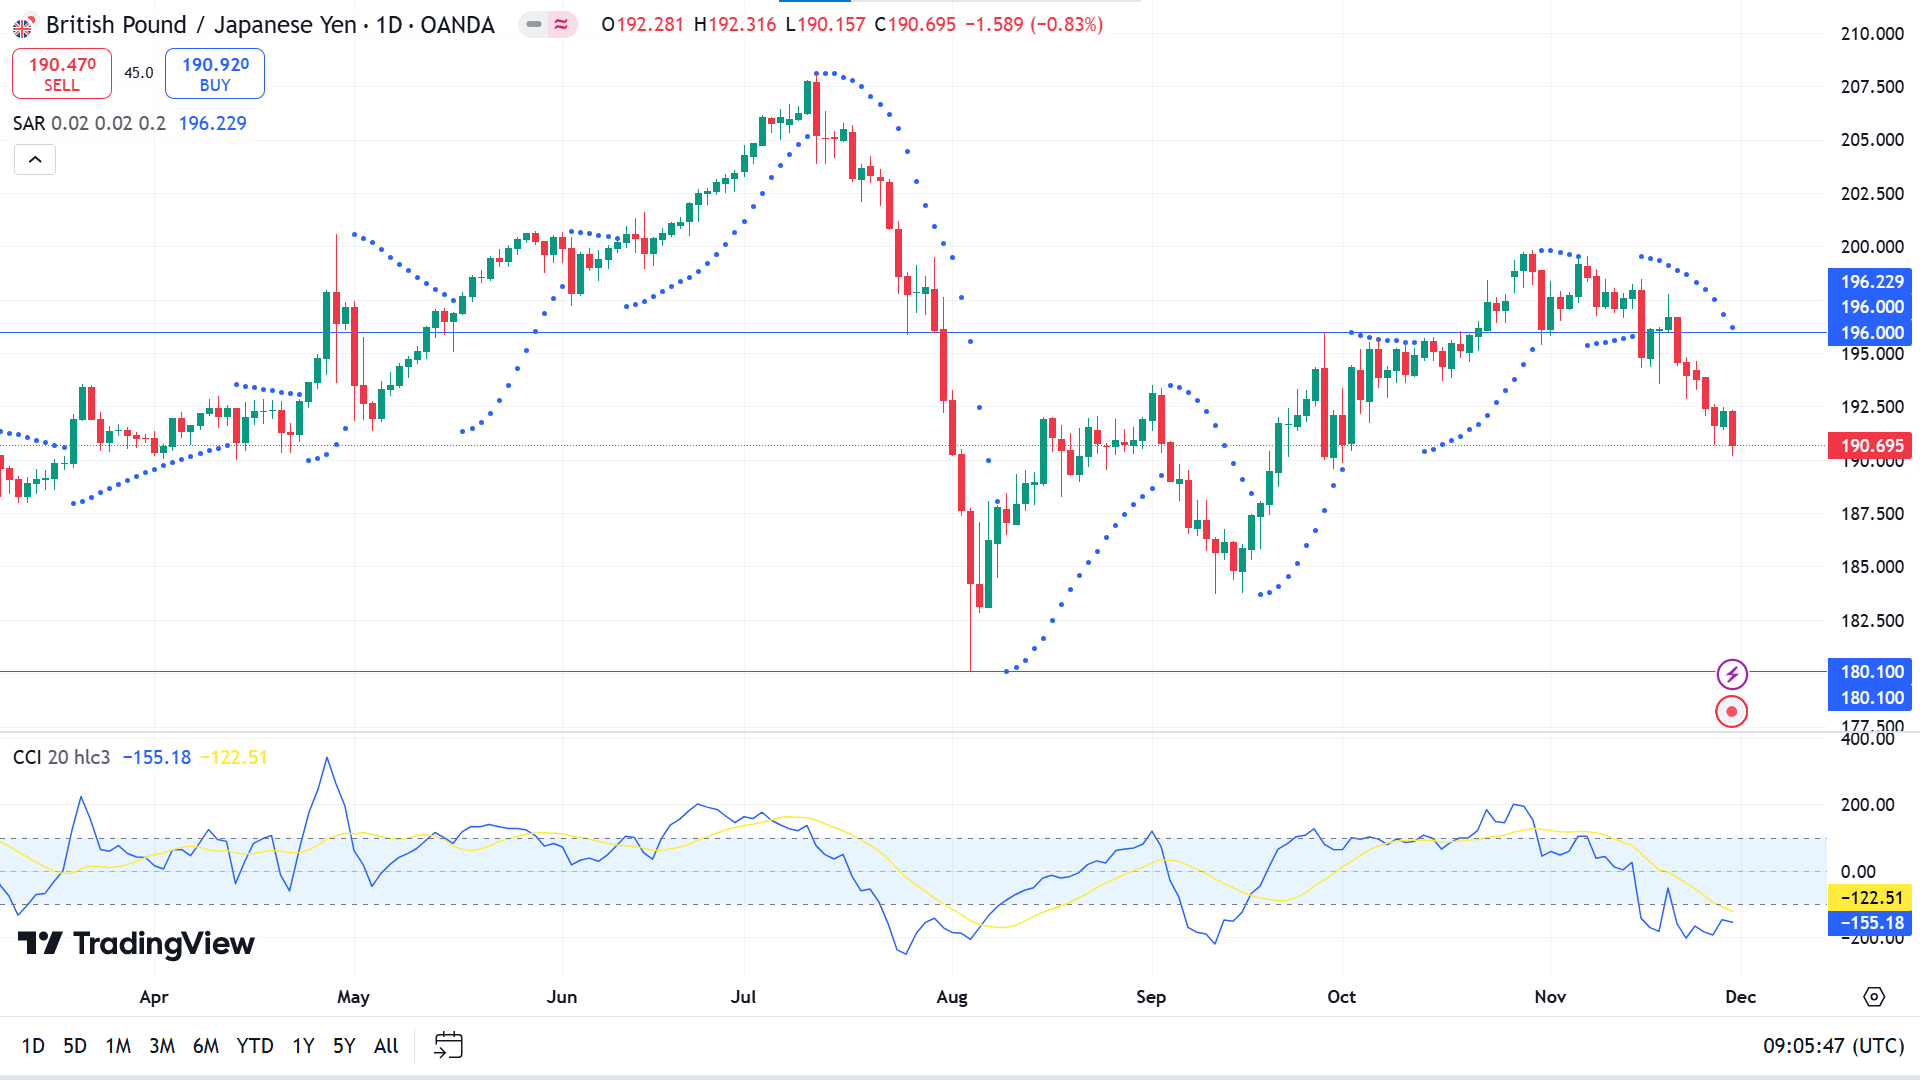
The price is in a downtrend as the parabolic SAR continues creating dots above the price candles when the CCI indicator line floats below the lower level of the indicator window. Combining these readings, seller domination is visible in the asset price.
According to the price action concept, the adequate sell level is near 196.00. In contrast, buyers may be looking at the 180.10 level primarily because this level worked as a barrier for sellers in August.
Meanwhile, the sellers might reconsider their positions if a green daily candle closes above the 196.00 level, as it could trigger buyers to drive the price toward the previous resistance of 208.12.
NASDAQ 100 (NAS100)
Fundamental Perspective
The Dow Jones Industrial Average and Nasdaq 100 extended the gain throughout the week, wrapping up a month defined by Donald Trump's presidential election victory. Consumer discretionary and technology sectors led the rally, while real estate and utilities were the only sectors to post losses.
Shares of Nano Nuclear Energy climbed 3.1% following the company's announcement of a $60 million private placement involving common shares and warrants. Meanwhile, in India, Amazon workers organized a Black Friday strike in New Delhi, with around 200 employees demanding higher wages and better working conditions. Despite the labor action, Amazon India reported no disruptions to operations, reaffirming its adherence to fair and competitive wage practices. Amazon shares rose 1.1% during the session.
In the bond market, yields declined, with the 10-year Treasury falling 4.5 basis points to 4.20% and the two-year yield slipping 4.1 basis points to 4.17%. The bond market's early closure at 2 p.m. ET revealed a session reflecting investor optimism amid subdued holiday trading.
Technical Perspective
The price remained above the previous peak of 20,649.74. It ended the last weekly candle as a doji after a green candle, indicating a bullish continuation or a pause in the current uptrend.
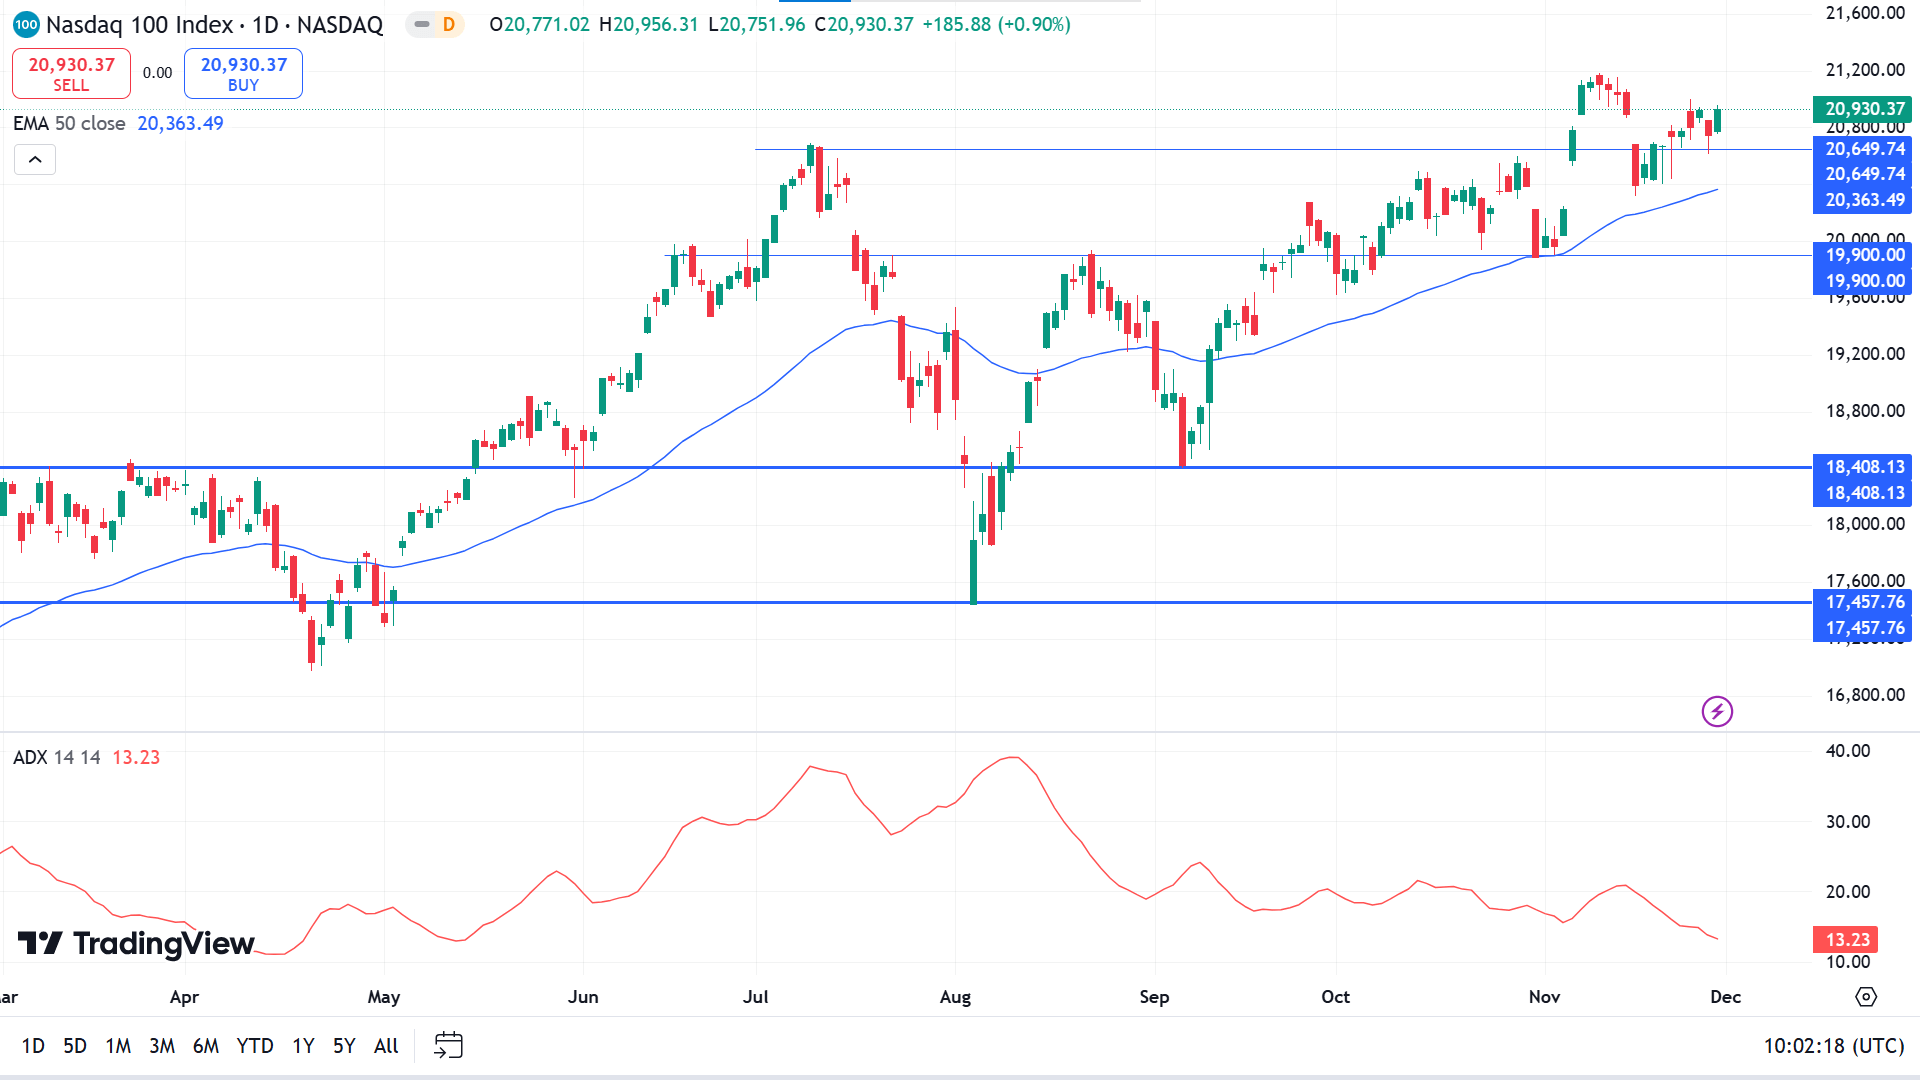
On the daily chart, the price is moving above the EMA 50 line, declaring bullish pressure on the asset. Meanwhile, the ADX dynamic line slopes downward, with the value declining near 13.23, indicating weakness of the current bullish trend.
Price action traders may seek to open decent long positions near 20,649.74, which can trigger the price toward the ATH or beyond, depending on the participant's actions.
On the other hand, buyers might be disappointed if the price declines below 20,649.74 with a red candle, which may trigger short-term sellers toward the support near 19,900.00.
S&P 500 (SPX500)
Fundamental Perspective
The S&P 500 rose 1.1% during this holiday-shortened week, ending November with a 5.7% monthly gain, which is the largest this year. The index closed Friday at a record 6,032.38, hitting an intraday high of 6,044.17 after Thursday's Thanksgiving break. With a 26% year-to-date increase, the S&P 500 is poised for a solid finish to 2024.
Economic reports showed the US economy expanded at a 2.8% annualised rate in Q3, aligning with estimates. However, consumer spending growth was revised slightly lower to 3.5% from 3.7%, tempering optimism.
Most sectors climbed, with consumer discretionary leading at a 2.3% gain. Ulta Beauty shares surged 14% as the company readied its Q3 earnings release, buoyed by Citigroup's price target raised to $390 from $345. Health care added 2.1%, driven by Eli Lilly's 6.3% rise following UK approval for its Alzheimer's diagnostic Tauvid. Real estate gained 2%, with Equinix shares up 4.8% after issuing €1.15 billion in green bonds, prompting Truist to lift its price target to $1,090.
Energy was the lone laggard, down 2%, as oil prices fell on easing Middle East tensions. Diamondback Energy and Devon Energy declined 4.2% and 3.8%, respectively. Markets now turn to employment data and manufacturing reports next week.
Technical Perspective
The extreme bullish pressure pushed the price at ATH in the weekly chart, confirming that the buoyant force on the asset price remains intact, as in the previous one. Consecutive gaining weeks keeps buyers optimistic for the upcoming weeks.
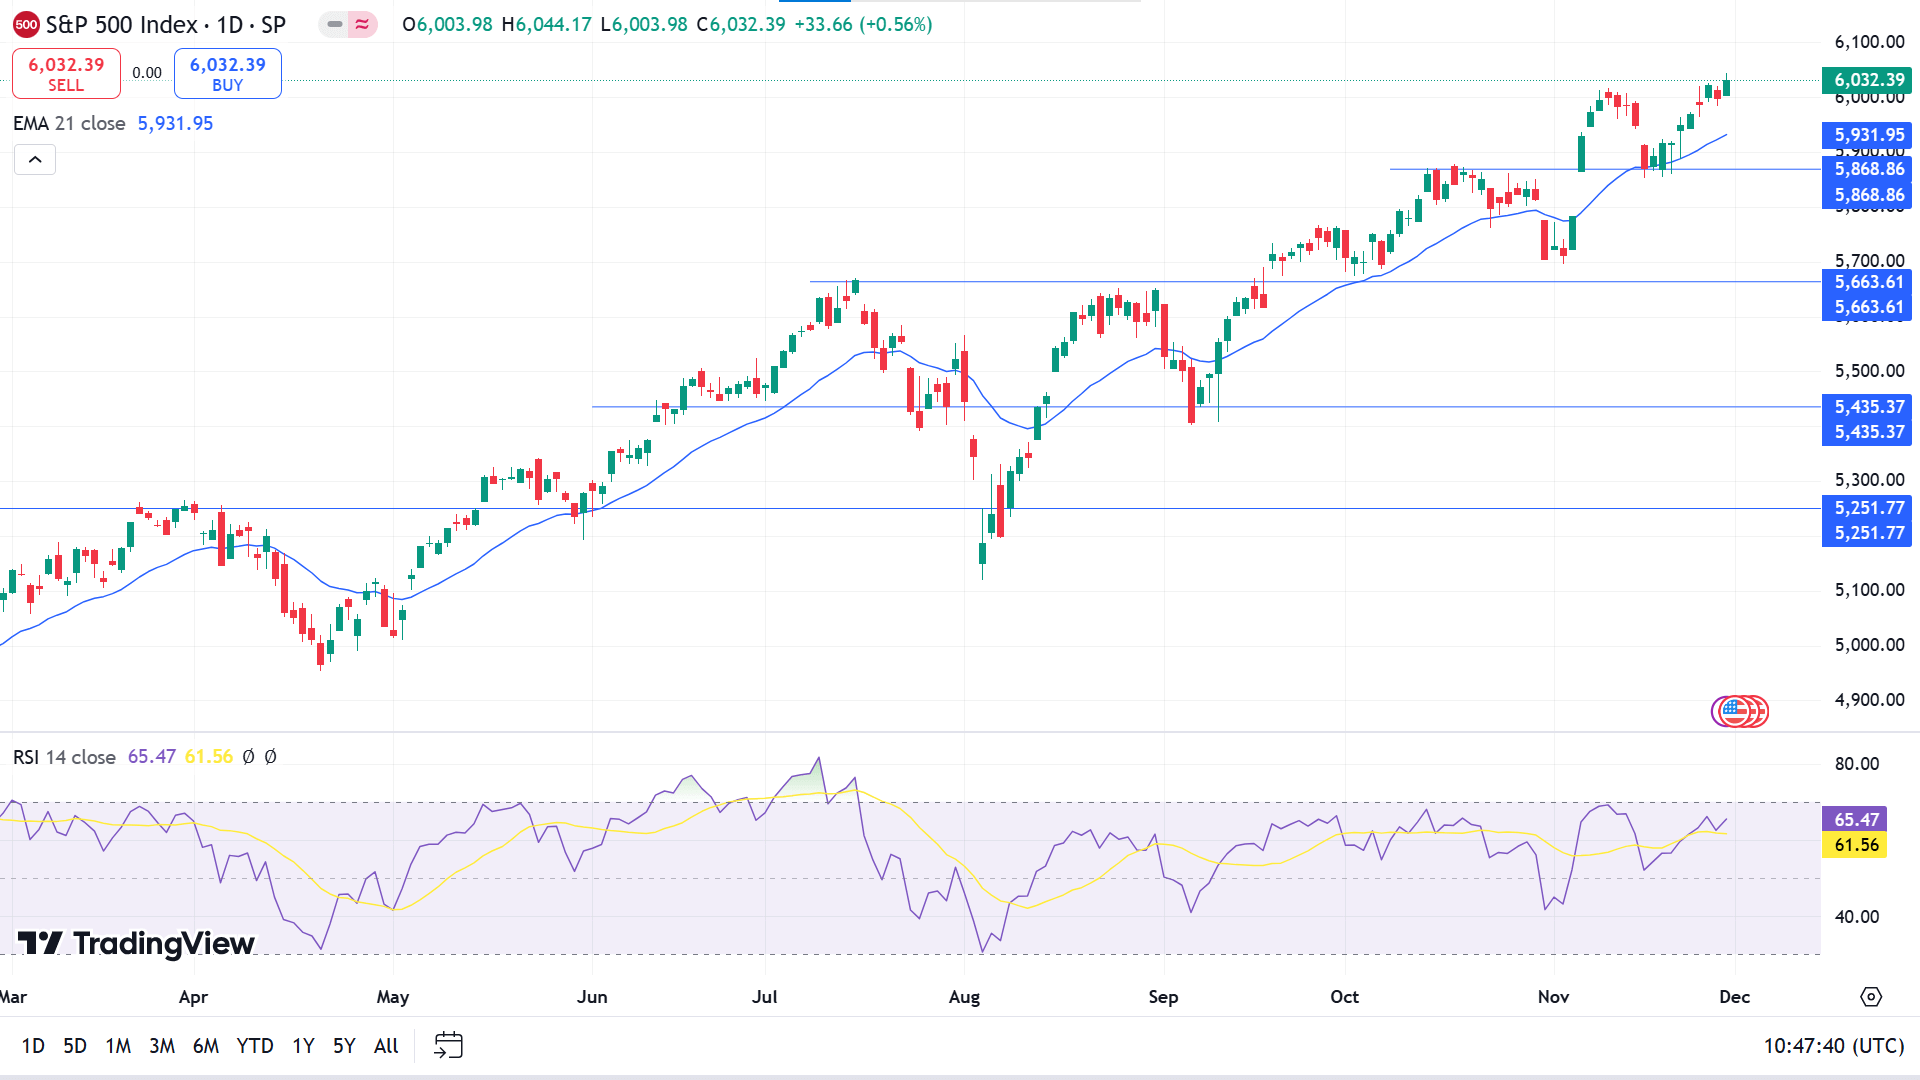
The S&P 500 index moves upward gradually as it remains above the EMA 21 line. In contrast, the RSI dynamic line floats just below the upper line of the indicator window, edging higher and confirming solid bullish pressure on the asset price.
Evaluating the current market context through the price action concepts, buyers keep an eye on 5868.86 to maximise their profits towards the ATH or beyond.
On the other hand, if the price drops below 5868.86, it might deny the validation of the current bullish signal and enable short-term selling opportunities toward the primary support near 5663.61.
Gold (XAUUSD)
Fundamental Perspective
Gold (XAU/USD) began the week under significant selling pressure, easing geopolitical tensions and improved risk appetite weighed on demand. News of a ceasefire agreement between Israel and Hezbollah and the nomination of fund manager Scott Bessent as US Treasury Secretary fueled optimism, driving risk flows into financial markets. Gold dropped nearly 3% on Monday, briefly finding support during European trading hours from a weaker US Dollar (USD) and declining Treasury yields.
After falling to $2,600 early Tuesday, Gold steadied and closed slightly higher. A further dip in the 10-year US Treasury yield to its lowest level in a month, below 4.3%, supported a two-day rebound through Wednesday. Mixed US economic data added to market uncertainty midweek. Durable Goods Orders rose by 0.2% in October, missing expectations, while core PCE inflation, the Federal Reserve's preferred gauge, increased to 2.8% annually, aligning with forecasts but indicating persistent inflationary pressures.
Trading was subdued on Thursday due to the Thanksgiving holiday, but Gold gained momentum on Friday as Treasury yields extended their decline, lifting XAU/USD above $2,650.
This week's US labour market data could shape the Federal Reserve's December policy decision expectations. A strong Nonfarm Payrolls (NFP) reading might boost yields and weigh on Gold, while weaker data could reinforce hopes of a rate cut. Markets currently price a 65% chance of a December rate reduction, balancing Gold's outlook.
Technical Perspective
The price declined from the previous week's peak and ended with a red candle having a small lower week, confirming bearish pressure on the asset price. Remaining in a specific range for three weeks after a dive from the ATH reflects mixed signals to the precious metal investors on the weekly chart.
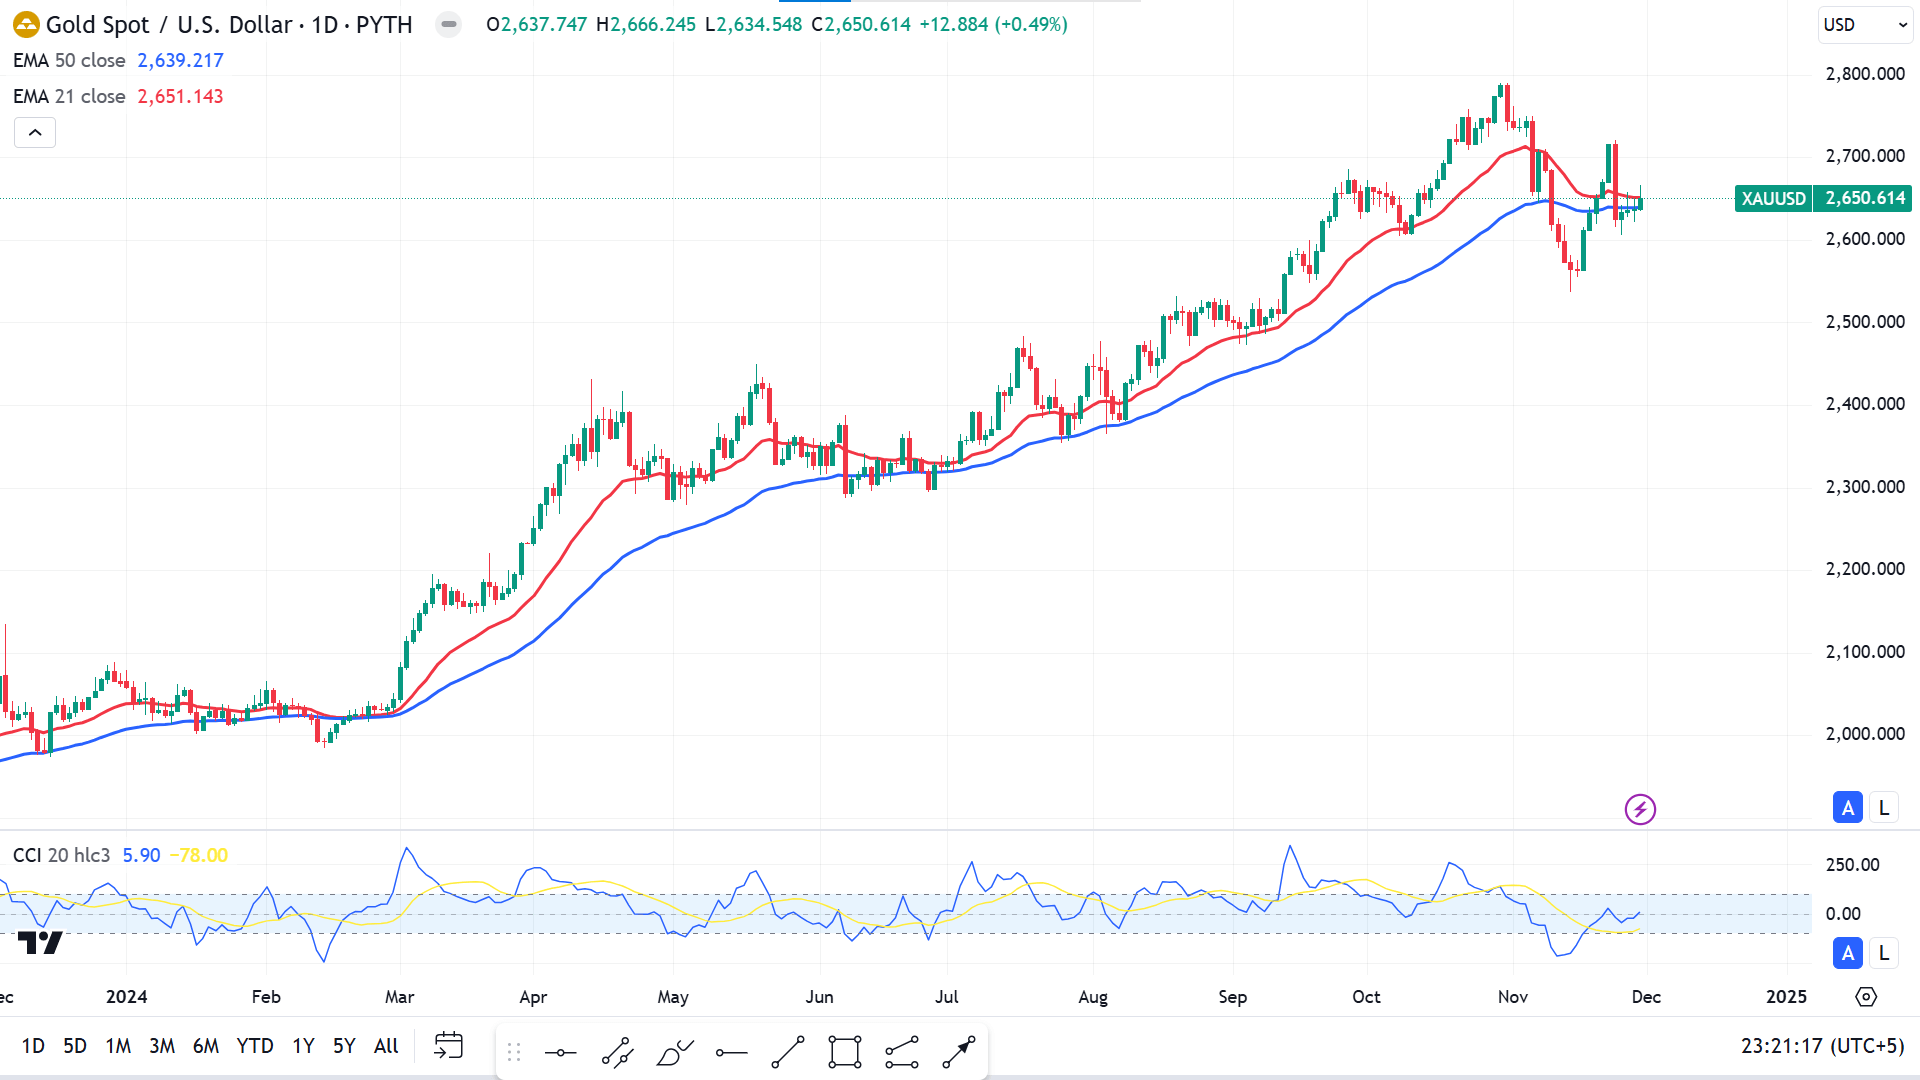
The price ended between the EMA 21 and EMA 50 lines on the daily chart, leaving investors conscious of making decisions, although the overall trend remains bullish. In contrast, the CCI dynamic line edge upside near the zero level of the indicator window keeps buyers optimistic.
Applying the price action concepts on the asset, buyers may seek to open precious trading positions near 2536.85 as it previously worked as a barrier for sellers, which might trigger the price toward the 2719.33 level.
On the other hand, the price dives below 2536.85, which might invalidate the bullish signal besides sparking selling opportunities toward 2444.31.
Bitcoin (BTCUSD)
Fundamental Perspective
Bitcoin fell short of the $100,000 milestone last week and began this week with a sharp 7% decline to a low of $90,791 on Tuesday. It regained some ground, closing above $95,500 on Wednesday, and hovered near $97,000 by Friday, reflecting a measured recovery.
Institutional activity shaped this movement, with Coinglass data revealing $558.1 million in outflows from Bitcoin Spot ETFs by Tuesday, followed by modest inflows through Thursday. Continued inflows could help sustain Bitcoin's recovery. Similarly, CryptoQuant reported that holders accumulated 35,449 BTC during the dip, signalling strong demand at lower prices.
Bitcoin's recent 42% rally over three weeks has driven unprecedented profit-taking, with long-term holders realising $2.02 billion in daily profits, according to Glassnode. This historic selling spree has introduced a supply overhang, suggesting consolidation may be needed before the cryptocurrency resumes its upward trajectory.
Glassnode noted that 35.3% of sell-side pressure came from coins held for 6 to 12 months, indicating swing traders taking profits following the ETF-driven surge. In contrast, seasoned investors appear patient, holding out for potentially higher price levels, underscoring the market's cautious optimism.
Technical Perspective
The massive bullish pressure drives the price above the consolidation phase on the weekly chart. The price posted three consecutive green candles, paused as the last weekly candle finished as a red hammer with a lower wick, leaving buyers optimistic.
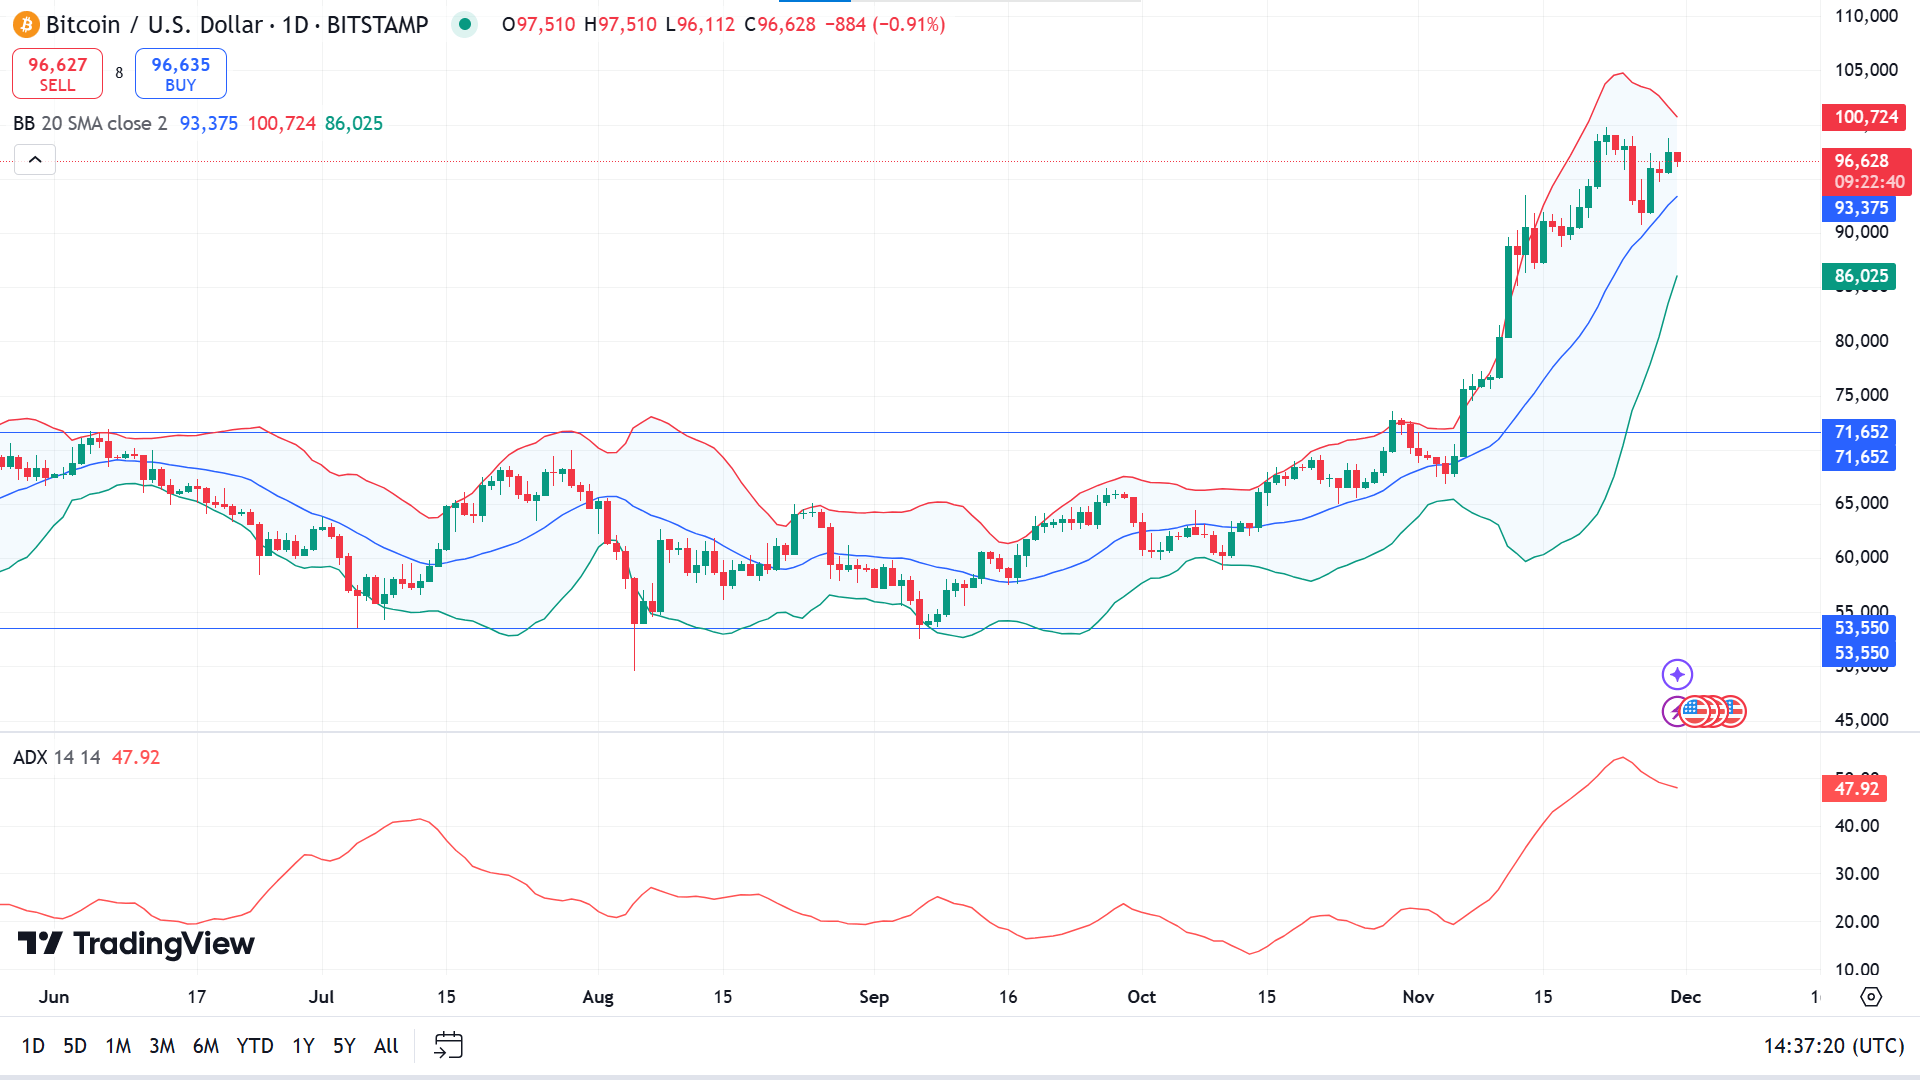
The price remains on the upper channel of the Bollinger bands indicator, declaring a bullish trend, while the ADX dynamic line slopes downward. Still, the reading remains at 47.92, reflecting that the current trend has sufficient strength to push the price further upside.
Based on this, buyers primarily seek to open lucrative long positions near 91,155, toward the anticipated 100,000 mark.
Meanwhile, the buyers might reconsider their positions if a red daily candle closes below the 91,155 level, as it might enable short-term selling opportunities toward the demand zone near the 86,951 level to gather significant bullish pressure toward the desired resistance levels.
Ethereum (ETHUSD)
Fundamental Perspective
Ethereum has captured investor interest last week, driven by robust institutional demand. ETH ETFs reported a fourth consecutive day of inflows, adding $90.1 million on Wednesday and bringing total net inflows to $243 million. This starkly contrasts the $3.37 billion outflows from Grayscale's ETHE, signalling Ethereum's growing appeal despite broader market trends.
As prices climb, profit-taking among investors has emerged. Ethereum co-founder Jeffrey Wilcke reportedly sold a portion of his holdings on Thursday. Data from crypto analytics platform Arkham reveals Wilcke transferred 20,000 ETH, worth $72.5 million, to Kraken. Nevertheless, he holds 106,000 ETH, valued at approximately $384 million, maintaining a significant stake.
The current market reflects a delicate balance between rising institutional inflows and strategic profit-taking by individual investors. This dynamic interplay shapes Ethereum's trajectory, offering insights into its evolving market landscape.
Technical Perspective
ETHUSD is moving on an uptrend, posting consecutive green candles on the weekly chart, and may be heading to reach the yearly range peak near 3971.61.

The price floats with the upper band of the Bollinger bands indicator, indicating significant bullish pressure on the asset. At the same time, the RSI dynamic line edges upward at the upper line of the indicator window, so buyer domination is visible on the asset.
Evaluating the current market context through the price action concepts, sellers may be looking at the previous bullish barrier near 3971.61. If the resistance works, the price can dive toward 3351.14, followed by the next support near 3044.76.
Meanwhile, a green daily candle close above the 3971.61 level might invalidate the bearish signal and spark buying opportunities toward 4744.48.
Nvidia Stock (NVDA)
Fundamental Perspective
Despite delivering exceptional results, NVIDIA Corporation (NASDAQ: NVDA) shares have fallen 10% since its third-quarter earnings release. Revenue soared 94% year-over-year to $35 billion, fueled by a 112% surge in its data centre segment, driven by strong AI-related demand. Net profit doubled to $20 billion, and NVIDIA issued a fourth-quarter revenue forecast slightly above Wall Street expectations. However, after a year of tripling in value, the decline seems partly attributed to profit-taking.
While solid, the company's fourth-quarter guidance raised questions about slowing growth. NVIDIA projected $37.5 billion in revenue, slightly above analysts' $37.09 billion estimate, representing a 70% year-over-year increase. This is a notable deceleration compared to the 265% growth achieved in the same period last year. Similarly, third-quarter revenue growth of 94% marked a consecutive slowdown from the prior quarters' growth rates of 122%, 262%, and 265%.
Geopolitical uncertainty has further weighed on sentiment. On 25 November, President-elect Donald Trump announced plans to impose substantial tariffs on imports from China, Canada, and Mexico, reviving fears of trade disruptions that could impact NVIDIA's operations and future growth trajectory.
Technical Perspective
Two consecutive hammers of different colors in the weekly chart having wicks on different sides reflect indecisions, which can turn into a trend-changing force as the price remains at the peak of a bullish trend. Although the overall trend is bullish, the price remains above a baseline.
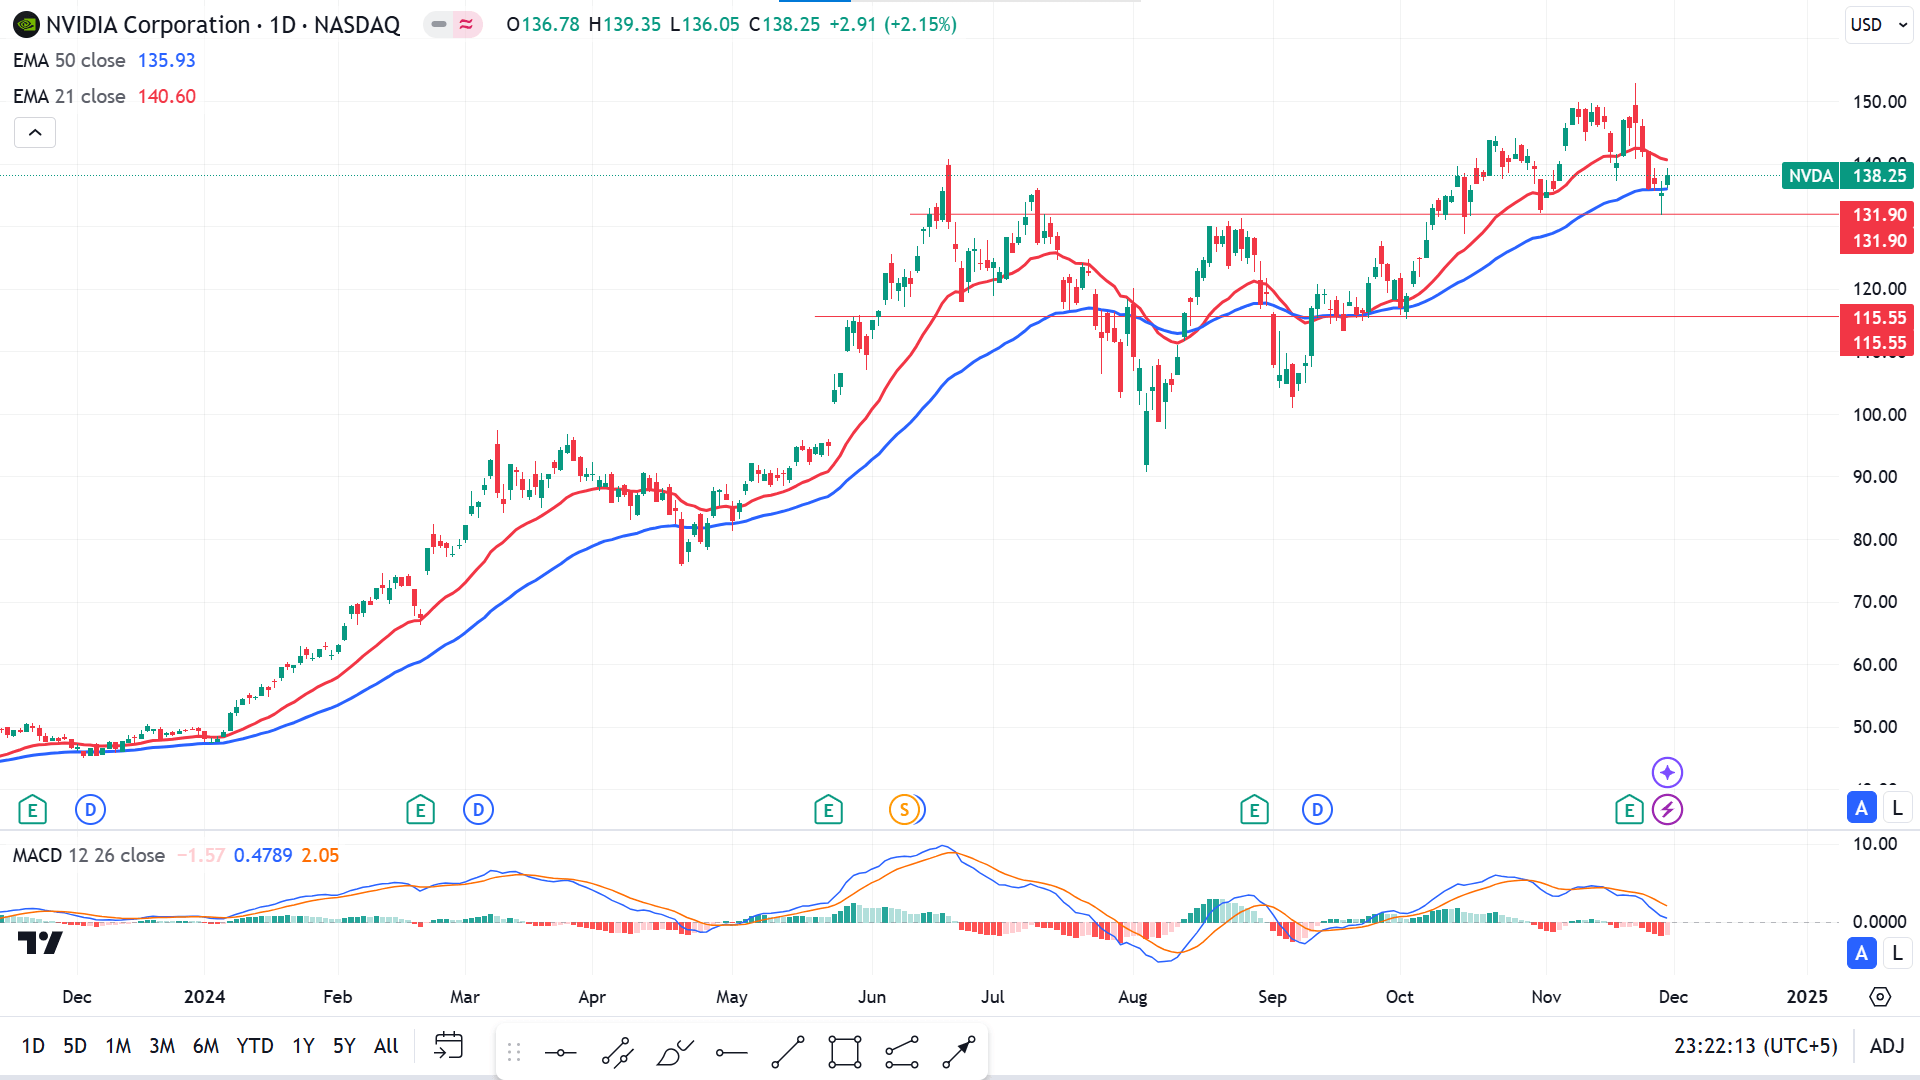
The price remains uptrend at the daily chart, floating between the EMA 21 and EMA 50 lines, reflecting mixed signals. In the meantime, the MACD indicator window reading is bearish, with dynamic signal lines sloping downward and red histogram bars below the midline of the indicator window.
According to this price action, the price remains above 131.90, leaving buyers optimistic toward the primary resistance of 152.89 or beyond, which is the current ATH.
Meanwhile, if a red daily candle closes below 131.90, it would disappoint buyers and may spark short-term selling opportunities toward 115.55.
Tesla Stock (TSLA)
Fundamental Perspective
The EV maker's stock gained 3.7% today, driven by broader market strength, bringing its year-to-date increase to nearly 40%. With a market capitalization of approximately $1.07 trillion, according to Visible Alpha data, the company remains among the elite group of eight firms valued above $1 trillion.
The stock's upward momentum was supported by a bullish note from Wedbush analyst Dan Ives, who reaffirmed an outperform rating and set a $400 price target. This figure, the highest tracked by Visible Alpha, significantly surpasses the average analyst estimate of $255, reflecting Ives' confidence in the company's trajectory.
Ives highlighted the expected policy advantages under the incoming Trump administration, where Tesla CEO Elon Musk is poised to play a significant advisory role. He suggested this political alignment could accelerate progress in self-driving technology and artificial intelligence, which are critical components of Tesla's long-term vision.
Technical Perspective
The last weekly candle closed as a red hammer candle with a lower wick, reflecting a slower pace in the current uptrend. The price is struggling to hit the resistance of 384.20 on the weekly chart.
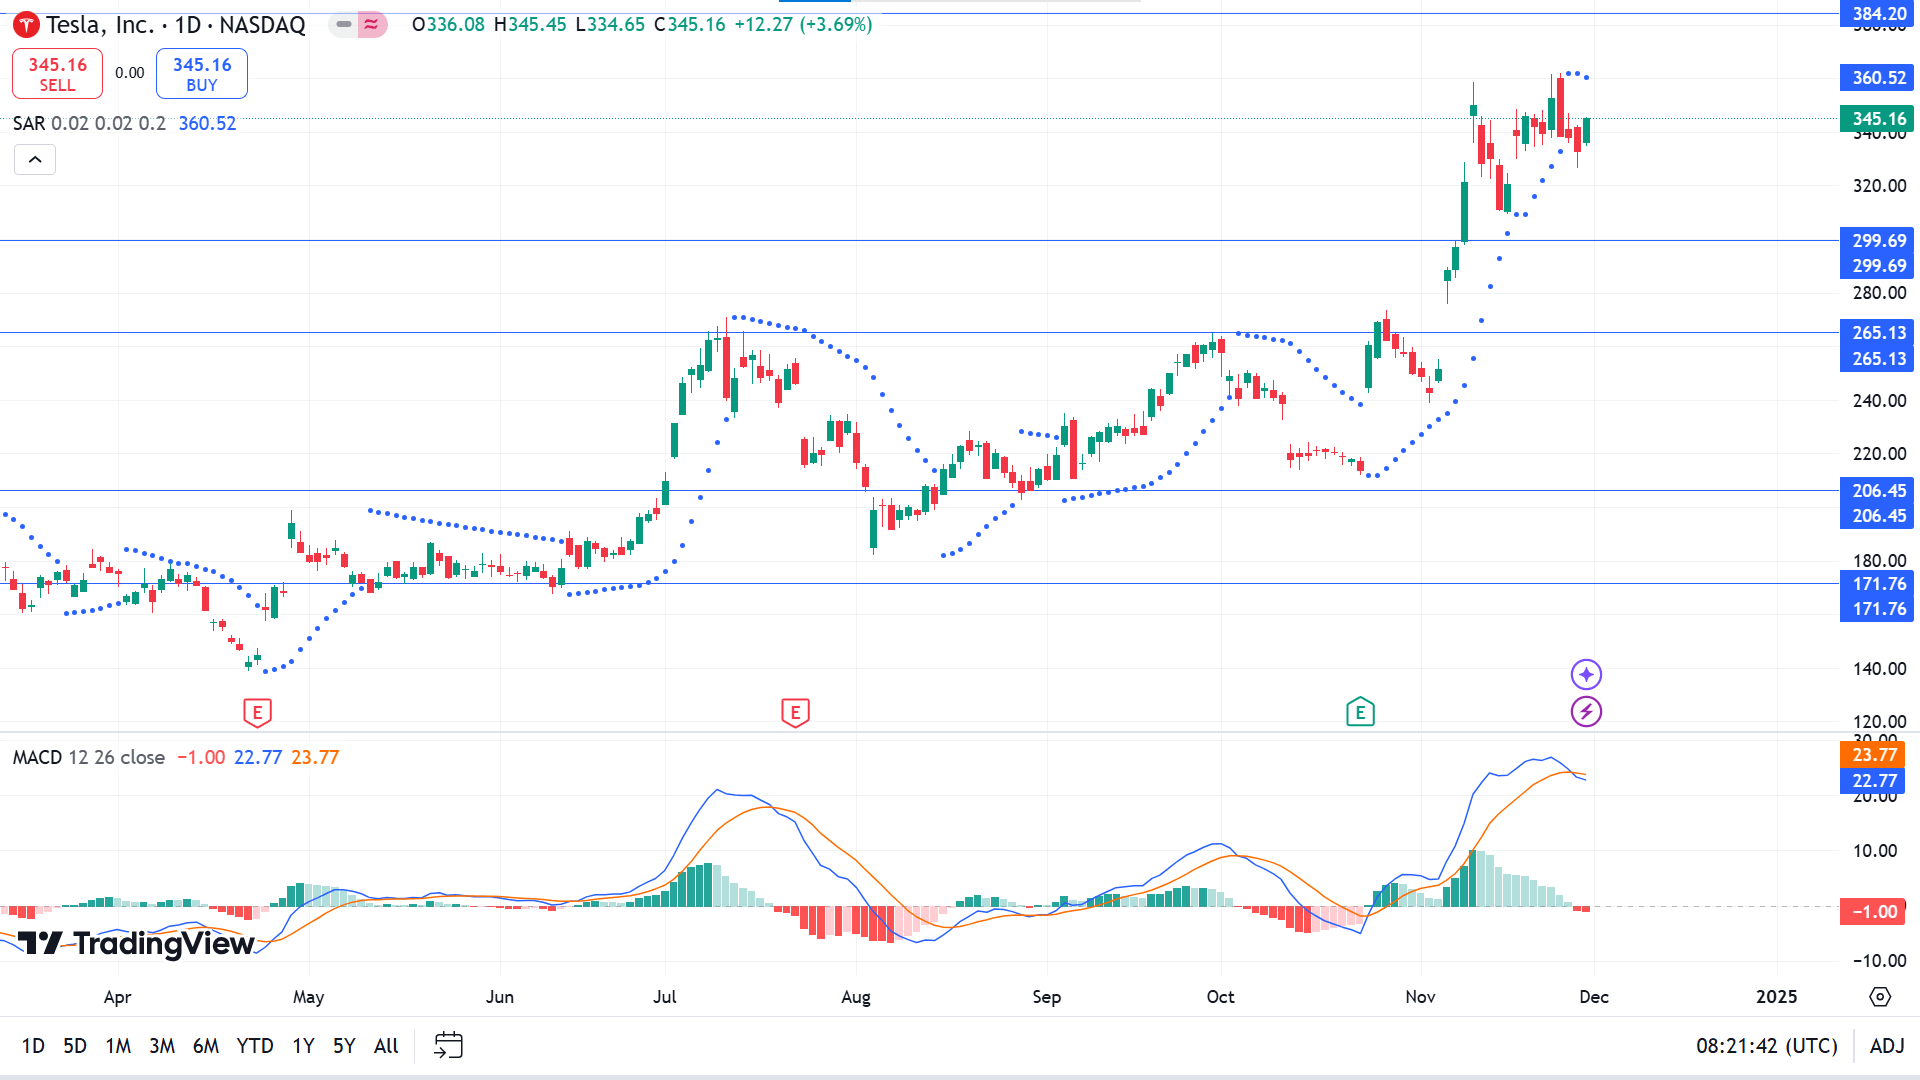
On the daily chart, the price is floating below the yearly high, while the Parabolic SAR creates dots above the price candles, indicating a bearish initiation. The MACD indicator reading also declares fresh bearish pressure as the dynamic signal lines form a bearish crossover, and red histogram bars appear below the midline of the indicator window.
The current market context suggests buyers may seek to open adequate long positions near 299.69, while sellers may primarily keep an eye on the resistance near 384.20.
Meanwhile, buyers might be disappointed if the price declines below 299.69, as it would deny all buy signals and spark selling opportunities toward the 265.13 level.
WTI Crude Oil (USOUSD)
Fundamental Perspective
Crude oil prices are advancing by nearly 1% during U.S. trading hours, fueled by anticipation surrounding the upcoming OPEC+ output policy meeting, which has been postponed to next Thursday. Despite the rally, a weekly loss appears unavoidable, as markets have already priced in a potential delay in production normalization to the first quarter of 2025.
The U.S. Dollar Index (DXY) continued to weaken amid limited market activity following the Thanksgiving holiday. The dollar's decline is linked to a narrowing yield gap between the U.S. and Europe, driven by rising French bond yields due to political uncertainty. French Prime Minister Michel Barnier faces a Monday deadline to propose a deeply reduced budget or risk government collapse under pressure from Marine Le Pen's far-right National Rally party.
At the time of writing, West Texas Intermediate (WTI) crude trades at $68.00 per barrel, while Brent crude is at $72.30.
Looking ahead, oil markets remain focused on OPEC+ developments. Reports suggest Saudi Aramco may lower the January official selling price for Arab Light crude to Asia by $0.70 per barrel. Meanwhile, OPEC+ ministers are set to gather at the Gulf Cooperation Council summit in Kuwait on Sunday for discussions ahead of Thursday's meeting, as weather, demand, and geopolitical uncertainties continue to cloud the outlook.
Technical Perspective
Crude oil ended the last week as a solid red candle, erasing most gains from the previous week, sparking selling opportunities and leaving sellers optimistic.
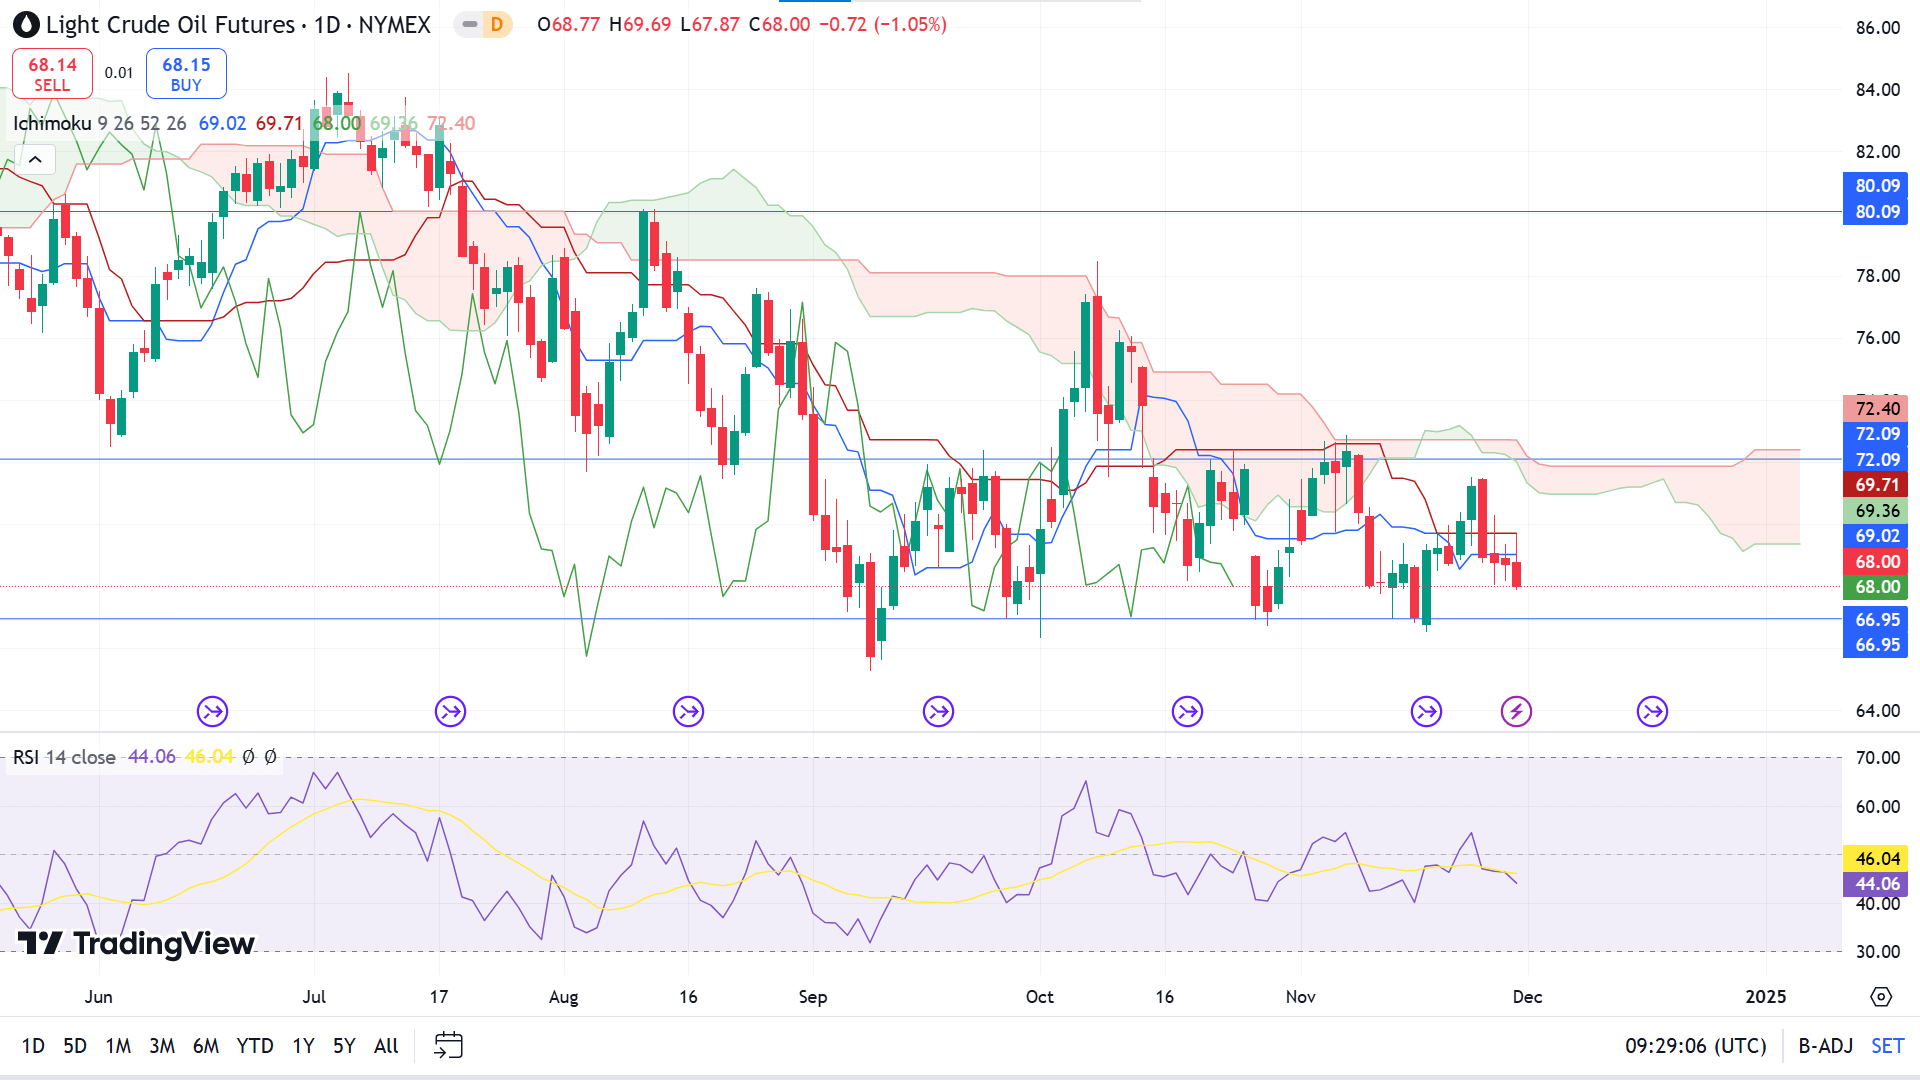
The price is moving below the red cloud of the Ichimoku Cloud indicator, indicating bearish pressure on the asset price. At the same time, the RSI reading also supports the bearish pressure through the dynamic signal line edging below the midline of the indicator window. The price gets back on the consolidating phase rather than hitting the range top, confirming sellers' domination.
Evaluating the current market context, buyers might be looking at the range low near 66.95, as the level worked as a seller barrier several times, marking an effective support level. At the same time, sellers may seek to open adequate short positions near 72.09 as it is the range top.
Meanwhile, if the price drops below the adequate support of 66.95, it might disappoint buyers by denying the buy signal, while it could trigger sellers toward the yearly low near 65.27.


