
EURUSD
Fundamental Perspective
EUR/USD continued its upward trajectory, achieving a fourth week of gains and reaching a new 2024 peak in the 1.1180–1.1185 range. This surge was driven by a sharp decline in the US Dollar as market sentiment shifted towards an anticipated Federal Reserve interest rate cut in September. In his Jackson Hole Symposium speech, Fed Chair Jerome Powell reinforced this expectation by expressing confidence that US inflation is moving steadily toward the Fed's target, suggesting a likely quarter-point rate reduction.
Meanwhile, the European Central Bank is also expected to lower rates, with markets anticipating cuts in September and December, potentially bringing the deposit facility rate to 3.25% by year-end. This expectation arises from worsening economic conditions in the eurozone, particularly in Germany, even as inflation remains stubbornly high, especially in the services sector. A slowdown in wage growth across the Eurozone, notably in Germany, adds weight to the case for ECB easing.
As the policy divergence between the Fed and ECB narrows, the focus shifts to the underlying economic conditions, where the US appears firmer. This dynamic may limit the US Dollar's downside in the long term, even as the Euro continues to show short-term strength.
Technical Perspective
A bullish candle was seen on the weekly timeframe, suggesting an upward continuation. Therefore if the pair can hold the momentum, we may see more green days ahead.
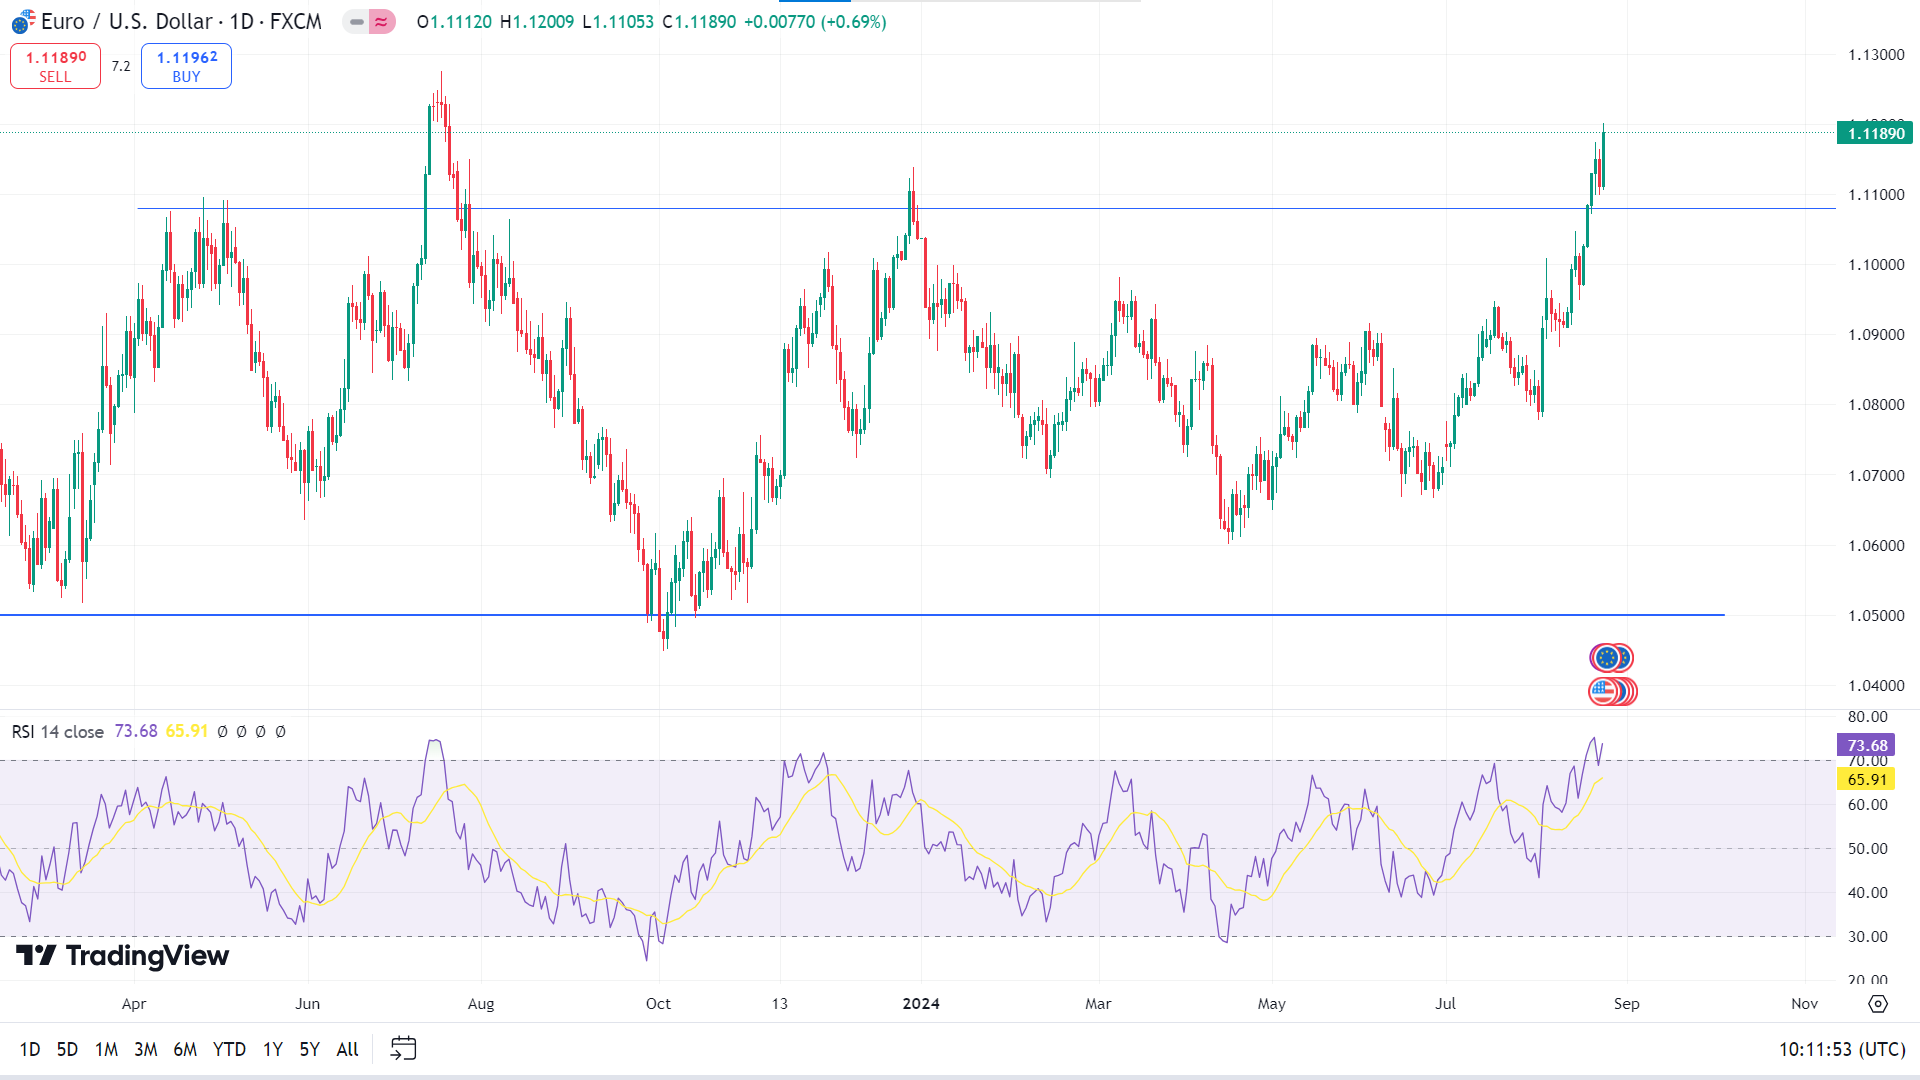
On the daily chart, the price aimed higher above the 1.1100 level with a bullish impulsive momentum. It is a sign of a stable trend, supported by the RSI above the 70.00 area. Following the buying pressure, the price may head toward the primary resistance of 1.1275.
On the other hand, a considerable downside pressure is pending as a mean reversion. If the RSI signal line edges toward the midline, it may lead the price toward the primary support near 1.1080, followed by the next support near 1.0900 before bouncing back.
GBPJPY
Fundamental Perspective
In August, the UK's Manufacturing PMI increased to 52.5 from 52.1 in July, slightly surpassing market expectations. The preliminary UK Services Business Activity Index also showed improvement, climbing to 53.3 in August from 52.5 in July, exceeding the anticipated 52.8. These indicators suggest a modest strengthening in the UK's economic activity, particularly in the services sector.
Meanwhile, the Japanese Yen appreciated against the US Dollar, driven by Japan's latest National Consumer Price Index (CPI) data and comments from Bank of Japan (BoJ) Governor Kazuo Ueda. The CPI rose by 2.8% year-on-year in July, maintaining this level for the third consecutive month and marking the highest rate since February. Additionally, the CPI excluding Fresh Food increased by 2.7%, hitting its highest since February.
In his address to the Japanese parliament, Governor Ueda emphasized the BoJ's steady approach to monetary policy, noting that adjustments would only be considered if the economy and inflation continue to align with forecasts. He clarified that the BoJ is not currently planning to sell long-term Japanese government bonds to manage interest rates, suggesting any future changes would be incremental and data-dependent.
Technical Perspective
The last weekly candle closed as a doji after a solid green candle, reflecting a pause in the uptrend. However, a valid break towards the buyers side could resume the existing trend, and can make a new swing high in this week
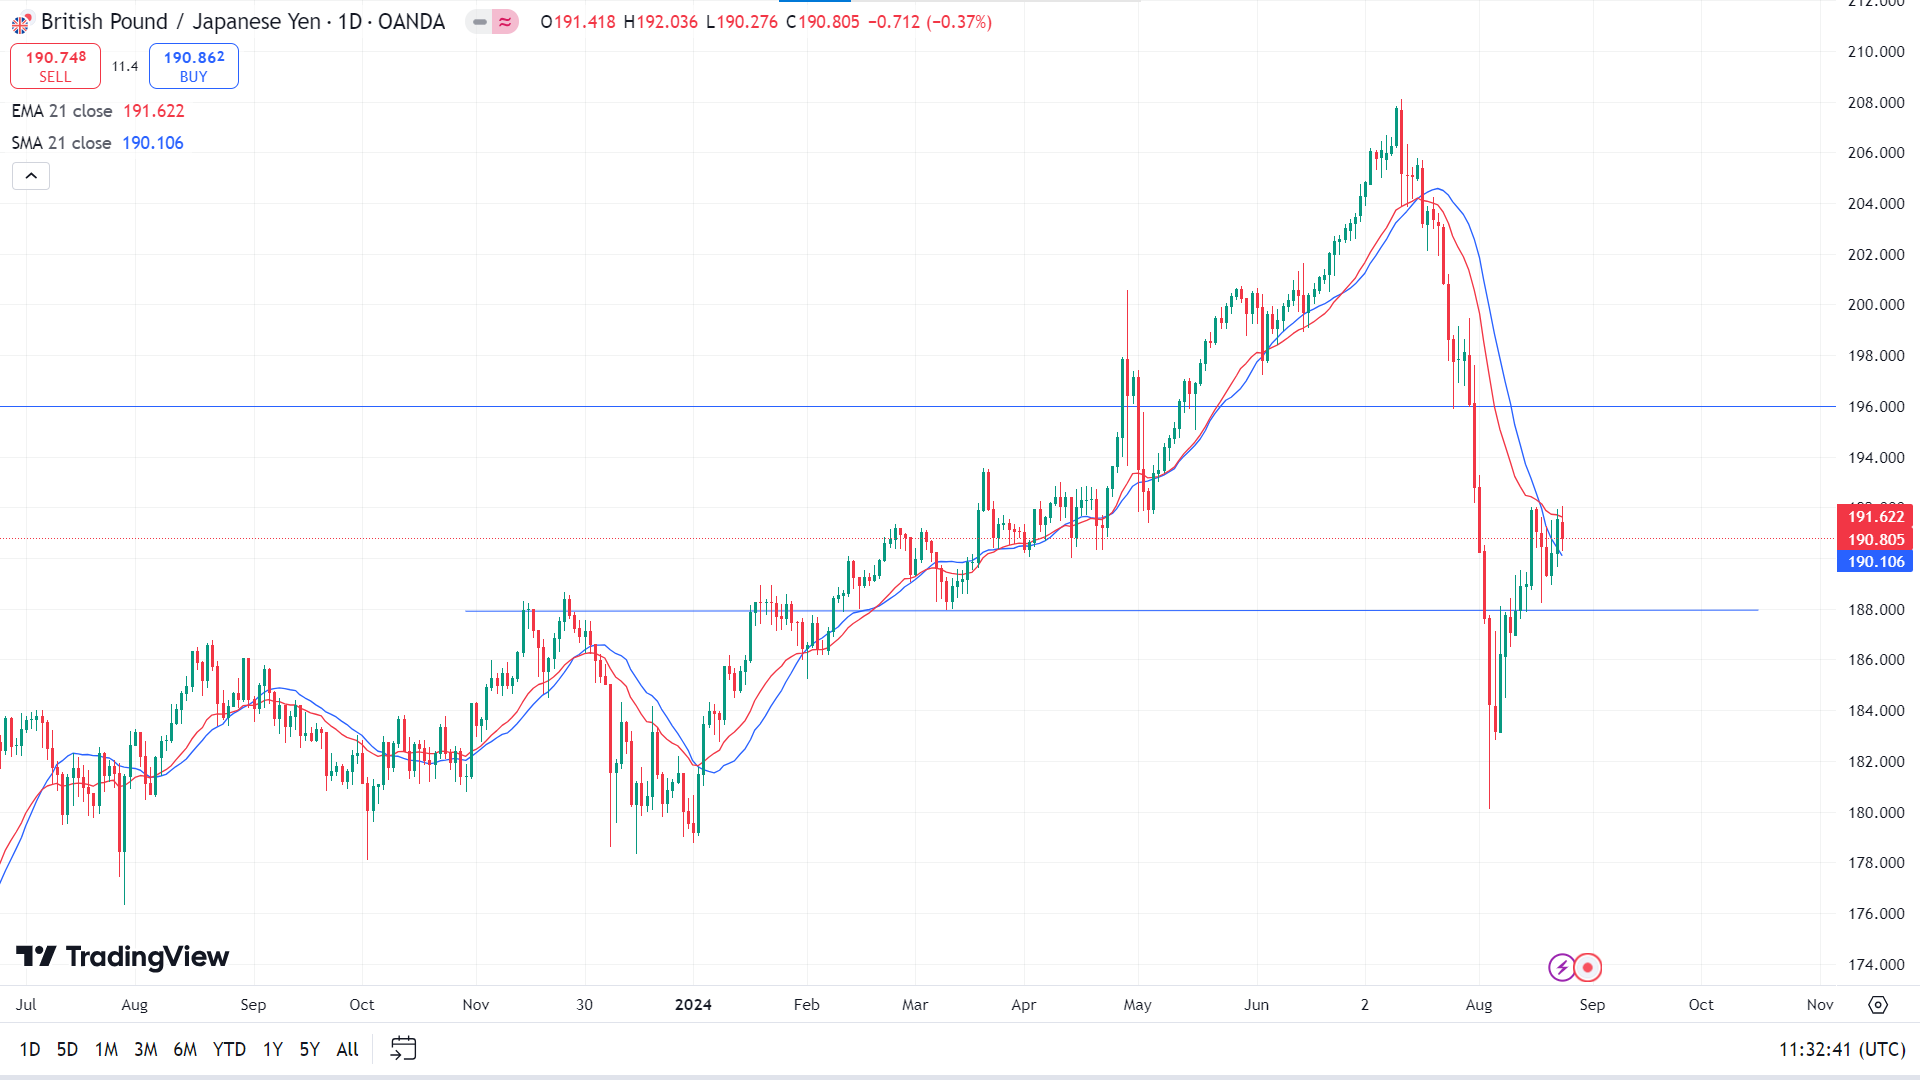
The price is floating between the EMA 21 and SMA 21 lines, indicating a mixed signal on the asset price at the daily chart. If the price exceeds the EMA 21 line with a bullish daily candle, the price may head toward the immediate resistance near 196.00. Meanwhile, a breakout above the 196.00 level could extend the momentum above the 205.56 psychological area.
In contrast, if the price declines below the SMA 21 line, indicating bearish pressure, it may reach the nearest support near 187.90, followed by the next support near 183.01.
Nasdaq 100 (NAS100)
Fundamental Perspective
On Thursday, U.S. economic data offered a mixed perspective. The S&P Global manufacturing PMI fell to 48.0 in August, marking an 8-month low and falling short of the expected 49.5. In contrast, the services PMI unexpectedly rose to 55.2, outperforming forecasts of 54.0. Meanwhile, initial jobless claims increased by 4,000 to 232,000, matching market expectations. Additionally, U.S. existing home sales saw a modest rise of 1.3% month-over-month in July, reaching 3.95 million, slightly above the anticipated 3.94 million.
Amid these developments, Boston Fed President Susan Collins indicated that it might soon be appropriate for the Federal Reserve to begin a rate-cutting cycle, advocating for a gradual and systematic approach to adjusting policy. Philadelphia Fed President Patrick Harker echoed this view, emphasizing that the magnitude of the first-rate reduction should be guided by upcoming economic data, with September as a potential starting point. However, Kansas City Fed President Jeffrey Schmid urged caution, preferring to see more economic data before supporting a rate cut, warning of a possible uptick in demand if rates are reduced too soon.
U.S. rate futures reflect a 75.5% likelihood of a 25-basis-point rate cut and a 24.5% chance of a 50-basis-point reduction at the September FOMC meeting.
Technical Perspective
The last weekly candle finished solid green. Three consecutive gaining weeks indicate optimism that the next candle might be another green one.
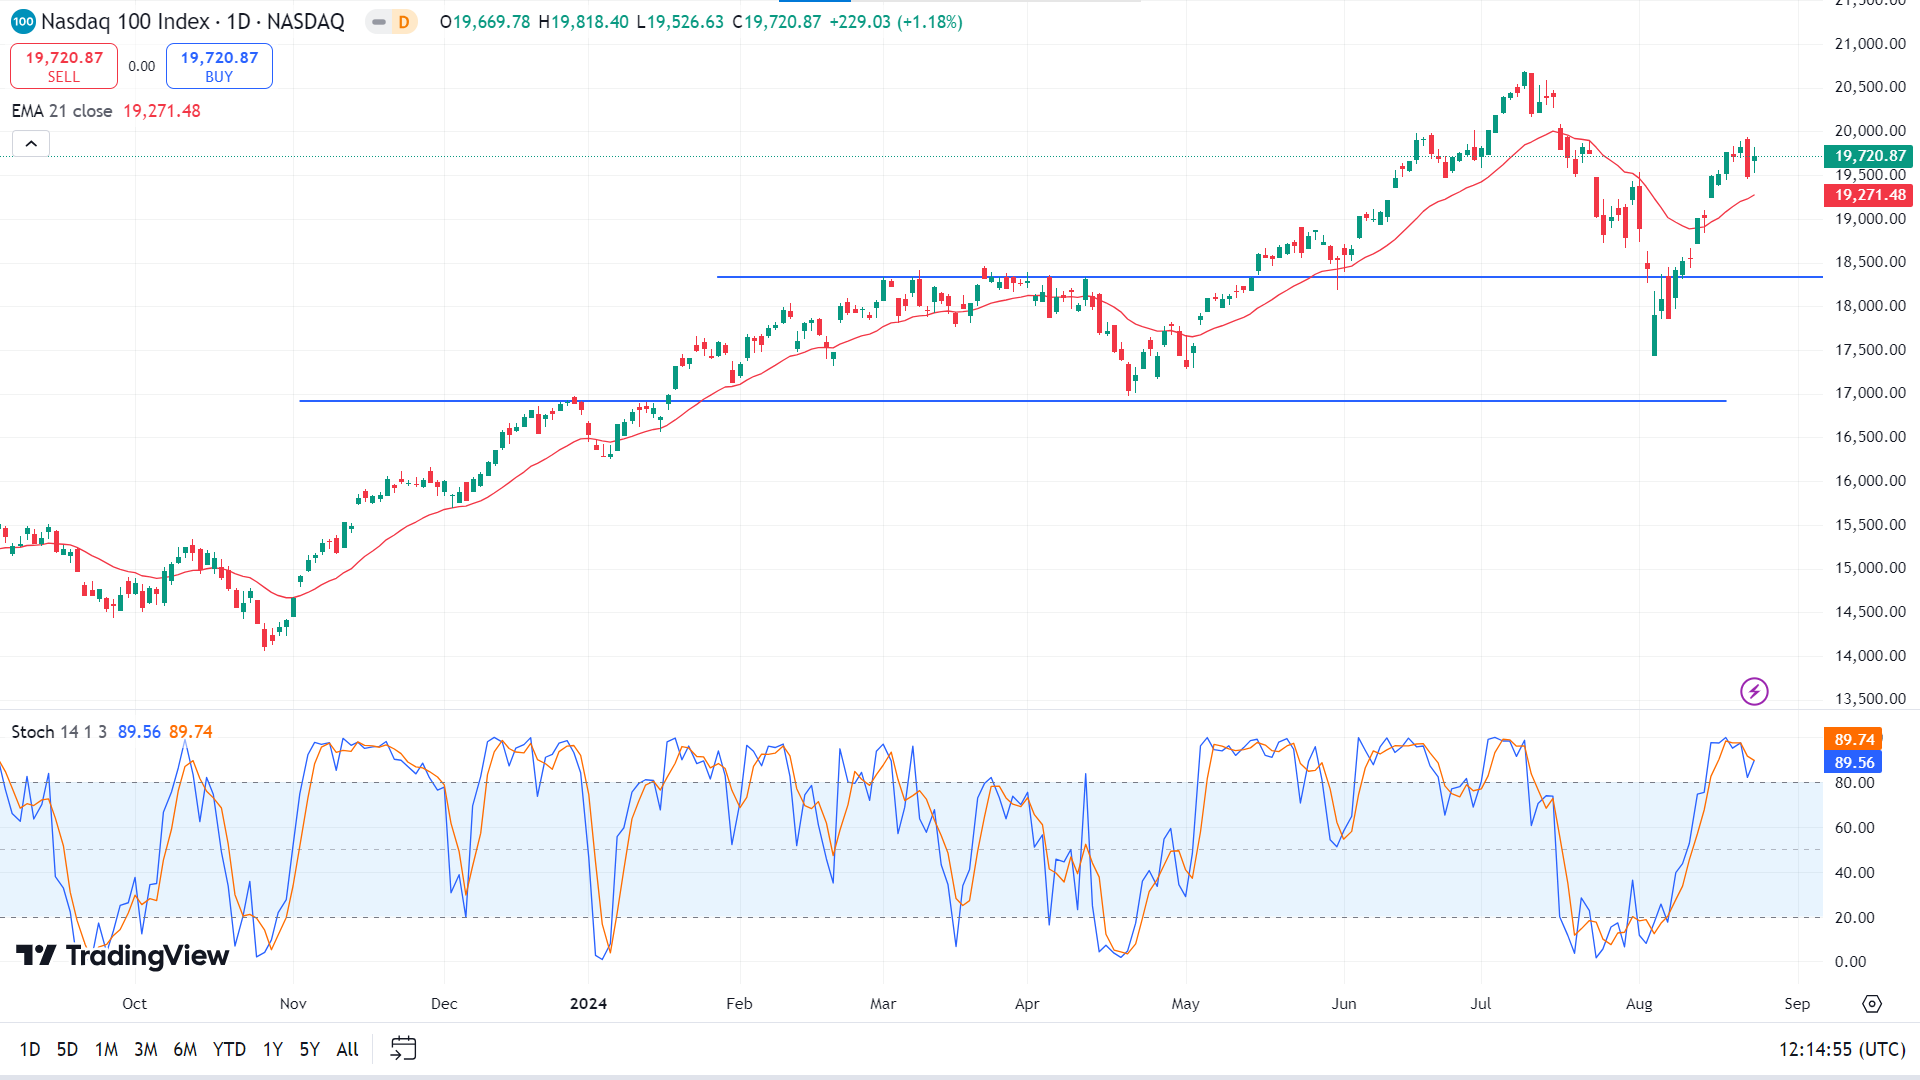
The daily chart's price floats above the EMA 21 day line, reflecting an ongoing bullish pressure. Moreover, the stochastic indicator window also suggests the upward pressure as it hovers above the upper bands zone. Considering the ongoing market momentum, the price may head toward the nearest resistance, near 20,346.61, before reaching the 20,824.21 level.
On the bearish side, signal lines above the upper line on the Stochastic indicator window may create a bearish crossover and start sloping downward. In that case, the price can hit the primary support of 19,003.08, following the next support near 18330.00.
S&P 500 (SPX500)
Fundamental Perspective
On Friday, all three major U.S. stock indexes rose by more than 1%, with the S&P 500 nearing an all-time high. The gains were fueled by Federal Reserve Chair Jerome Powell's announcement at the Jackson Hole economic conference that "the time has come" to reduce interest rates. Powell's support for easing monetary policy was driven by concerns about risks in the job market and inflation approaching the Fed's 2% target.
Minutes from the Fed's July meeting revealed that several policymakers were ready to consider rate cuts in September. It has led traders to fully price in a rate reduction at the Fed's September 17-18 meeting, with a 65.5% probability of a 25 basis point cut, according to the CME Group's FedWatch tool.
These dovish signals and data showing the economy is slowing only gradually have helped U.S. stocks rebound from earlier losses in August. The S&P 500, which had dropped nearly 9.7% from its July record high, is now less than 1% away from reaching that peak again, reflecting renewed investor optimism.
Technical Perspective
The last candle on the weekly chart closed solid green, posting three consecutive positive weeks, leaving optimism that the next candle might be another green one.
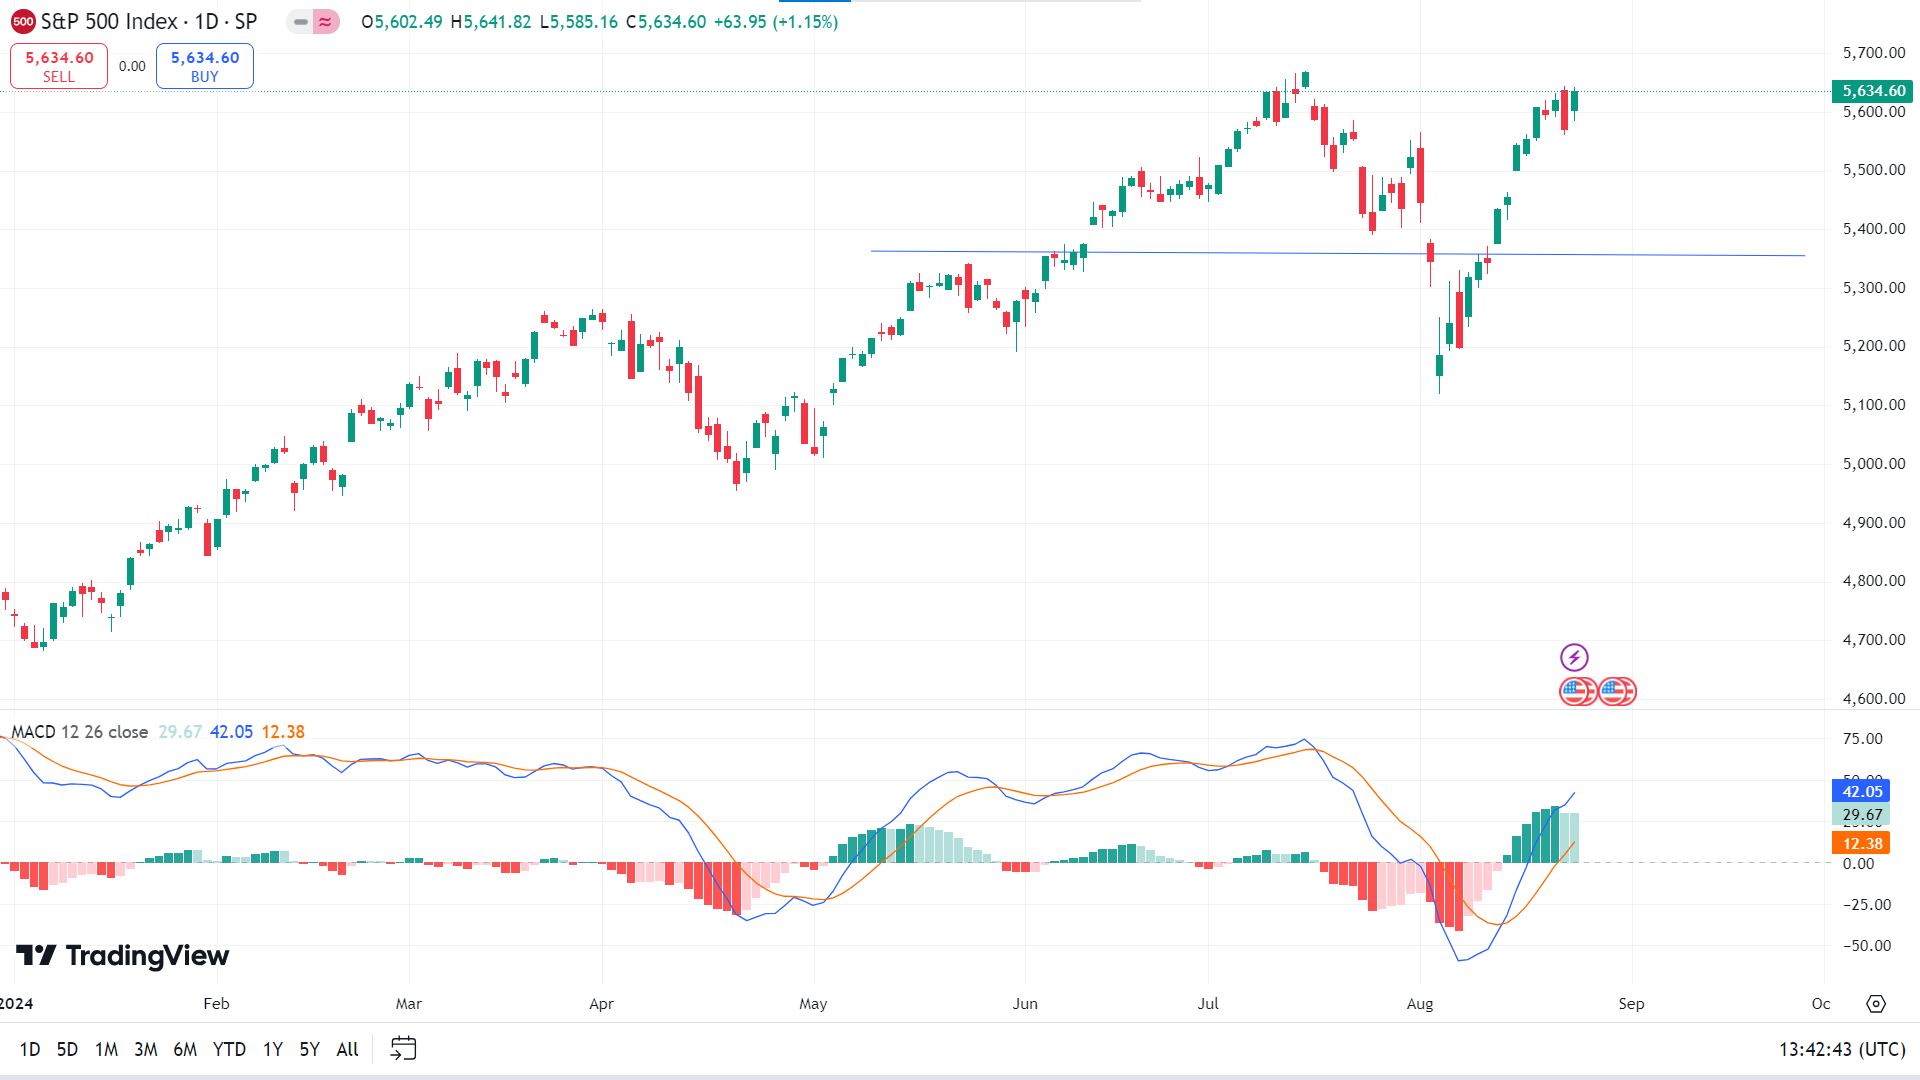
On the daily chart, the price remains upward as the dynamic 20-day EMA is below the current price. Also, the MACD indicator window confirms the bullish pressure through the dynamic signal lines and green histogram bars above the midline of the indicator window. In that case, the upward momentum might reach the next resistance above the ATH near 5,699.89, followed by the next resistance near 5,806.36.
On the other hand, a bearish daily close below the MA line with a bearish flip in the MACD indicator could decline toward the nearest support near 5,492.52. If the MACD signal lines start sloping downward and red histogram bars appear below the midline, the price can break the support and head for the next support near 5,355.39.
Gold (XAUUSD)
Fundamental Perspective
Gold (XAU/USD) experienced a dip after reaching a new all-time high this week but stayed above the $2,500 level on Friday. Following a solid finish to the previous week, Gold entered a consolidation phase on Monday and closed nearly unchanged. On Tuesday, dovish comments from Federal Reserve officials led to a decline in US Treasury yields, enabling Gold to achieve a record high of $2,531.
Fed Governor Michelle Bowman suggested that it might be appropriate to reduce rates gradually if inflation moves toward the Fed's 2% target. Minneapolis Fed President Neel Kashkari also mentioned that discussing a potential rate cut could be pertinent in September. On Wednesday, the US Bureau of Labor Statistics revised March 2024 nonfarm employment downward by 818,000. Additionally, minutes from the Fed's July meeting indicated that many policymakers would consider easing policy if economic data remained favorable.
Despite midweek declines, Gold rebounded above $2,500 as the US Dollar struggled. The recovery was supported by Fed Chairman Jerome Powell's Jackson Hole speech, which emphasised a potential adjustment in monetary policy. Next week, key data releases include Durable Goods Orders on Monday, the Q2 GDP growth estimate on Thursday, and July's Personal Consumption Expenditures (PCE) Price Index on Friday. The core PCE Price Index, forecast to rise by 0.2% monthly, will be closely watched for its impact on Gold and the USD.
Technical Perspective
The latest week closed as a Doji suggesting an indecision for the week. However, the broader market trend remains bullish from where a bullish break above the weekly high could resume the existing trend.
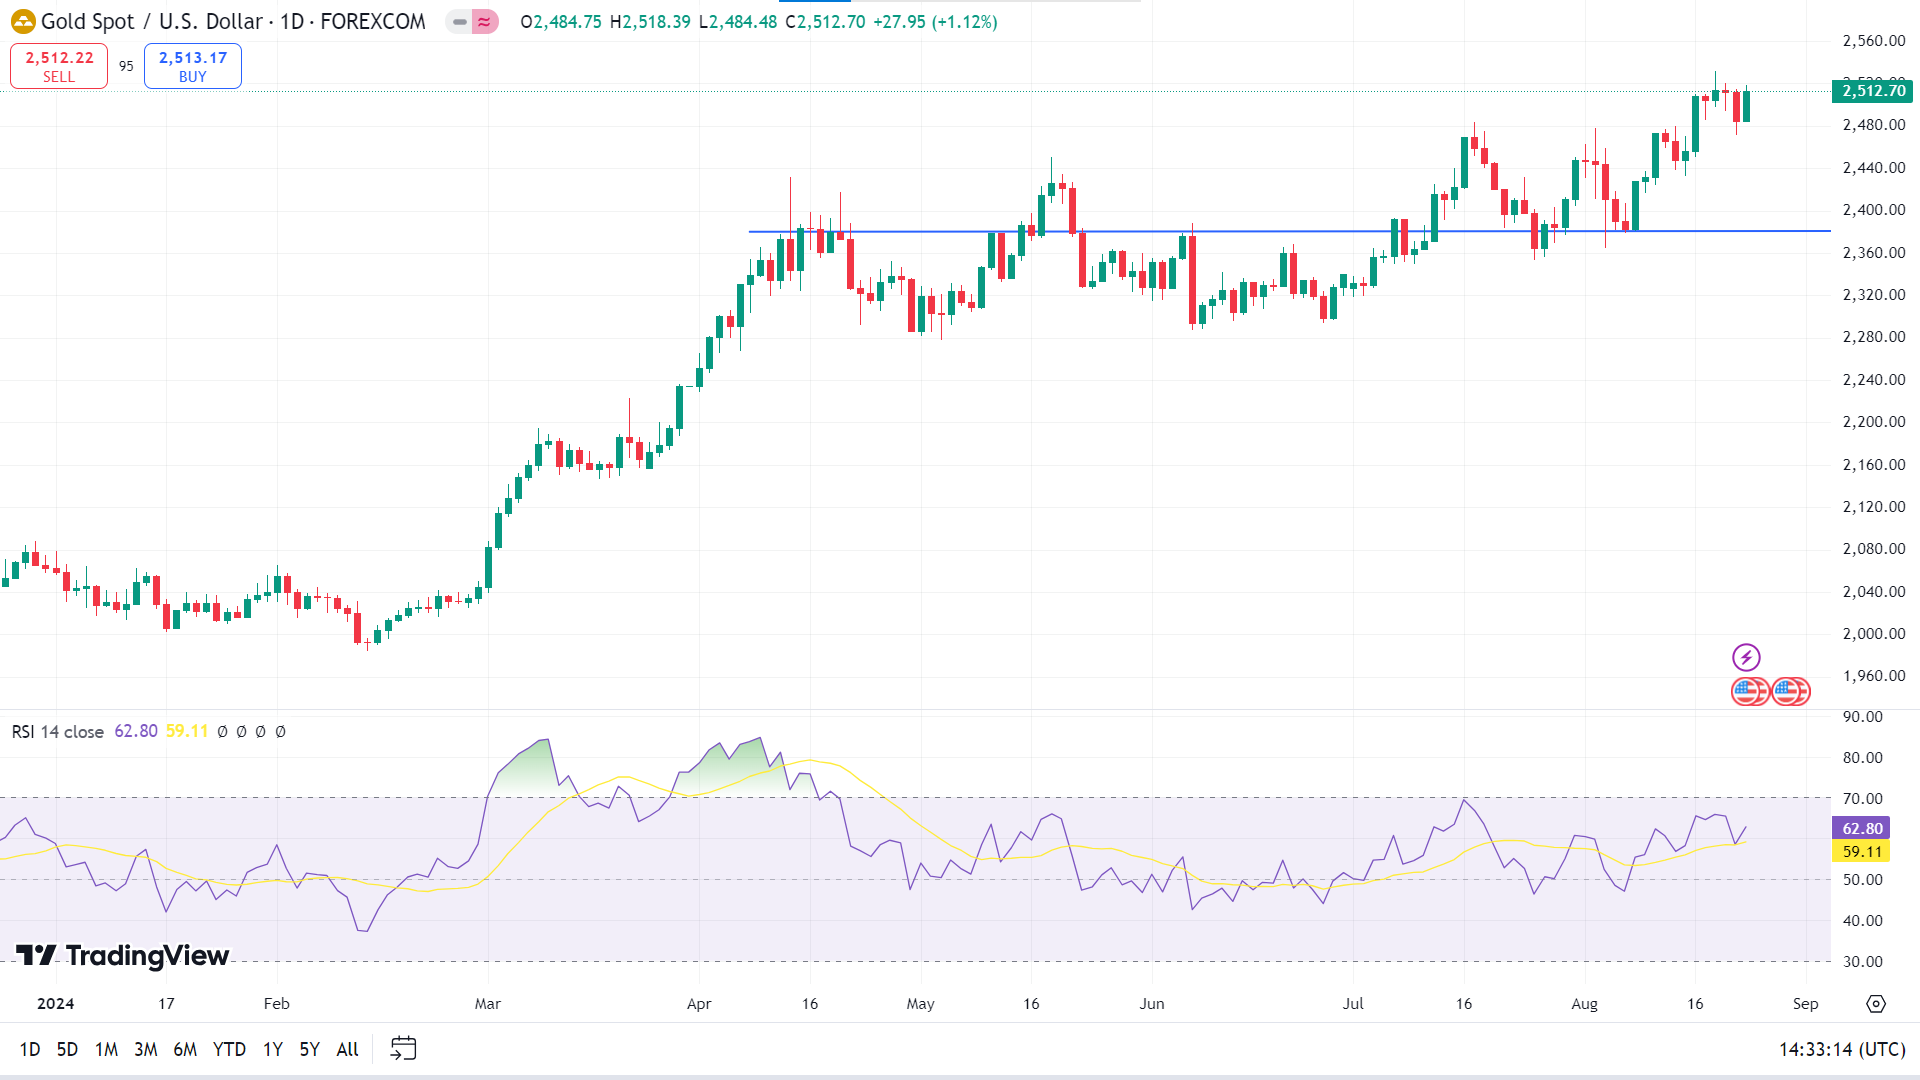
On the daily chart, the price stayed above the 2500.00 mark after reaching the ATH, as the RSI signal line is also just below the upper line, edging upside, supporting the bulls. The price may head toward the ATH of 2,531.79. However, any breakout can trigger the price toward a new resistance near 2,581.81.
In contrast, the 2400.00 level is the immediate crucial support level. However, the long-term market trend is bullish and from the all-time high level a massive exhaustion could signal a trend reversal opportunity.
Bitcoin (BTCUSD)
Fundamental Perspective
Bitcoin (BTC) traded above $60,000, posting a 4% gain for the week, although it has remained within a narrow range of $57,000 to $62,000 over the past 15 days. On-chain data reveals a mixed outlook: while institutions accumulate Bitcoin, some whales offload their holdings. Additionally, US spot Bitcoin ETFs saw inflows this week, yet potential volatility looms due to ongoing Mt. Gox fund movements.
Institutional-grade custody providers Ceffu and Cumberland withdrew 246.33 and 300 BTC, valued at $14.99 million and $18.36 million, from Binance on Friday, indicating institutional interest as Bitcoin's price stabilised. However, Lookonchain data shows a whale deposited 300 BTC into Binance at a loss, suggesting some large holders are selling.
Furthermore, the defunct exchange Mt. Gox transferred 13,265 BTC, worth $784.20 million, to a new wallet, raising concerns about possible sales on exchanges to repay creditors. Historically, such transfers have triggered significant price drops. Meanwhile, US spot Bitcoin ETFs experienced four consecutive days of mild inflows, totalling $254.4 million, offering limited support to Bitcoin's price amidst broader market uncertainties.
Technical Perspective
The last weekly candle is solid green after two doji candles, indicating that bulls may be back on the asset. The next candle might be another green one.
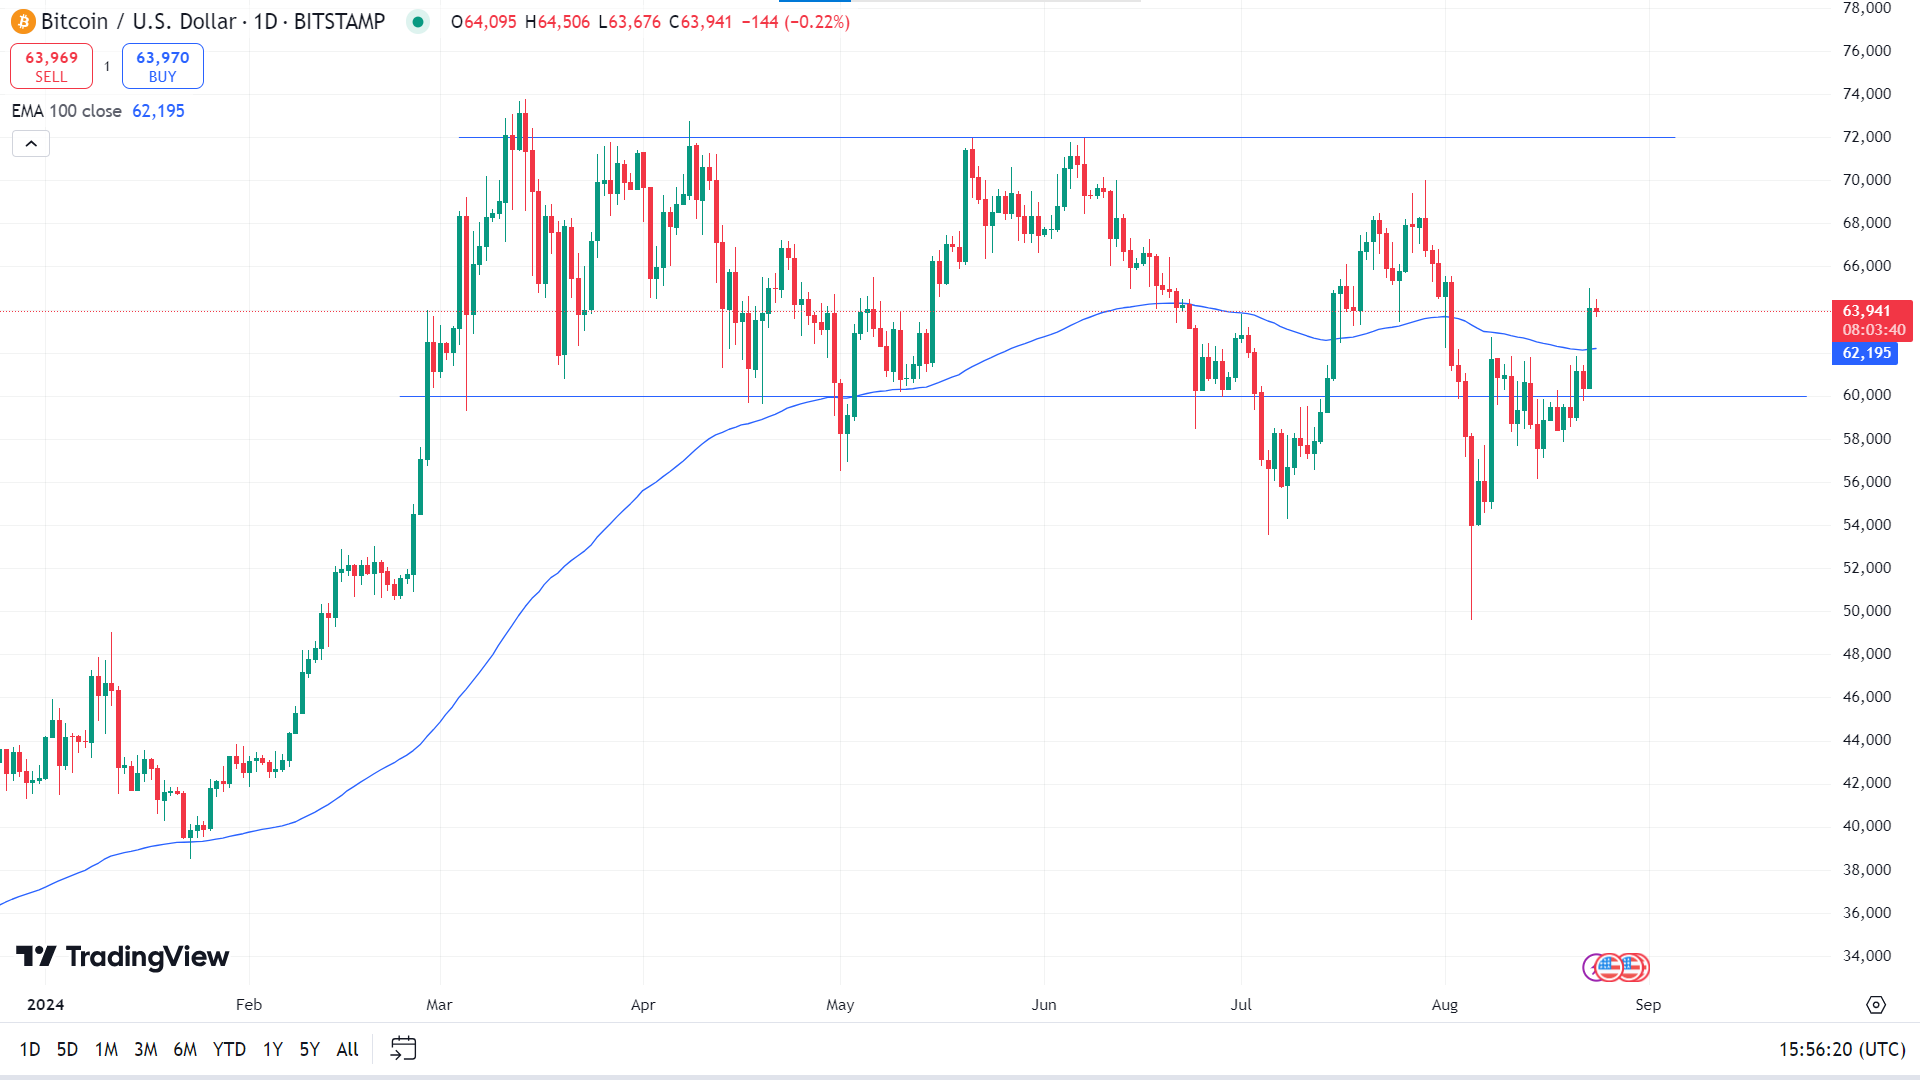
On the daily chart, the price exceeds the EMA 100 line, reflecting significant bullish pressure. So, the price may head toward the nearest resistance near 68,068, followed by the next resistance near 72,000.
Meanwhile, if the price declines below the EMA 100 line, it can reach the nearest support near 60,000, followed by the next support near 55,832.
Ethereum (ETHUSD)
Fundamental Perspective
Ethereum climbed over 6% on Friday as buying momentum surged following signals from US Federal Reserve Chair Jerome Powell that an interest rate cut is imminent. In his keynote at Jackson Hole, Powell indicated that the Fed is ready to adjust its policy, with the timing and pace of rate cuts contingent on upcoming data and the evolving economic outlook.
This announcement led to a 2% rise in Ethereum and broader crypto markets as investors regained confidence in the leading altcoin. Due to the reduced cost of capital, cryptocurrencies generally perform well in lower interest-rate environments.
Ethereum's buying pressure was evident in its exchange net flow, which recorded 283.9K ETH in outflows — the lowest level since June 11. Net outflows generally signal strong buying interest, as more coins are withdrawn from exchanges than deposited. The seven-day moving average for Ethereum's exchange net flow also showed a notable decline, reinforcing the bullish sentiment.
However, Ethereum ETFs had mixed results. While positive flows were seen in Fidelity's FETH and other ETFs, these were offset by significant outflows from Grayscale's ETHE. Despite this, the broader positive market sentiment suggests a potential shift toward net inflows for ETH ETFs by week's end.
Technical Perspective
The last weekly candle closed solid green, posting two consecutive gaining weeks, which indicates that bulls may be back on the asset price, and the next candle might be another green one.
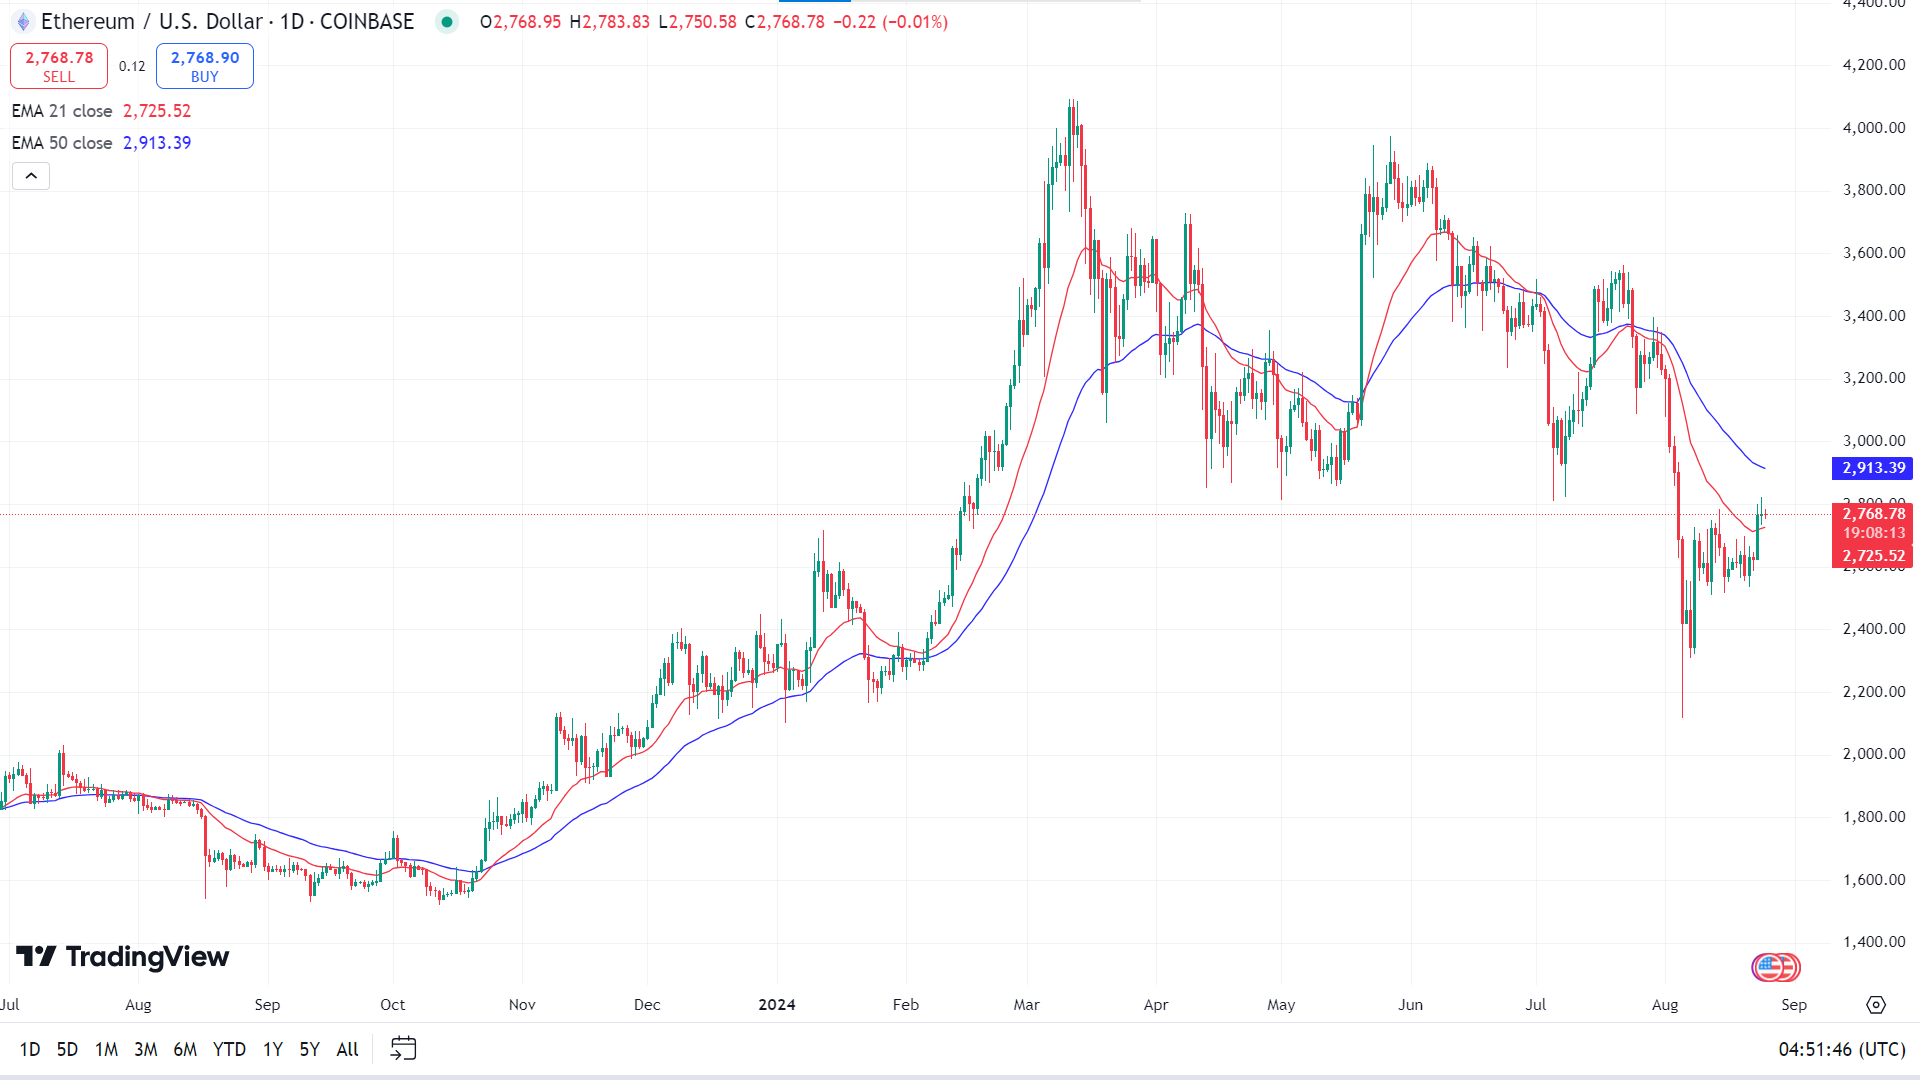
The price is floating between the EMA 50 and EMA 21 on the daily chart. The EMA 50 line acts as a dynamic resistance, and the EMA 21 line is a dynamic support. If the price reaches above the EMA 50 line, declaring significant bullish pressure, it can hit the primary resistance of 3,032.87, before reaching the 3,295.49 level.
Meanwhile, a downside pressure below the 21 day EMA could signal a significant bearish pressure, which may lead the price toward the nearest support near the 2,564.27 level.
Tesla Stock (TSLA)
Fundamental Perspective
Tesla, once the leader in the electric vehicle (EV) market, is now facing increasing competition from traditional automakers like Ford and General Motors, which have ramped up their EV production. Additionally, Chinese companies such as BYD and Nio are expanding rapidly, adding pressure to Tesla's market share in China. The rise in demand for hybrid vehicles, which offer electric and gasoline power, also poses a challenge for Tesla and other pure-play EV makers.
Tesla's strategy of offering discounts and competitive financing options might boost deliveries, but this could come at the expense of profit margins, putting pressure on revenue per unit and near-term profitability. While advancements in Full Self-Driving (FSD) technology and the upcoming Robotaxi service are promising, they will significantly impact Tesla's financials.
Despite these challenges, Tesla's Energy Storage division shines brightly. In Q2 2024, the division set a record with 9.4 GWh of energy storage deployments, driving record revenues and profits. This segment is crucial to Tesla's broader growth strategy, with a substantial backlog of orders signalling continued revenue growth.
Tesla's focus on reducing costs, particularly in lowering the cost of goods sold per vehicle, should help cushion margins, while efforts to accelerate AI-enabled products could enhance operational efficiency.
Technical Perspective
The last weekly candle closed with a small green body and wicks on both sides, declaring buyers are still active on the asset price, which indicates that the next candle might be another green one.
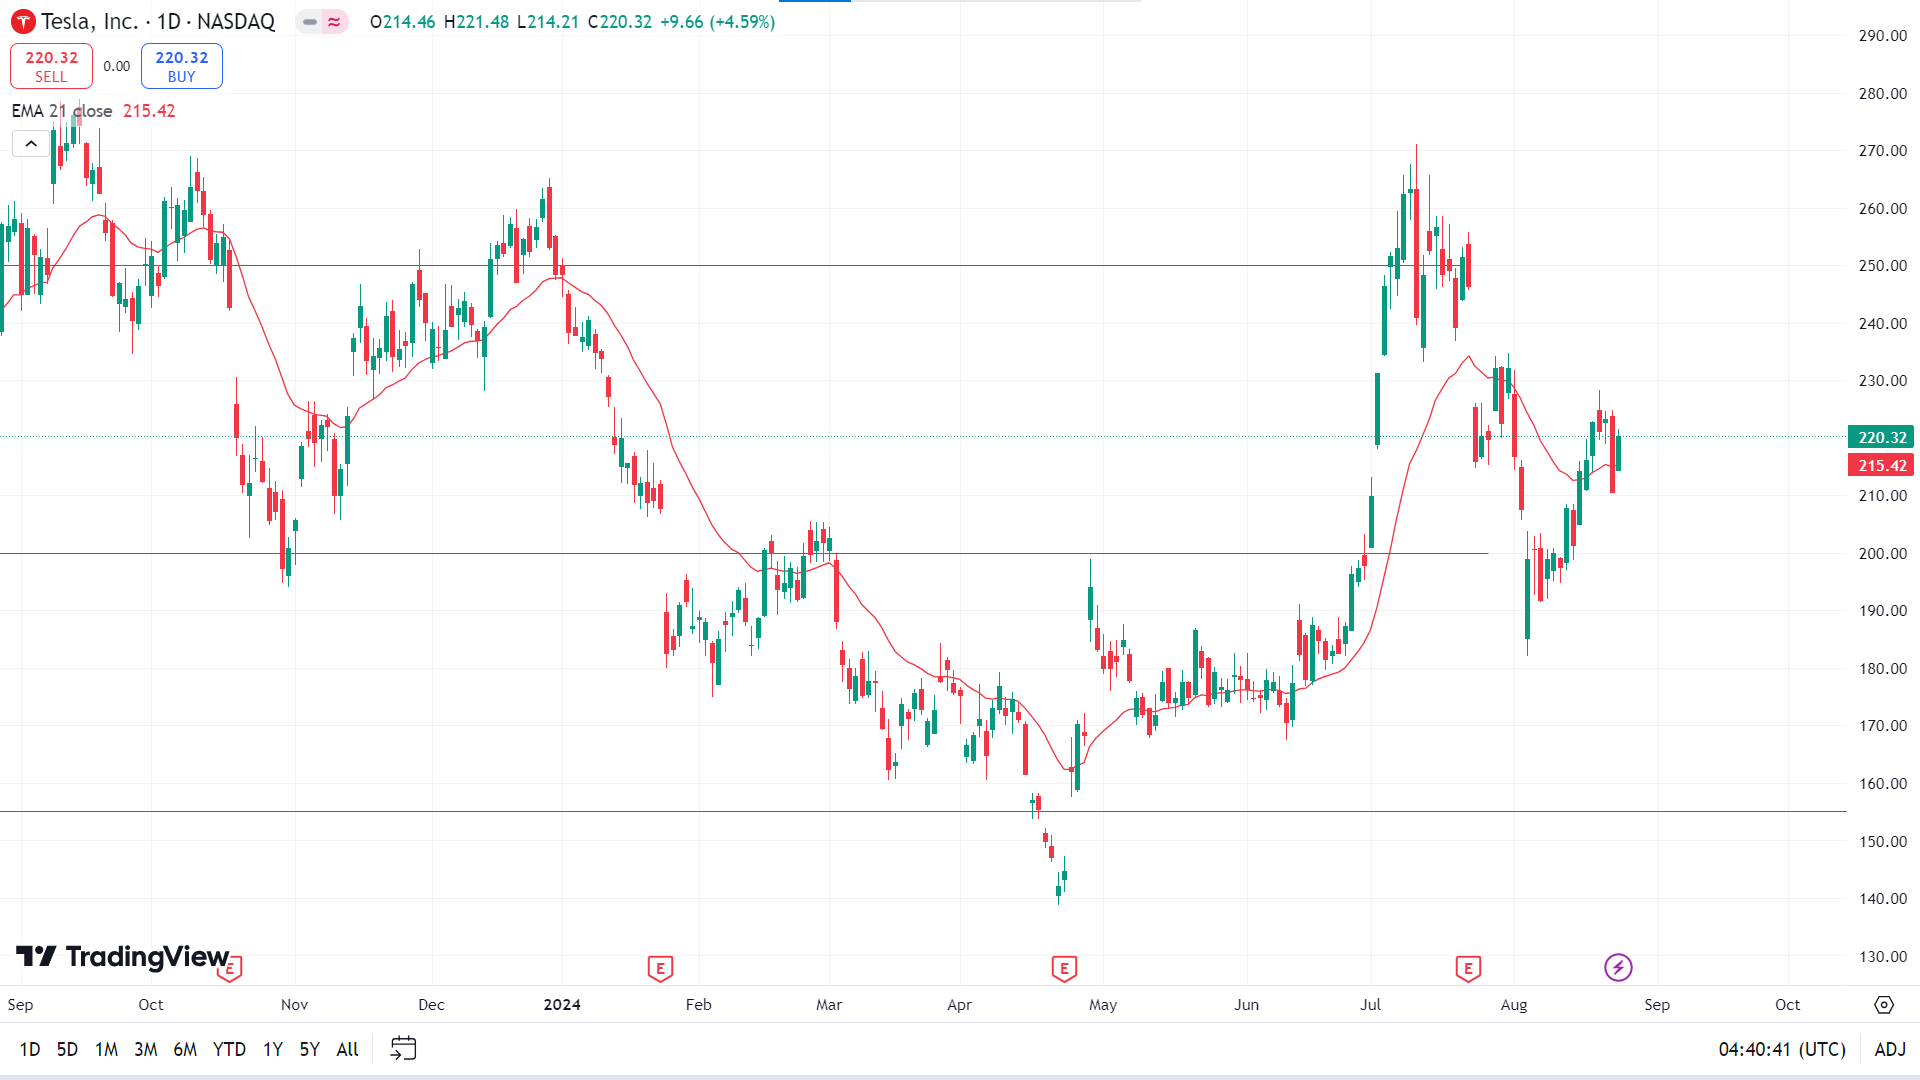
On the daily chart, the price exceeds the EMA 21 line, declaring a positive force on the asset price, which may lead the price toward the primary resistance near 234.50, followed by the next resistance near 249.99.
On the negative side, if the price drops below the EMA 21, it can reach the primary support near 204.90. However, any breakout can lead the price to the next support, which is near 192.17.
Nvidia Stock (NVDA)
Fundamental Perspective
Anticipation for Nvidia's (NVDA) earnings release on Wednesday is soaring, making it increasingly challenging for the AI leader to exceed investor hopes. Over the past 48 hours, consensus estimates for Nvidia's second-quarter revenue have jumped by $170 million to $28.84 billion, with net income projections rising by $120 million to $14.95 billion, according to Visible Alpha.
This optimism has some analysts concerned that investor expectations might outpace even the most bullish Wall Street predictions. However, Wedbush analysts remain confident, forecasting another standout performance from Nvidia, driven by solid enterprise AI demand and substantial spending by cloud giants like Amazon and Google. Raymond James and KeyBanc analysts share this positive outlook despite recent concerns over a potential delay in Nvidia's Blackwell AI chip. As the earnings release approaches, the pressure is on Nvidia to meet or exceed these heightened expectations.
Technical Perspective
The last weekly candle closed solid green, posting three consecutive gaining weeks, leaving buyers optimistic for the next week.
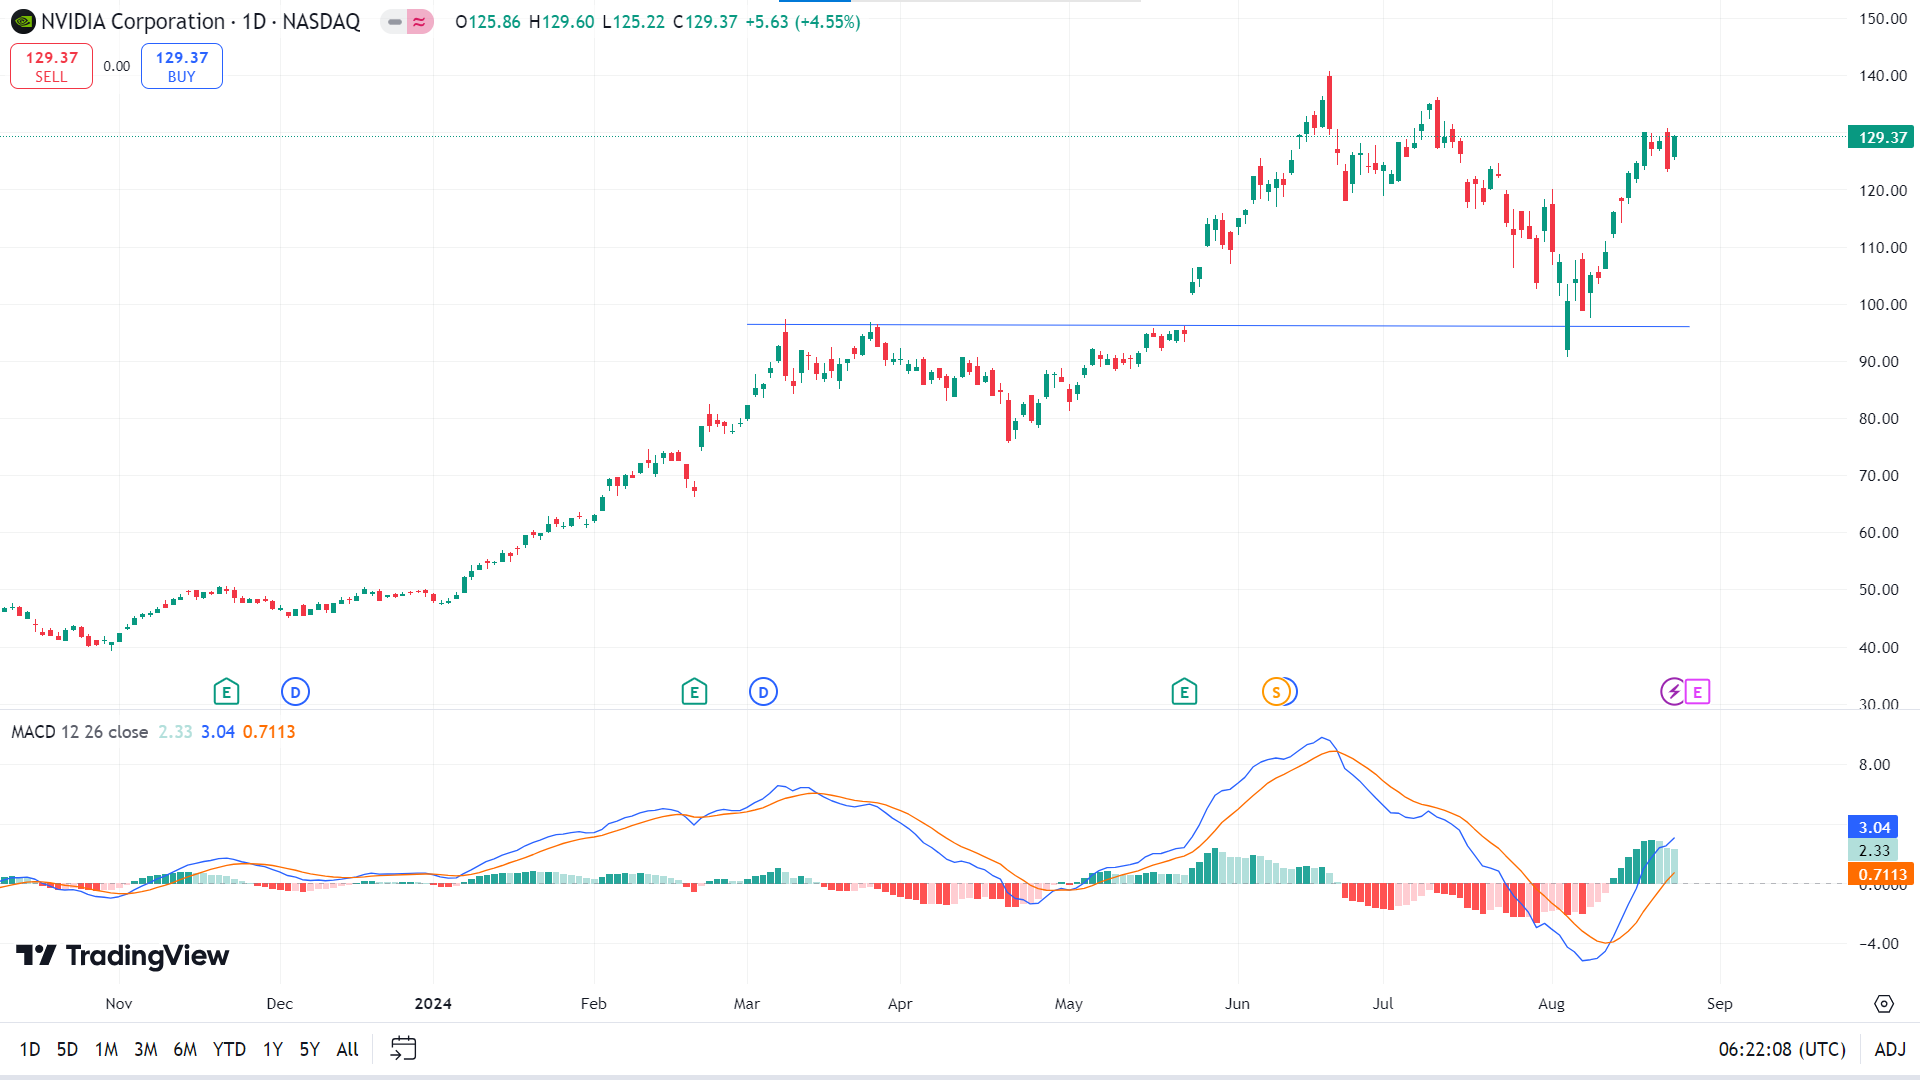
The price is currently on an uptrend, as the MACD indicator window shows through the dynamic signal line hovering above the midline, edging upside, and green histogram bars. So, the price may hit the nearest resistance of 135.28, followed by the next resistance near 140.76.
On the negative side, as the fading green histogram bars reflect dimming bullish pressure, the price can retrace back to the primary support near 118.51, followed by the next support near 105.73.
WTI Crude Oil (USOUSD)
Fundamental Perspective
West Texas Intermediate (WTI) US crude oil prices remain under pressure, and the company is unable to extend the previous day's rebound from a two-week low around mid-$71.00s. Trading near $72.75 during the Asian session on Friday, the commodity has shown little movement and is poised for steep weekly losses amid growing concerns about weakening demand.
The downward revision of US employment figures, which reduced the number of jobs added through March, has stoked fears of a looming recession in the world's largest oil-consuming nation. These concerns are compounded by persistent worries over an economic slowdown in China, the leading global oil importer. Additionally, the potential for a ceasefire in Gaza is also restraining any upward momentum in oil prices. US officials have suggested that an agreement between Israel and Hamas is close, easing fears of a broader conflict in the Middle East and possible disruptions to oil supplies.
Despite these challenges, a significant drawdown in US crude inventories and expectations of an imminent interest rate cut by the Federal Reserve could limit further losses, supporting oil prices.
Technical Perspective
On the weekly chart, the last candle closed as a hammer with a red body and lower wick after a solid red candle, leaving buyers optimistic for the next week.
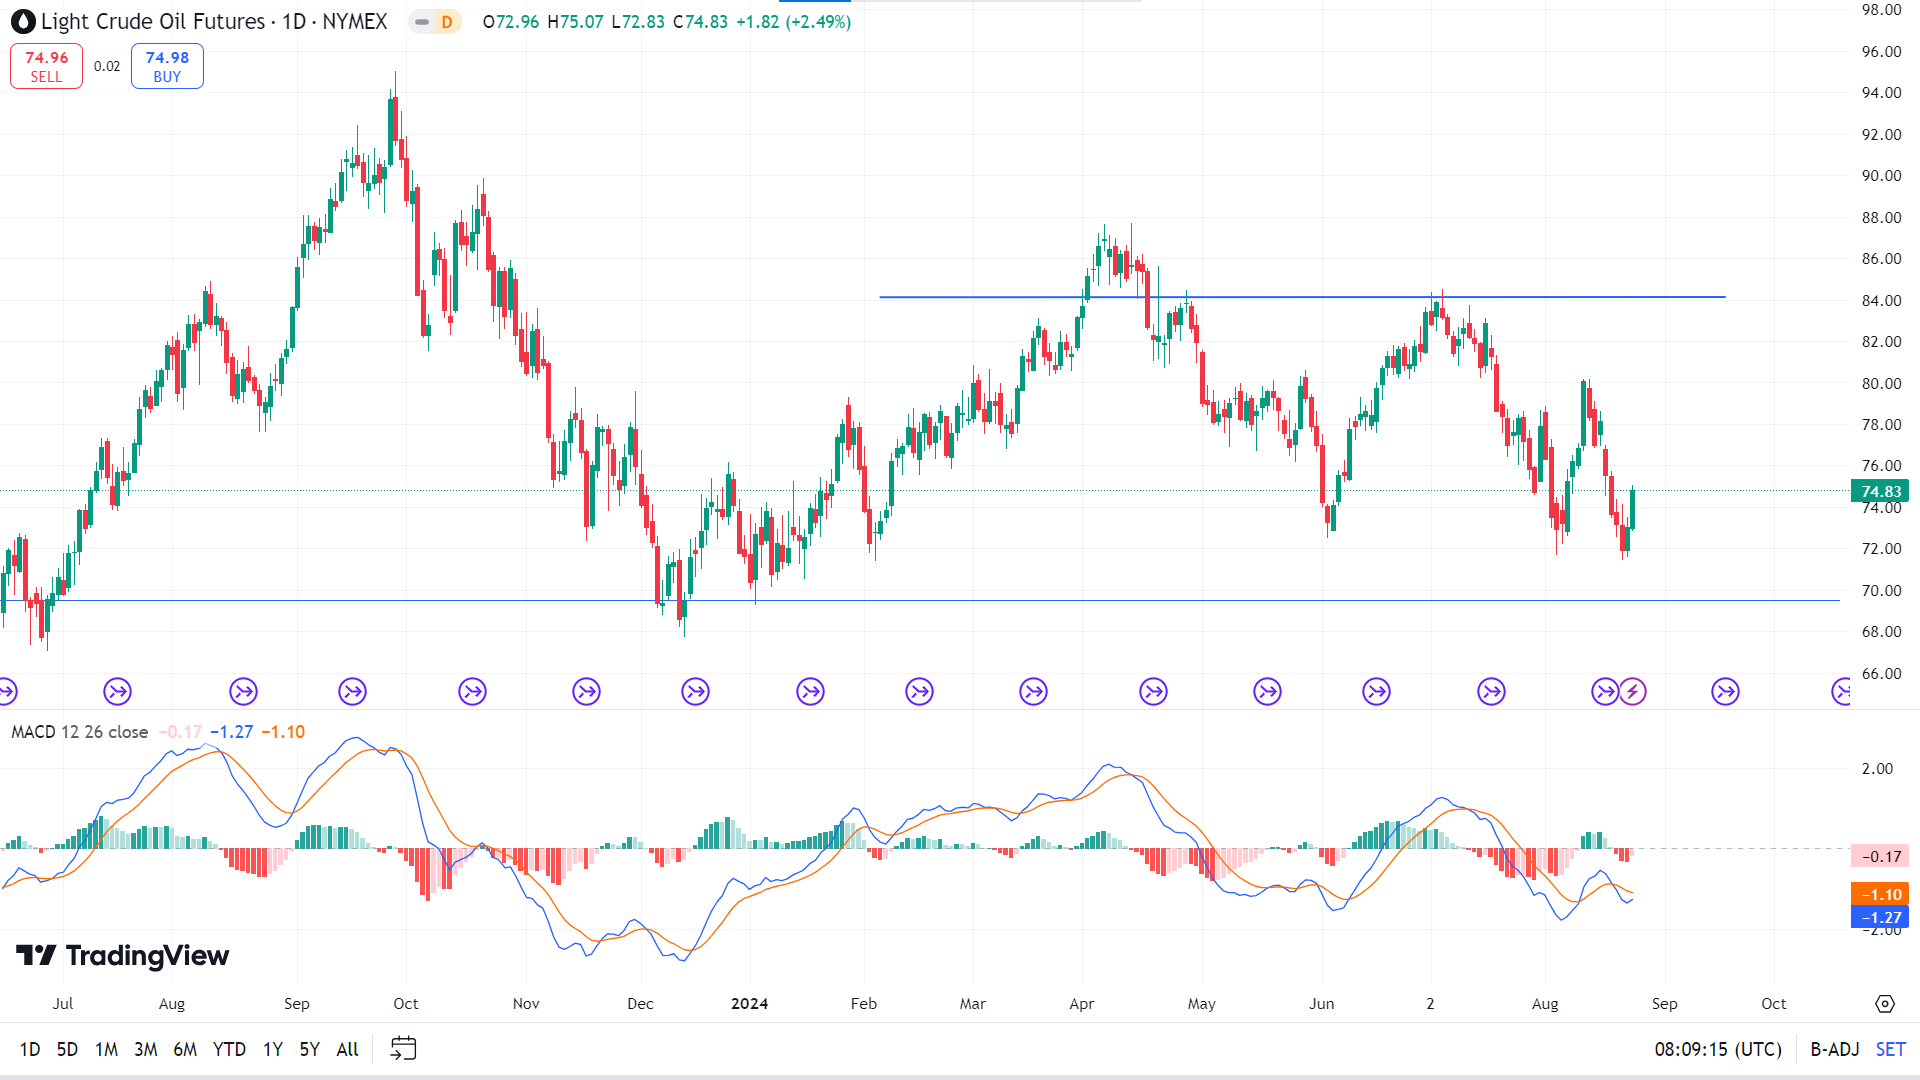
The price is on a bearish trend on the daily chart, as the dynamic signal lines are below the midline of the MACD window and red histogram bars. So, the price may decline at the primary support 71.86, followed by the next support near 69.50.
On the other hand, the fading red bars below the midline on the MACD indicator window reveal bears may lose power. If the dynamic signal lines of the indicator window continue to edge upside, the price can bounce back toward the nearest resistance near 80.06, followed by the next resistance near 84.12.


