


EURUSD
Fundamental Perspective
The EURUSD pair saw a notable rise as market optimism surged following softer-than-expected U.S. inflation data. In July, the U.S. Producer Price Index (PPI) increased by 2.2% year-over-year and 0.1% month-over-month, both figures coming in below forecasts and the previous month’s results. The core PPI also rose by a lower-than-expected 2.4% annually, leading to speculation that the Federal Reserve might initiate a loosening of monetary policy as early as September. This prospect caused a significant dip in the USD as traders adjusted their expectations.
Despite the initial optimism, the USD managed to recover some of its intraday losses, even as the July U.S. Consumer Price Index (CPI) showed a slight decrease in inflation. The CPI rose 2.9% annually, down from June’s 3%, with the core CPI at 3.2%, slightly below the previous month. While the data fueled speculation about a potential rate cut, the market remained divided on whether the Fed would opt for a 25 or 50-basis point reduction, with economic growth now playing a crucial role in the decision.
In contrast, Europe faces a more challenging economic environment. Investors expect the European Central Bank may continue cutting rates due to stubborn inflation, but recession concerns are growing, particularly in Germany, where economic sentiment has deteriorated significantly.
Technical Perspective
On the weekly chart, the last candle closed solid green after a small inverted hammer candle with a small red body, indicating a continuation of the previous uptrend, leaving optimism for buyers for the next week.
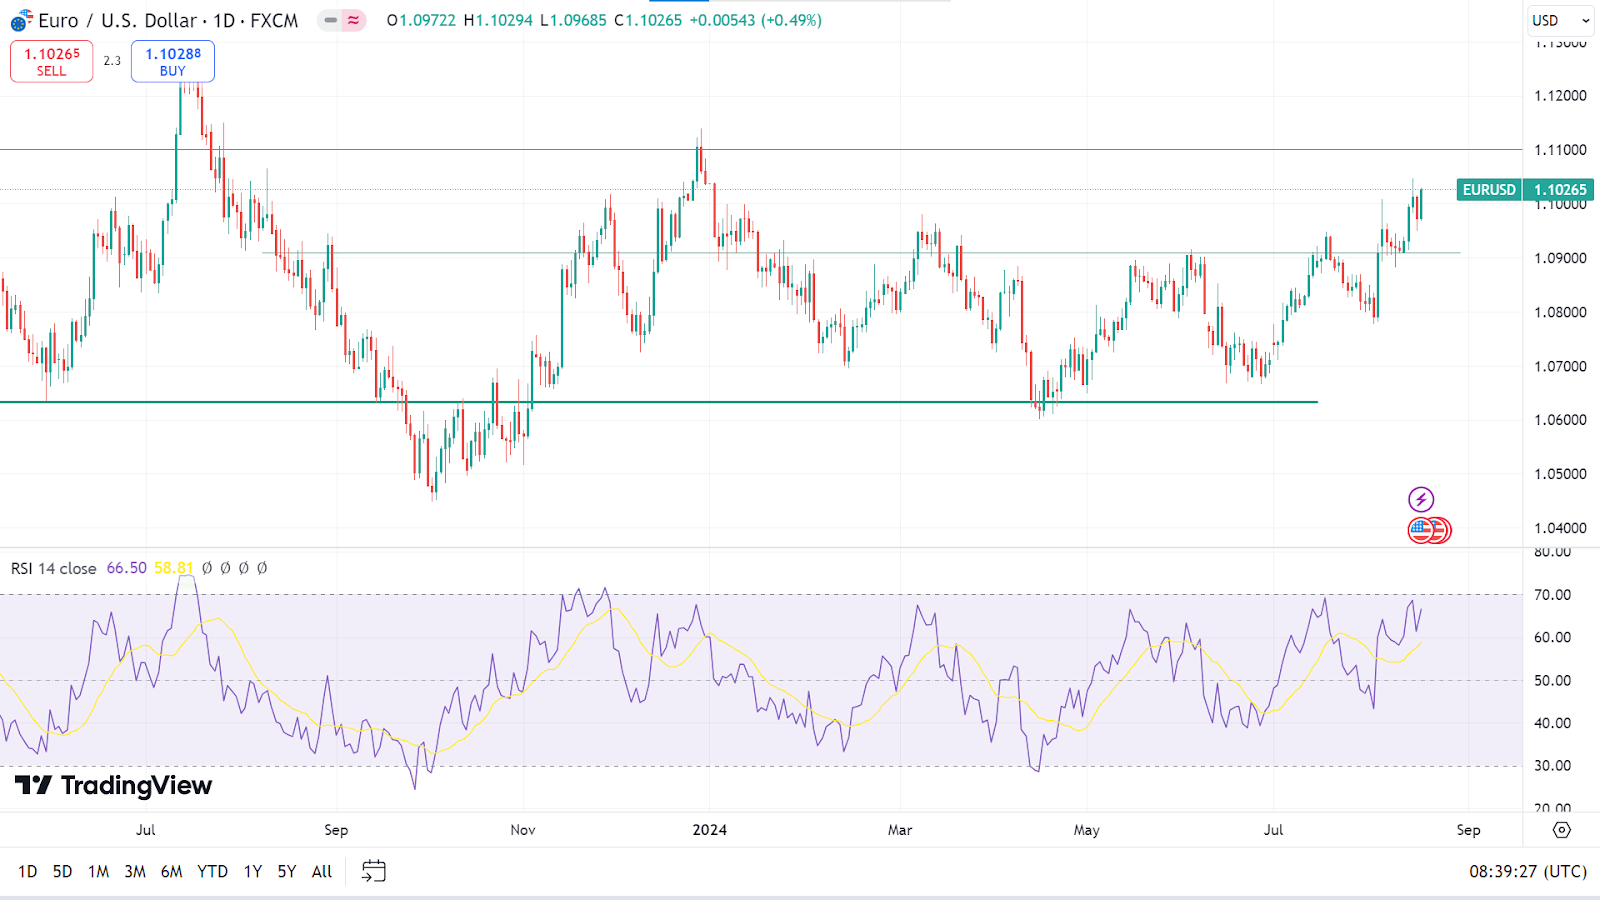
The RSI indicator window confirms the current bullish pressure on the asset price on the daily chart. The signal line edges upwards just below the indicator window's upper line, indicating the price may hit the primary resistance near 1.1100. Also, a breakout can trigger the price toward the next resistance near 1.1275.
Meanwhile, a pause in the current uptrend may cause the price to decline at the primary support level of 1.0910. If the RSI signal line edges further downside toward the midline of the indicator window, it can hit the next support near 1.0780.
GBPJPY
Fundamental Perspective
The Pound Sterling (GBP) strengthened against major currencies, driven by positive UK Retail Sales data from the Office for National Statistics (ONS). Retail Sales rebounded in July with a 0.5% monthly increase and a 1.4% rise year-over-year, following a sharp decline in June. Strong sales at department and sports equipment stores, likely fueled by summer discounts and events like the European Football Championship, contributed to the growth, although demand for automotive fuel decreased.
This robust consumer spending data could influence the Bank of England’s (BoE) upcoming monetary policy decisions. With inflationary pressures potentially rising, the likelihood of another interest-rate cut in September may diminish. The BoE's initial rate cut in early August was already a close decision, with a 5-4 vote split among policymakers.
On the other hand, the Japanese Yen (JPY) recovered some ground against the GBP, buoyed by Japan's stronger-than-expected second-quarter GDP growth, which has increased speculation about a potential rate hike by the Bank of Japan (BoJ). However, the Yen may face challenges due to political uncertainty, as reports suggest Prime Minister Fumio Kishida might not seek re-election, raising concerns about Japan’s political stability.
Technical Perspective
The last weekly candle closed solid green after a hammer with a long lower wick and a small red body, indicating dimming bearish pressure and fresh, positive force on the asset price, leaving optimism for buyers for the next week.
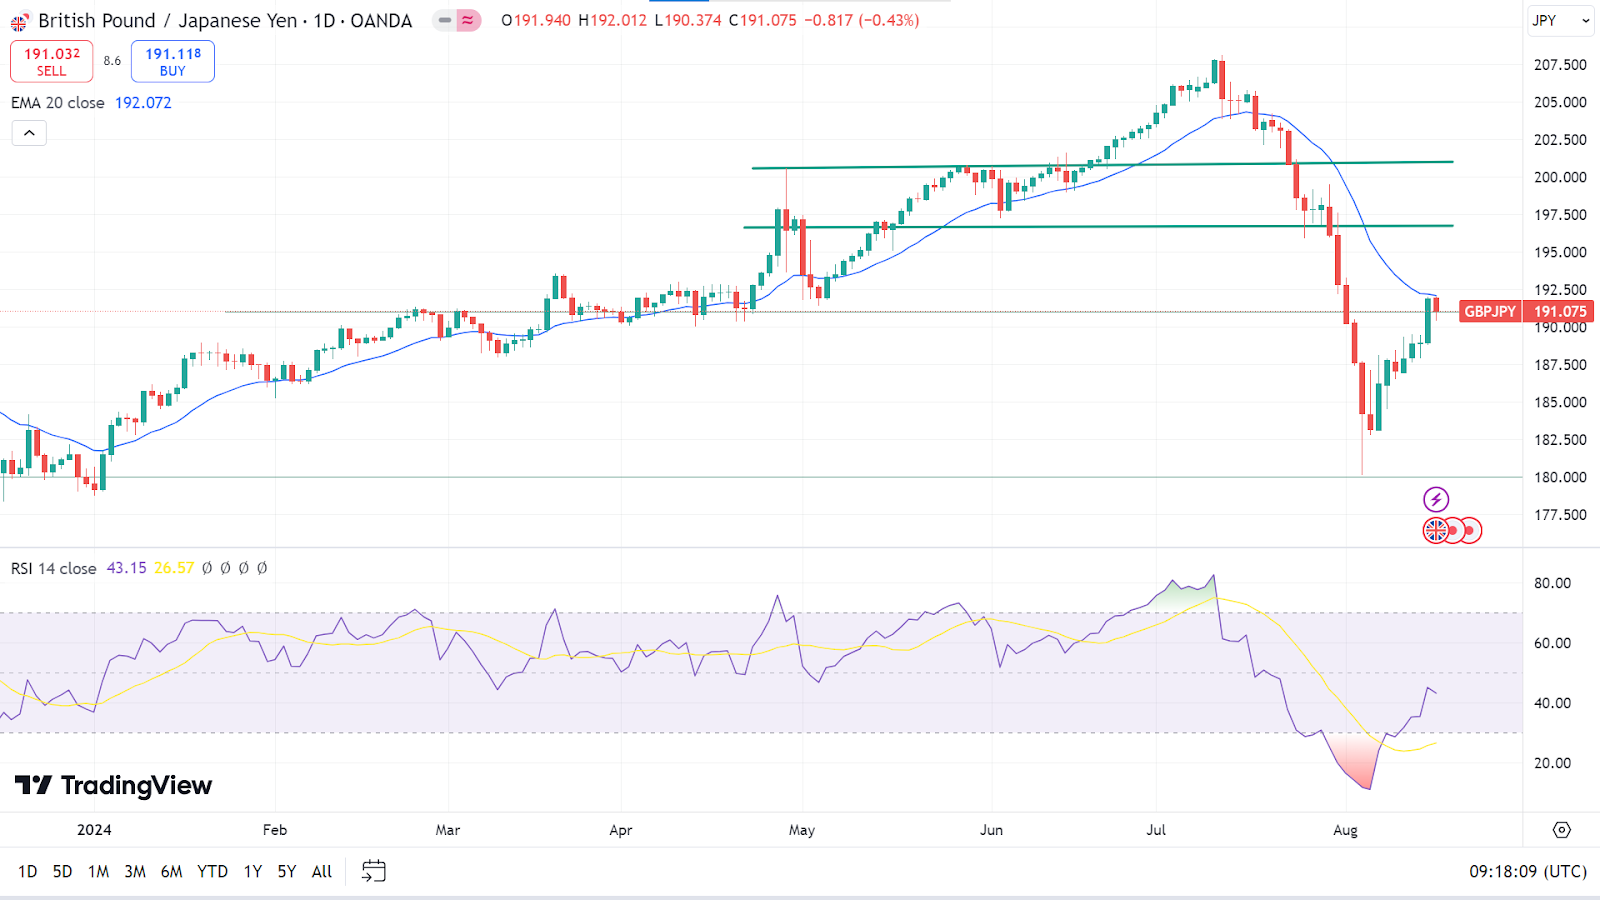
On the daily chart, the price floats just below the EMA 20 line, while the RSI indicator window signals bullish pressure as the signal line edges upward toward the midline. If the price exceeds the EMA 20 line, it can hit the primary resistance of 196.60, followed by the next resistance near 200.55.
However, if the price remains below the EMA 20 line and the RSI signal line starts to slope downward, it can hit the nearest support of 188.20, followed by the next support near 183.01.
Nasdaq 100 (NAS100)
Fundamental Perspective
U.S. stocks bounced back from early losses on Friday, with the Dow Jones Industrials and S&P 500 hitting two-week highs, and the Nasdaq 100 jumped to a three-week high. The rebound was fueled by short covering after the University of Michigan's August consumer sentiment index exceeded expectations.
Falling Treasury note yields, influenced by weaker-than-expected U.S. housing data and dovish remarks from Federal Reserve officials, provided additional support for stocks. Chicago Fed President Goolsbee highlighted concerns about the U.S. labor market and economic indicators, noting that rising unemployment is a significant risk. His comments suggest he may advocate for a rate cut at the upcoming FOMC meeting on September 17-18.
Technical Perspective
The weekly candle closed solid green, posting two consecutive gaining weeks, leaving optimism for bulls for this week.
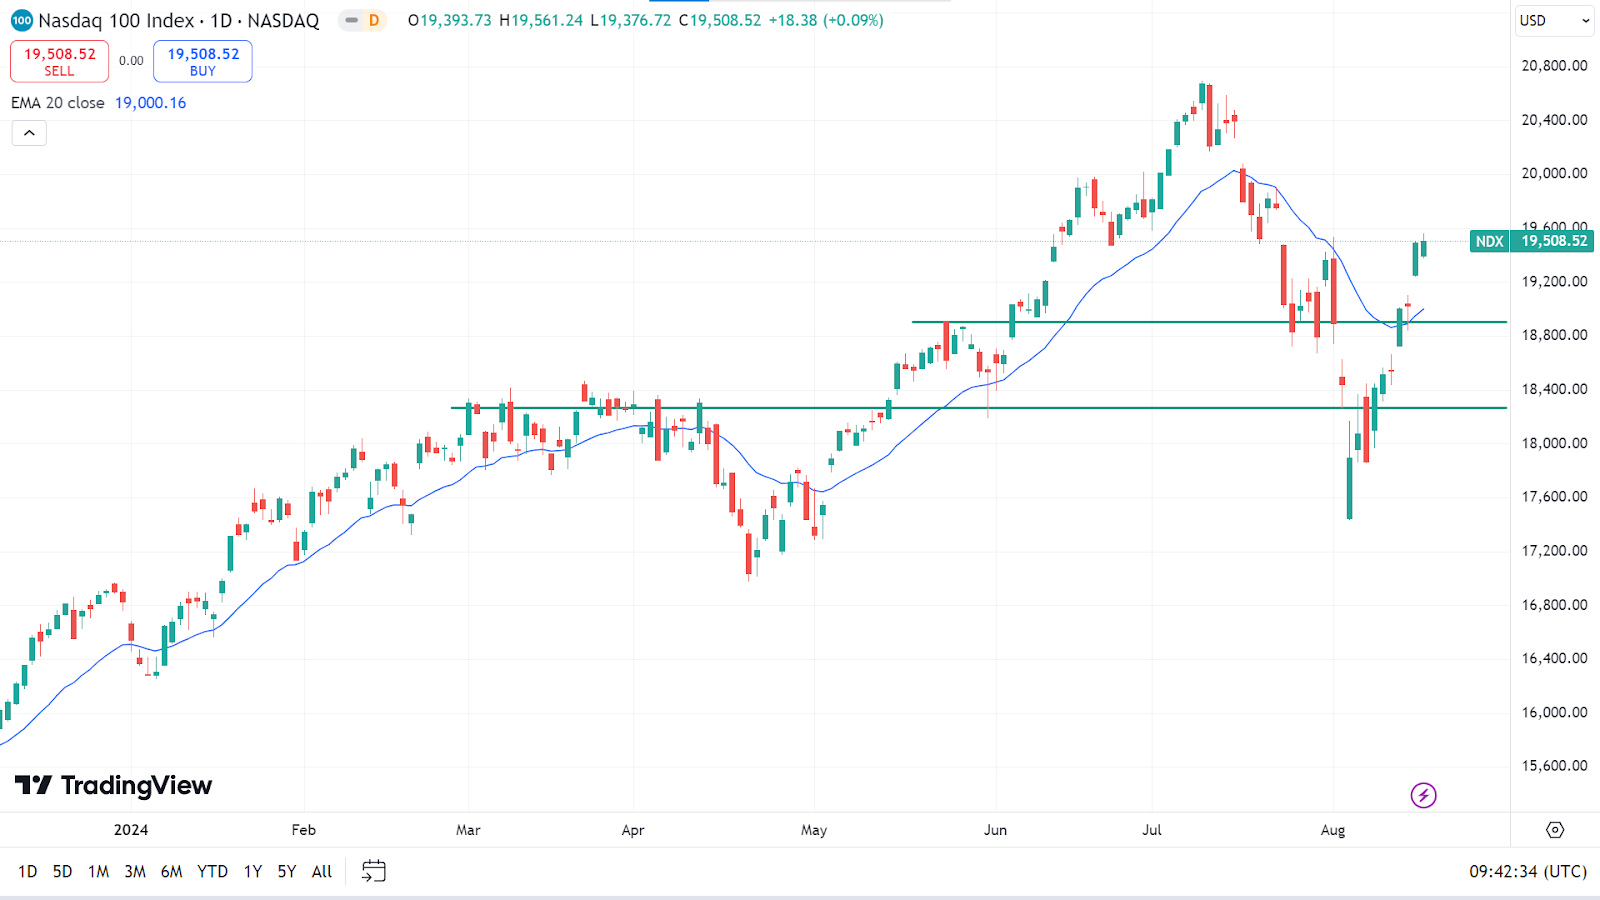
The price floats above the EMA 20 line on the daily chart, signaling bullish pressure on the asset price. So, the price may head toward the nearest resistance of 19,993.83, followed by the next resistance near 20,594.04.
On the other hand, any pause on the current uptrend may guide the price toward the primary support of 18907.54, and if the price remains below the EMA 20 line, it can hit the next support near 18270.00.
S&P 500 (SPX500)
Fundamental Perspective
On last Friday, U.S. stocks initially faced moderate losses, pressured by weak housing data and disappointing corporate news. July housing starts fell by 6.8% month-over-month to a four-year low of 1.238 million, missing expectations of 1.333 million. Similarly, building permits, a key indicator of future construction, declined by 4.0% to 1.396 million, a four-year low and below forecasts of 1.425 million. These figures added to concerns about the housing market’s health.
Negative corporate earnings further weighed on the market. Applied Materials dropped more than 2% after issuing a disappointing Q4 sales forecast, leading chip stocks lower. Amcor Plc also fell over 3% following weaker-than-expected Q4 net sales.
Despite these challenges, the market received a boost from the University of Michigan’s August consumer sentiment index, which rose to 67.8, surpassing expectations. Inflation expectations for the next year and the 5-10-year outlook remained unchanged but were slightly above forecasts.
The market anticipates a 25-basis-point rate cut at the September 17-18 FOMC meeting, with a 30% chance of a more significant 50-basis-point reduction.
Technical Perspective
The last weekly candle finished solid green, posting two consecutive gaining weeks, recovering from nearly all losses from previous weeks, leaving optimism for buyers for the next week.
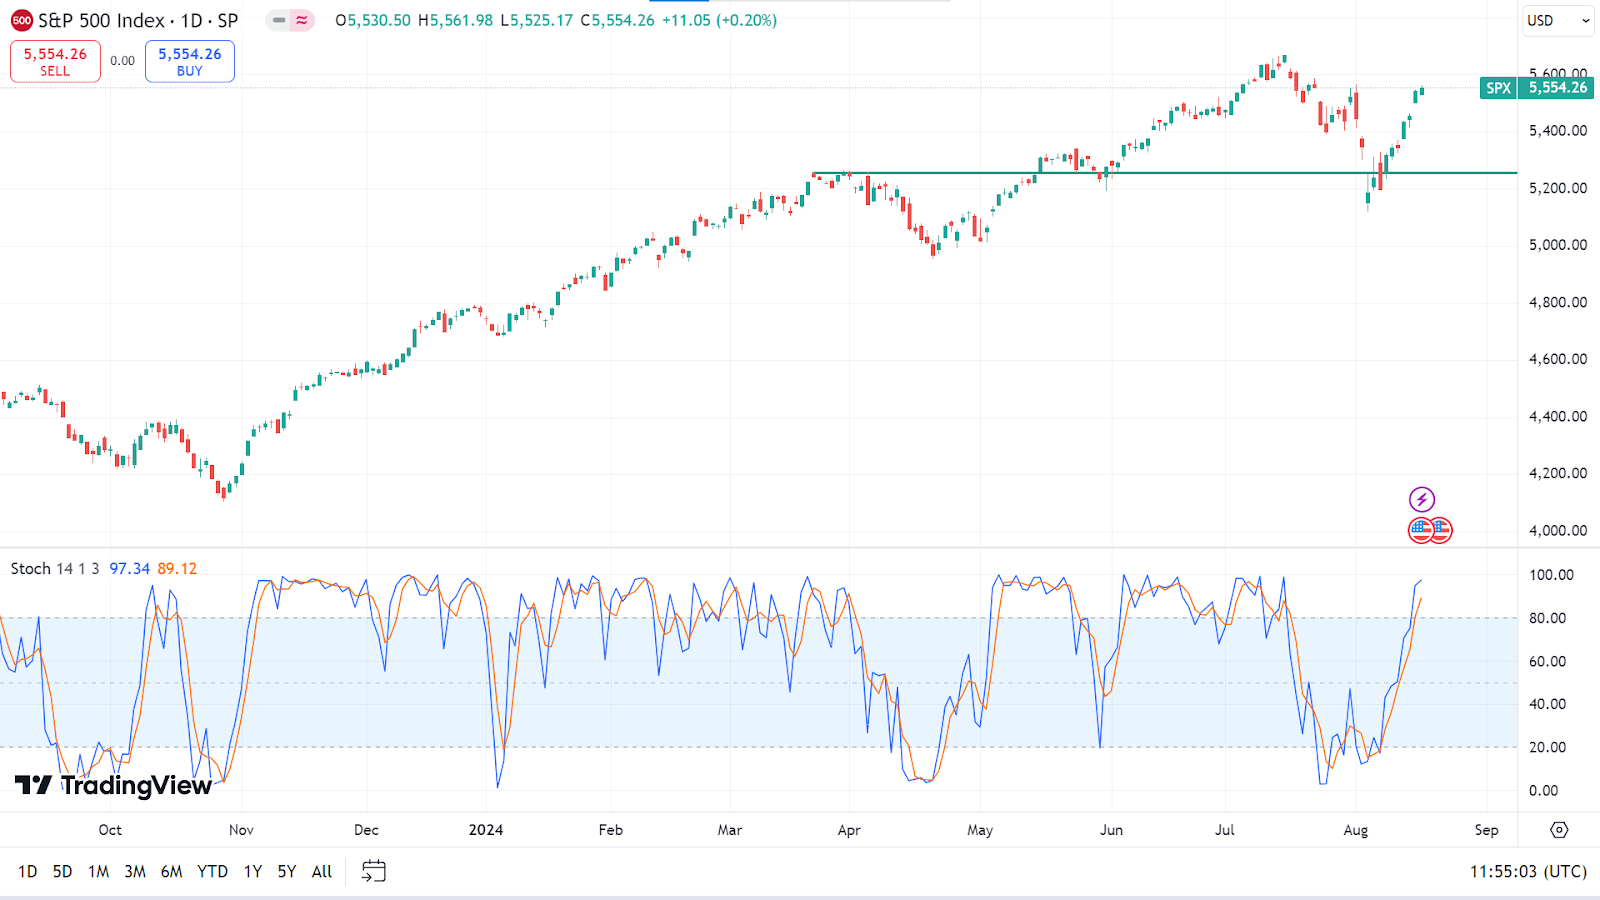
On the daily chart, the price is on an uptrend as the Stochastic indicator window supports through signal lines floating above the upper line of the indicator window. So, the price may head toward the nearest resistance near 5,634.16, followed by the next resistance near 5,806.36.
Meanwhile, signal lines above the upper line on the Stochastic indicator window signal overbought, so investors anticipate a downfall. With significant bearish pressure, the price can decline toward the primary support of 5,420.61, followed by the next support near 5,255.78.
Gold (XAUUSD)
Fundamental Perspective
Gold prices closed at a record high in the previous week, opening a strong bullish opportunity. Thursday’s encouraging U.S. economic data alleviated concerns about a severe economic slowdown, supporting investor confidence and reducing gold's appeal as a safe-haven asset. Nonetheless, escalating geopolitical tensions in the Middle East and anticipation of a Federal Reserve policy-easing cycle continue to support gold.
Markets have already priced in a 25 basis point rate cut for the September FOMC meeting, contributing to a weaker U.S. dollar and lower U.S. Treasury bond yields. This scenario benefits gold, as lower yields and a softer dollar enhance its appeal. Traders shifted to upcoming U.S. data, including Housing Permits, Building Starts, and the Preliminary Michigan Consumer Sentiment Index, for potential short-term trading opportunities. Despite current fluctuations, gold appears set to record modest weekly gains.
Technical Perspective
The last weekly candle closed solid green after a hammer candle with a small red body and long lower wick confirms buyers are back on the asset, indicating the next candle might be another green one.
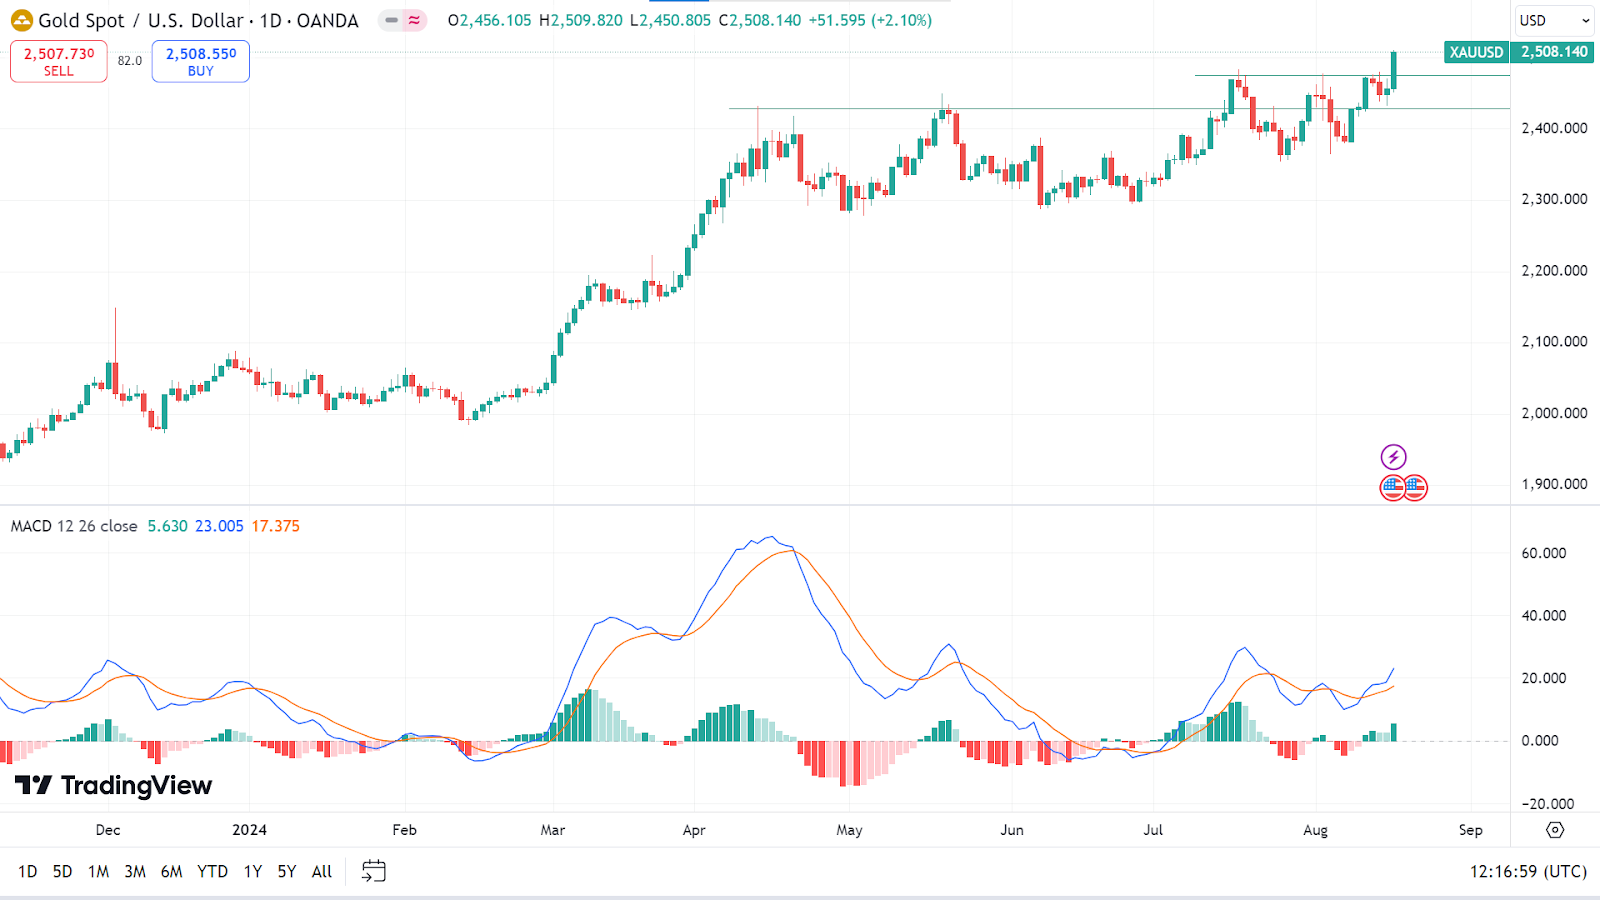
The price is on a bullish trend, as the MACD indicator window shows through the upward-edging signal lines and the green histogram bars above the midline. So, the price may hit the nearest resistance of 2,518.69, followed by the next resistance near 2,581.77.
Meanwhile, if the MACD signal lines start sloping downward and red histogram bars appear below the midline, the price can reach the primary support of 2,475, followed by the next support near 2,430.00.
Bitcoin (BTCUSD)
Fundamental Perspective
Bitcoin (BTC) remained above $58,000 on the weekly close after attempting but, earlier in the week, failed to break the $62,000 resistance level. Despite the positive news, including Marathon Digital adding 4,141 BTC worth $249 million to its holdings and the U.S. SEC approving a leveraged MicroStrategy ETF, Bitcoin has struggled to gain momentum. Fund transfers from Mt. Gox and the U.S. government tempered the market's enthusiasm, creating FUD (Fear, Uncertainty, Doubt) among traders and keeping Bitcoin's price under pressure.
Data from Arkham Intelligence and Lookonchain shows that Marathon Digital’s Bitcoin holdings increased to 19,000 BTC from 15,000 this week, raising the value of its holdings from $891 million to $1.12 billion. Additionally, the SEC’s approval of a leveraged ETF tied to MicroStrategy, a significant Bitcoin holder, could provide investors with more indirect exposure to the cryptocurrency.
However, concerns grew when a U.S. government-linked wallet transferred 10,000 BTC to Coinbase Prime, related to Silk Road Confiscated Funds, unsettling the market. Additionally, movement in Mt. Gox wallets, possibly linked to fund distribution to creditors, added to the uncertainty. These developments suggest a cautious outlook for Bitcoin in the short term.
Technical Perspective
The last weekly candle closed doji with a small green body, two consecutive doji after a solid red candle, signals bulls may be trying to recover from the previous loss, leaving buyers optimistic for the next week.
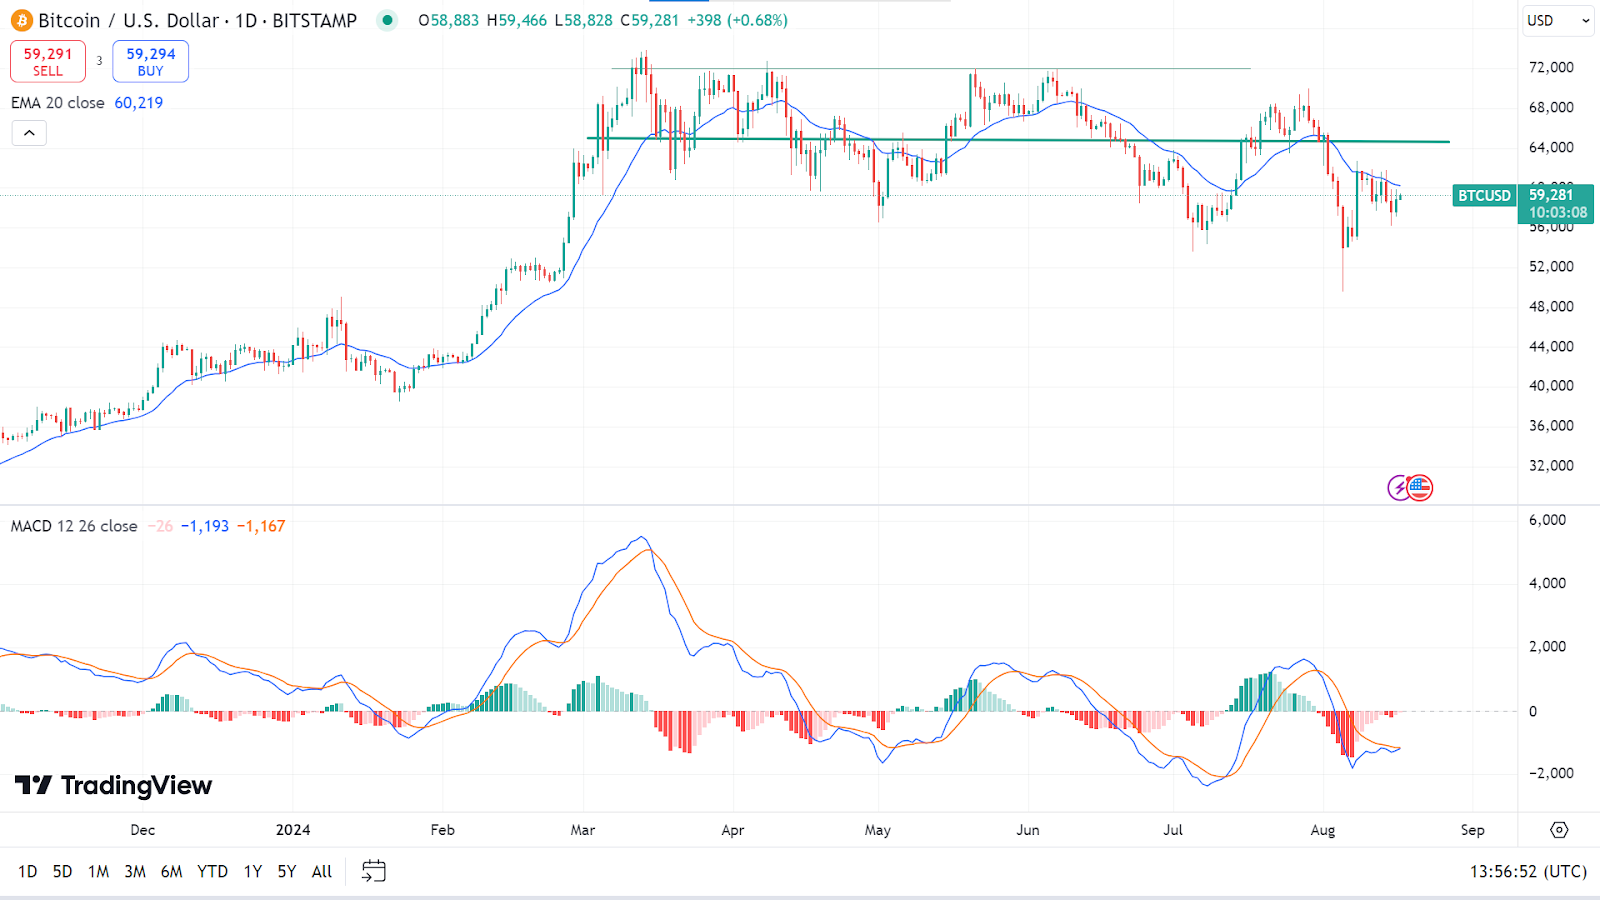
The price is on a downtrend as it floats below the EMA 20 line. In contrast, the red histogram bars and the dynamic signal lines float below the midline on the indicator window, signaling the price may head toward the nearest support of 55,355, followed by the next support near 50,734.
Meanwhile, the histogram bars fade on the MACD indicator window, which means that nearish power may end, and a positive force will appear. If the price exceeds the EMA 20 line, it can hit the primary resistance of 64,598, followed by the next resistance near 69,561.
Ethereum (ETHUSD)
Fundamental Perspective
August began with uncertainty for Ethereum, but recent developments brought steady upward momentum, primarily due to Grayscale's announcement on August 5 of new cryptocurrency trusts for TAO, SUI, and MKR, which sparked optimism among investors, signaling increased institutional interest in crypto, which drove Ethereum’s price up by 30% between August 5 and August 14.
However, this momentum shifted following the release of dovish U.S. CPI data on August 14. The initial optimism waned as investors turned their attention to stock markets, leading to a 6% drop in Ethereum’s price within 24 hours, erasing much of its recent gains. This decline has raised concerns about a potential sharp correction shortly.
The market response indicates increasing bearish pressure on Ethereum, with derivatives markets signaling further risks. The Taker Buy/Sell Ratio, which measures the balance between buy and sell orders, has shown a growing bearish sentiment as sell orders have begun to outpace buy orders. The recent rally might be unsustainable, with Ethereum's price dipping toward $2,500 soon.
Technical Perspective
The last weekly candle was finished with a small green body and upper wick after three consecutive losing weeks, reflecting a pause in the current downward, leaving a mixed signal for the next week.
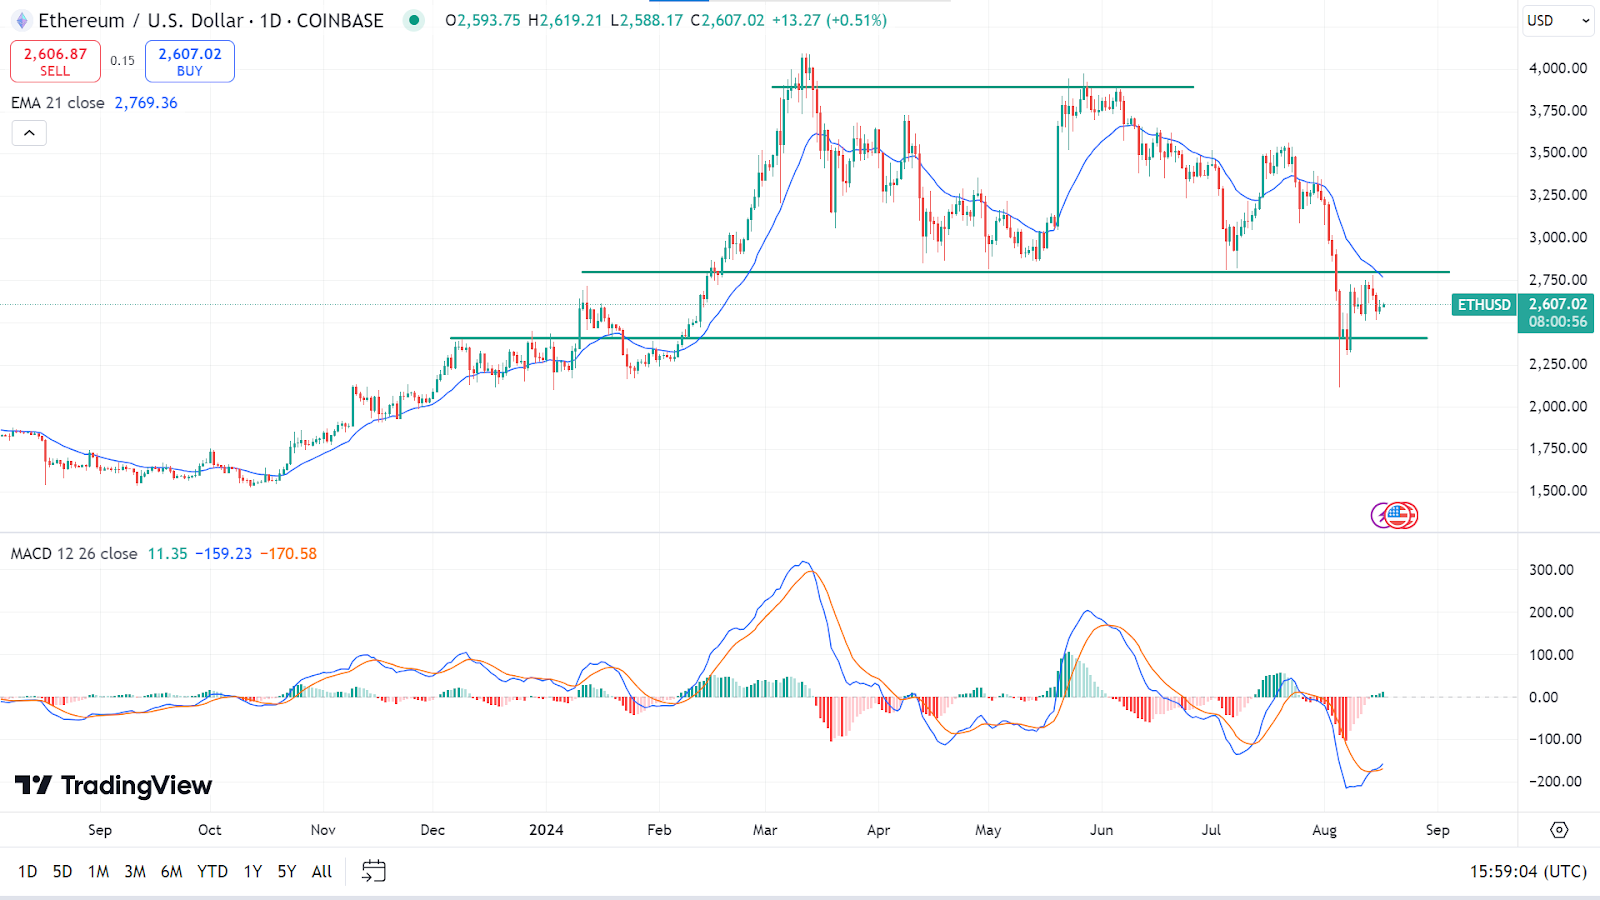
On the daily chart, the price gives a mixed signal as it floats below the EMA 21 line, declaring a bearish force on the asset price; meanwhile, on the MACD indicator window, it shows a fresh bullish pressure through a bullish crossover between the dynamic signal lines and small green histogram bars above the midline on the indicator window. According to the MACD indicator reading, the price may head toward the primary resistance of 2800, and a breakout may trigger the price toward the next resistance near 3198.55, exceeding the EMA 21 line.
In contrast, if the price continues to float below the EMA 21 line and the bullish pressure on the MACD indicator window fades, it may reach the nearest support near 2407.44, followed by the next support near 2146.20.
Tesla Stock (TSLA)
Fundamental Perspective
Tesla's stock has sharply declined, falling 21% since hitting 2024 highs in July and about 13% this year. This downturn followed a 43% drop in second-quarter earnings to 52 cents per share, missing analysts' expectations of 61 cents. Despite a modest 2% revenue increase to $25.5 billion, concerns arose as gross margins slipped to 18%, with auto margins, excluding regulatory credits and leases, matching expectations at 15.1%.
Initially buoyed by a surprise beat in vehicle deliveries, investor sentiment has cooled significantly as the stock fell 13% since the Q2 earnings release. Elon Musk's focus on full self-driving technology remains central, with Tesla's CEO reiterating that those skeptical of Tesla’s autonomy goals should reconsider their investment in the company.
As Tesla continues emphasizing advancements in FSD and AI, investors must weigh these factors against the company's recent financial challenges. Deciding whether to buy or sell Tesla stock involves assessing the company's likelihood of fulfilling its ambitious goals amidst current performance pressures.
Technical Perspective
The last weekly candle finished solid green, representing intense bullish pressure on the asset price, leaving buyers optimistic for the next week.
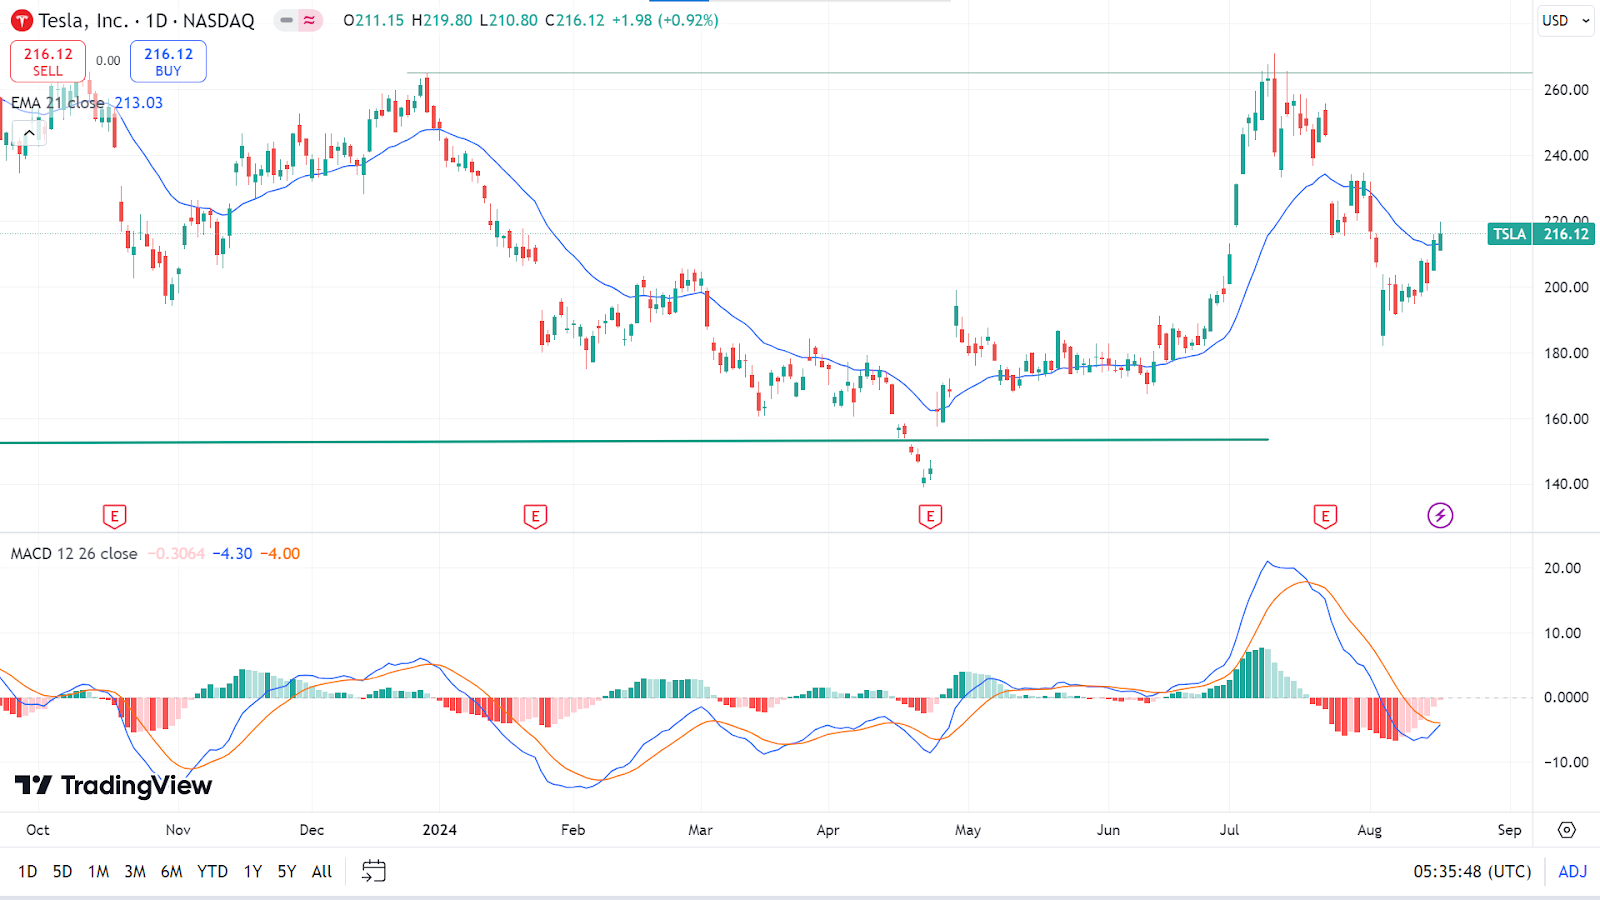
The price reaches above the EMA 21 line, while the MACD window still indicates sell pressure, but red histogram bars are fading, and signal lines come closer, which suggests sellers may lose power. If the price continues above the EMA 21 line, it can hit the nearest resistance of 234.16, followed by the next resistance near 256.28.
Meanwhile, the price drops below the EMA 21 line and the dynamic signal lines on the MACD window continue edging downside beside red histogram bars. In that case, it will indicate the price may decline toward the primary resistance of 198.77, followed by the next support near 184.02.
Nvidia Stock (NVDA)
Fundamental Perspective
The investment community anticipates Nvidia’s upcoming earnings release on August 28, 2024. As per projection, the company will report earnings per share (EPS) of $0.63, reflecting an impressive 133.33% increase compared to last year's quarter. Investors expect revenue to reach $28.24 billion, marking a 109.04% rise from the previous year.
Investors should also monitor recent revisions to analyst forecasts, often reflecting the latest business trends and market sentiment. Positive forecast revisions typically indicate growing optimism about Nvidia's short-term performance.
Currently, Nvidia trades at a Forward P/E ratio of 45.71, significantly higher than the industry average of 23.28, indicating a premium valuation. The company’s PEG ratio also stands at 1.22, suggesting its valuation aligns with its expected earnings growth, which implies a balanced view of Nvidia’s growth prospects. However, the high P/E ratio indicates that investors pay a premium for anticipated future performance.
Technical Perspective
The last weekly candle closed solid green, posting two consecutive gaining weeks, recovering from all previous losing weeks, indicating significant buyer domination on the asset price. The next candle might be another green one.
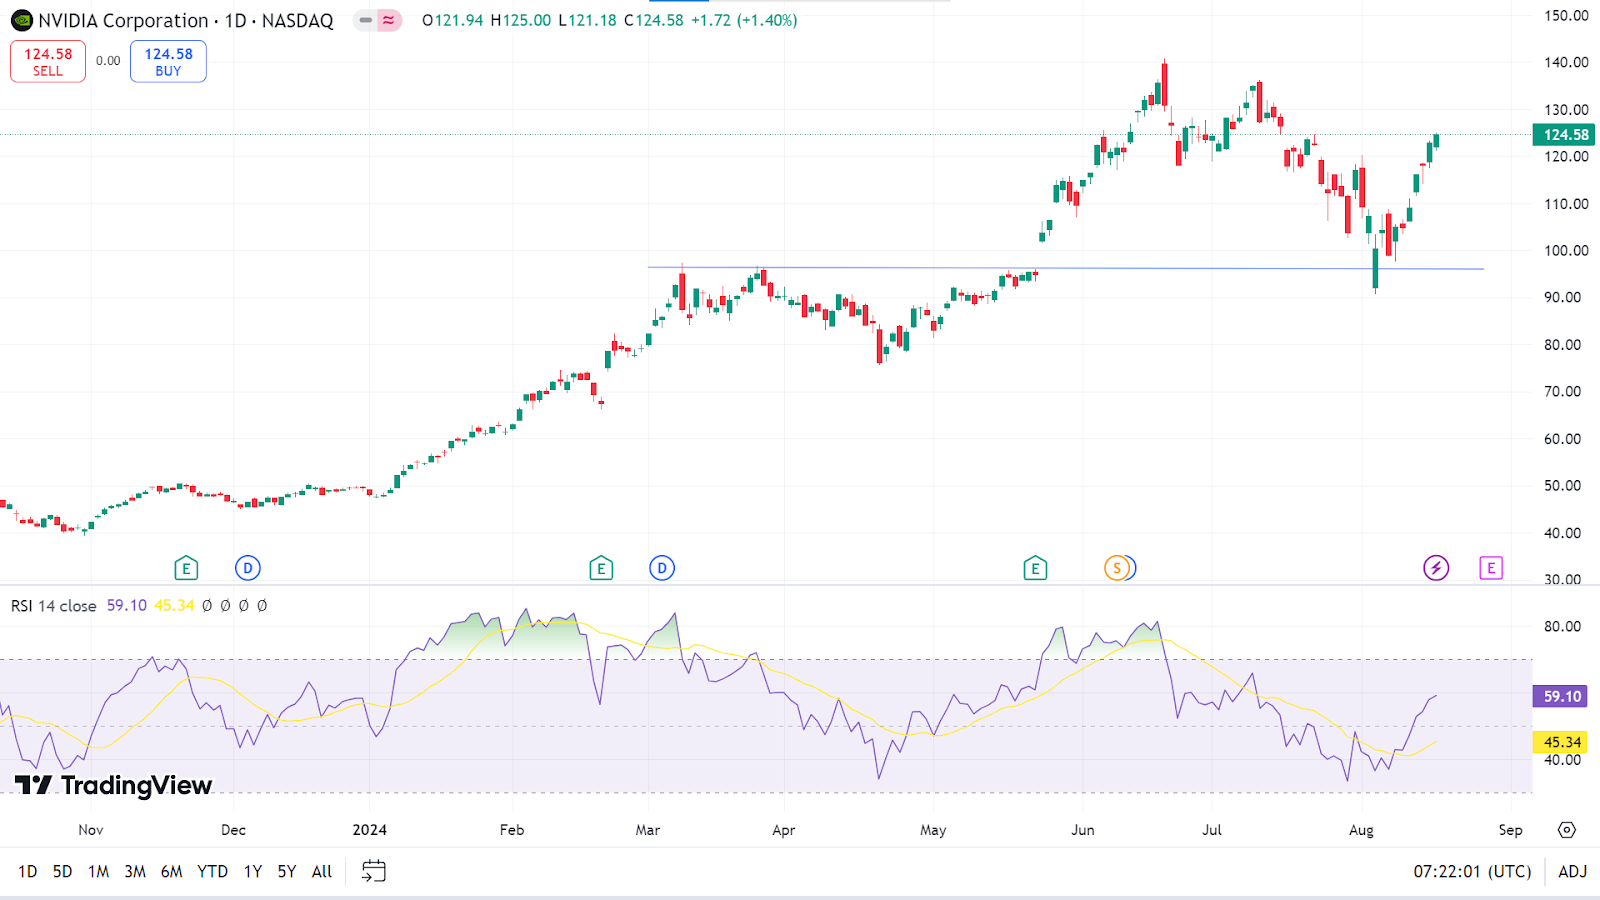
On the daily chart, the price is currently on an uptrend as the RSI signal line edges upward, indicating the price may head toward the nearest resistance of 131.25, followed by the next resistance near 140.07.
At the same time, if the bulls take a break and the RSI signal line edges lower, the price can drop toward the primary support of 114.42, followed by the next support near 102.40.
WTI Crude Oil (USOUSD)
Fundamental Perspective
The latest US Consumer Price Index (CPI) data revealed a July inflation rate of 2.9%, lower than expected and the lowest since March 2021. This decline, primarily driven by rising housing costs while food and energy prices remained stable, has strengthened the likelihood of a Federal Reserve interest rate cut. Earlier in the week, softer-than-expected producer price index (PPI) data further indicated waning inflationary pressures.
Simultaneously, geopolitical tensions have intensified, with Iran signaling possible retaliation against Israel following the killing of a Hamas leader unless a ceasefire in Gaza is achieved. This uncertainty has increased options trading as investors seek protection against potential price surges.
However, concerns over global demand, particularly in China, tempered gains. China's factory output growth slowed in July, and refinery output declined for the fourth consecutive month, reflecting an uneven economic recovery. Due to China's economic slowdown, the International Energy Agency and OPEC have revised their oil demand forecasts downward.
The interplay between potential US rate cuts, geopolitical risks, and global demand concerns will shape oil prices in the coming days, with a heightened focus on developments in the Middle East.
Technical Perspective
The last weekly candle closed as an inverted hammer with a red body, which indicates sellers may take control, leaving sellers optimistic for the next week.
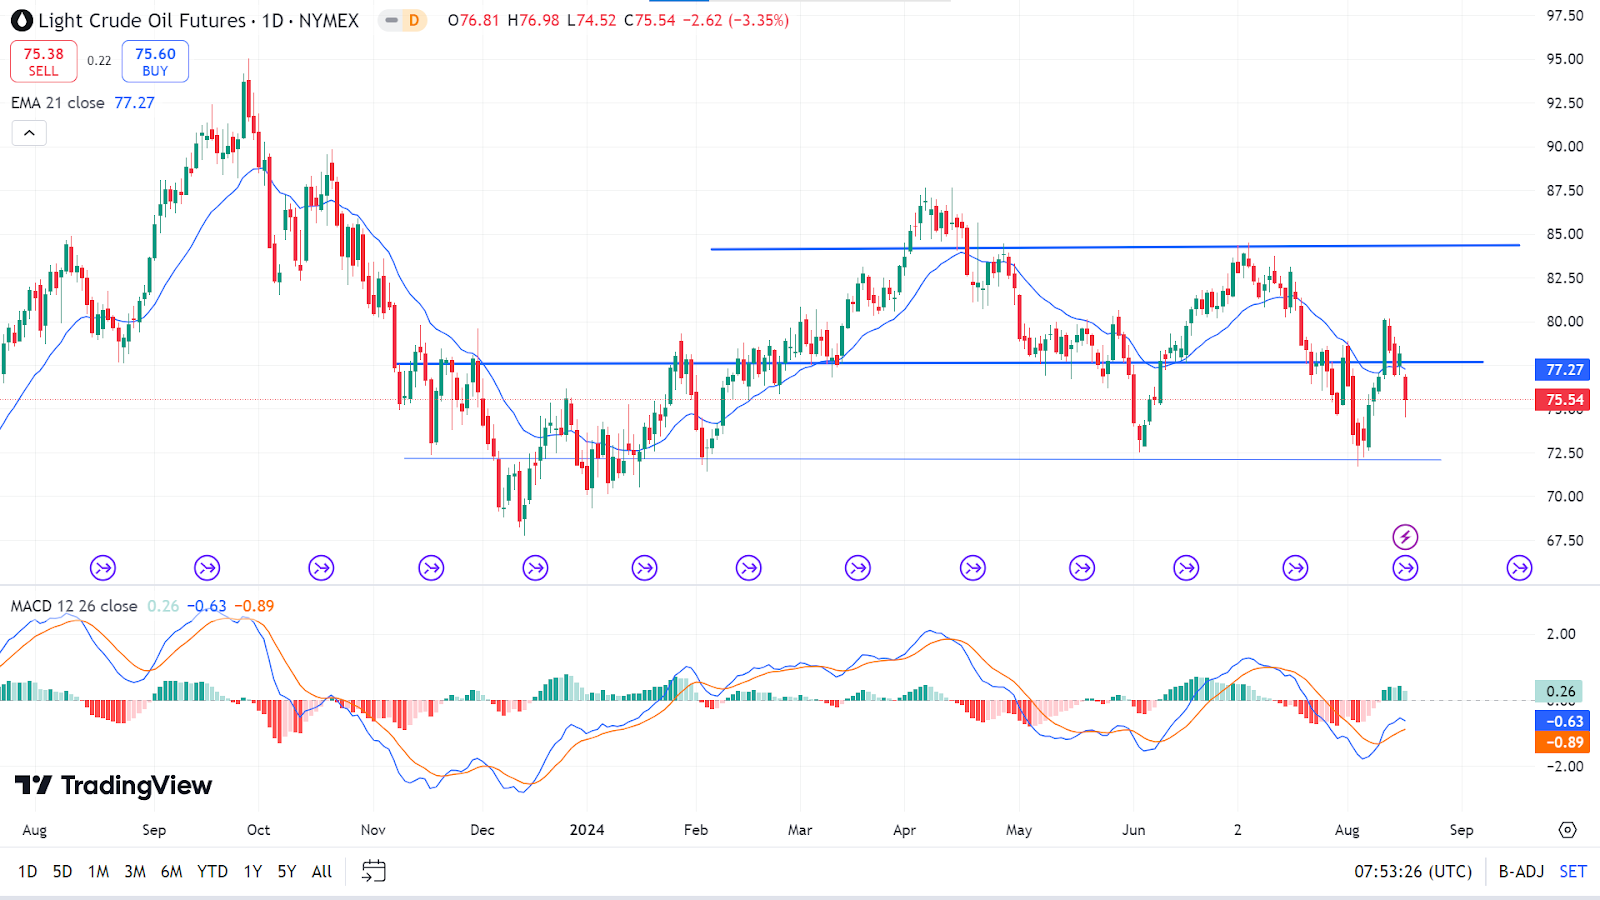
The price floats below the EMA 21 line on the daily chart, indicating bearish pressure, while the MACD indicator window shows bullish activities. So, according to the MACD indicator reading, the price may head toward the primary resistance above the EMA 21 line near 78.58. However, if the bullish trend is sustained, it may hit the next resistance near 80.16.
In the meantime, the histogram bars on the MACD indicator window are fading, suggesting a loss of bullish power; if the price continues below the EMA 21 line, it can decline at the primary support near 73.76, followed by the next support near 71.82.