EURUSD
Fundamental Perspective
The EURUSD pair ended the week slightly above the 1.0900 mark, reflecting a volatile period dominated by investor panic and geopolitical tensions. Early in the week, concerns over a potential US recession were heightened by lackluster economic data, while fears of escalating conflict in the Middle East following an Israeli attack on Iranian territory further unsettled markets. This turmoil led to a sharp drop in the US Dollar, pushing the EURUSD pair to 1.1008, its highest level since January.
Contributing to the uncertainty, the Japanese Yen surged after the Bank of Japan unexpectedly raised interest rates by 15 basis points. Simultaneously, speculation grew that the Federal Reserve might cut rates before its September meeting, especially as other major central banks, including the ECB, BoE, and BoC, had already begun easing monetary policy.
As the week progressed, some calm returned to the markets. US stocks rebounded, and the Dollar regained most of its losses. However, uncertainty persists, with the focus remaining on upcoming economic data and central bank actions, which could quickly unsettle the fragile stability.
Economic data, including the US ISM Services PMI and Jobless Claims, supported the improved sentiment, while key reports from both sides of the Atlantic are awaited.
Technical Perspective
The last weekly candle finished with a small red body and wicks on both sides. In contrast, the extended upper wick confirms significant buy pressure on the asset price, leaving buyers optimistic for the upcoming week.
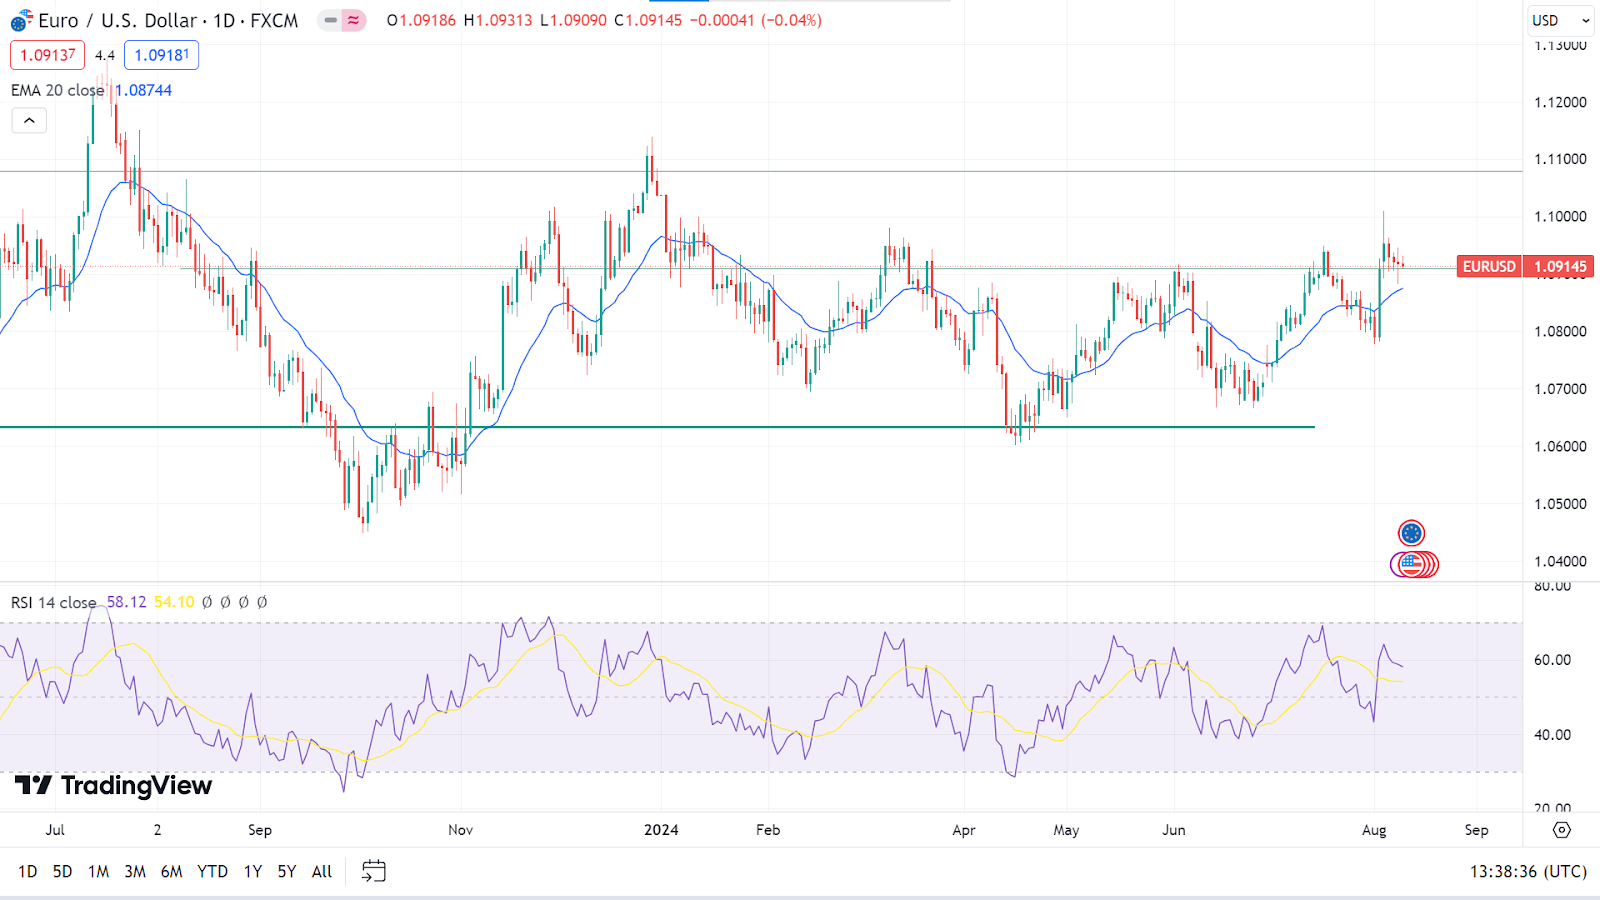
The daily chart's price remains above the EMA 20 line, confirming the recent bullish pressure on the asset price. In contrast, the RSI indicator reading remains neutral above the midline on the indicator window. While the price reaches above the previous resistance of 1.0910 and floats above the EMA 20 line, it can hit the current high of 1.1005, and a breakout may guide the price to the next resistance near 1.1104.
However, on the negative side, if the price reaches below the EMA 20 line and the RSI signal line slopes downward, the price may reach the primary support near 1.0785, followed by the next support near 1.0680.
GBPJPY
Fundamental Perspective
The Japanese Yen (JPY) recovered against the Pound as traders closely examined Japan's monetary policy outlook. While central bank officials have expressed a readiness to raise rates further, they have become more cautious due to increasing market volatility. On Thursday, Japan's Finance Minister, Shunichi Suzuki, emphasized that the Bank of Japan holds the authority over monetary policy decisions. At the same time, the government continues to monitor market developments closely, as reported by Reuters.
On the UK side, a relatively quiet economic calendar provided a brief respite for GBP traders after the Bank of England's recent moves led to a sharp drop in the Pound. With market dynamics stabilizing, attention has shifted to the upcoming Consumer Price Index (CPI) inflation data from the UK and the US.
UK CPI inflation is anticipated to rise to 2.3% year-over-year in July, up from 2.0% previously, while core CPI is expected to dip slightly to 3.4% from 3.5%. Additionally, the UK Gross Domestic Product (GDP) growth figures are set to be released, with Q2 GDP projected to slow down to 0.6% from the previous quarter's 0.7%.
Technical Perspective
The last weekly candle closed as a hammer, with a tiny red body and long lower weeks, posting its fifth consecutive losing week. Still, the long lower wick confirms buyers' domination during the period, reflecting potential reversal and the possibility of the next candle being green.
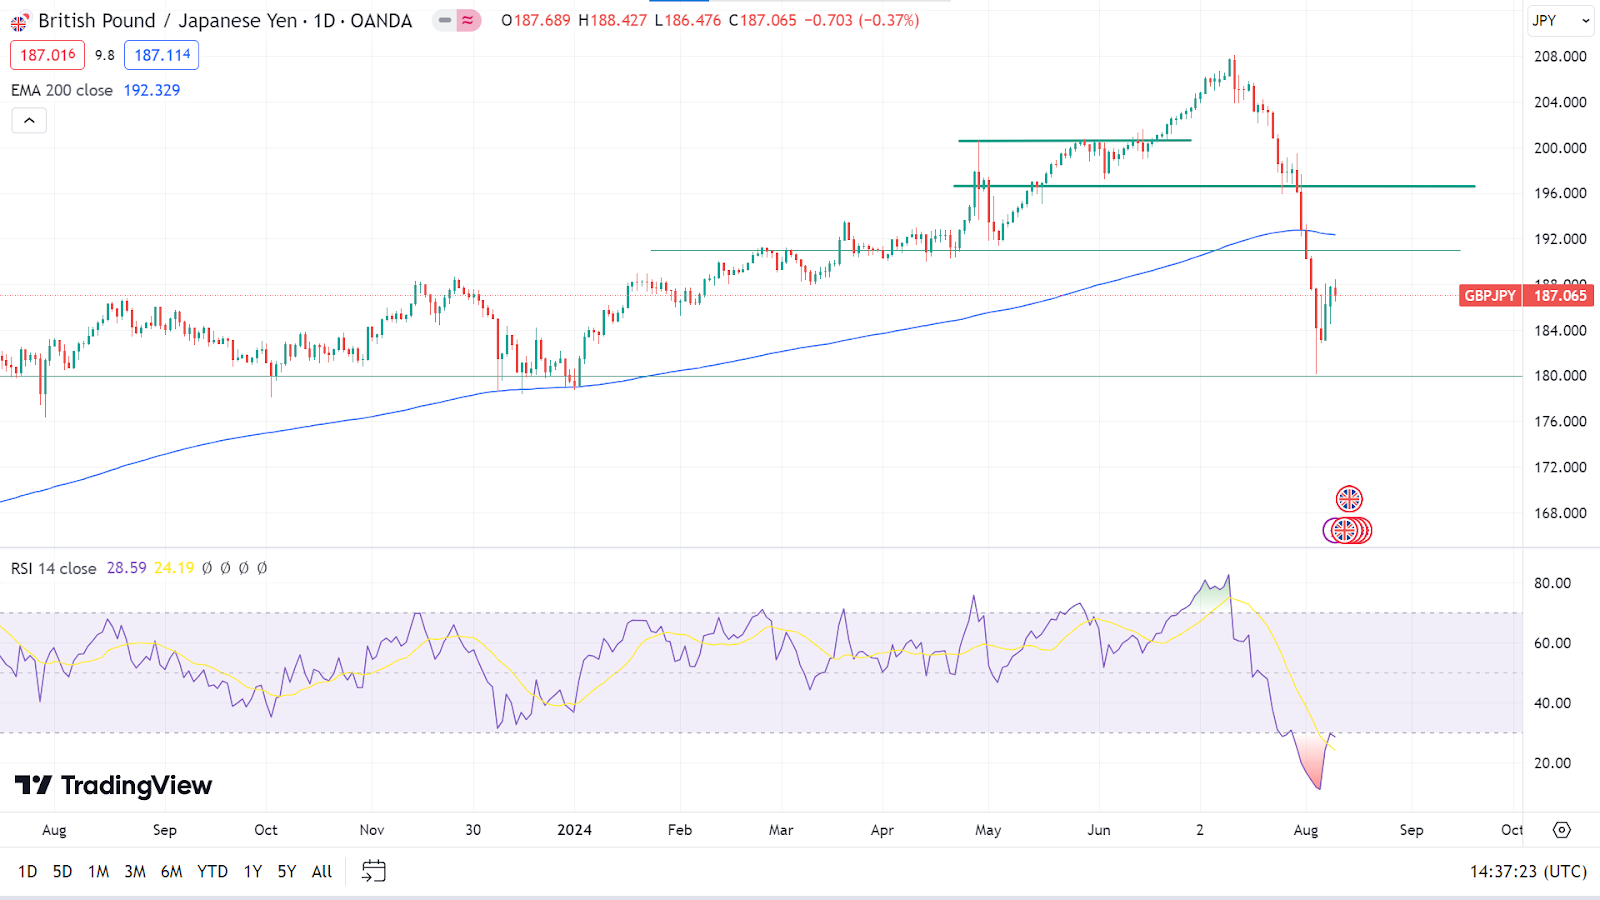
On the daily chart, the price floats below the EMA 200 line, confirming bearish pressure on the asset price when the RSI indicator reading remains neutral and the signal line edges upside on the indicator window. As long as the price remains below the EMA 200 line and the RSI signal line below the lower line of the indicator window, the price may hit the primary support of 183.45, followed by the next support near 180.00.
Meanwhile, if the RSI signal line continues toward the midline of the indicator window, the price can hit the nearest resistance at 190.98, followed by the next resistance near 195.48.
NASDAQ 100 (NAS100)
Fundamental Perspective
Japan and its central bank have been at the forefront of market attention over the past week. On Wednesday, global indices rebounded after Japanese stocks recovered strongly, following remarks from a senior Bank of Japan official who tempered the central bank's hawkish stance from the previous week. The lack of major bearish news and a relatively quiet economic calendar also helped to stabilize risk sentiment, though investors remained cautious.
Rather than rushing to buy the dip, market participants took a measured approach, reassessing recent developments and considering which sectors might be less impacted by the unwinding of carry trades. Some questioned whether the market had overreacted to the Bank of Japan's unexpectedly aggressive policy tightening last week.
Despite the temporary relief, overall sentiment remained guarded. Investors were wary of making significant moves without further evidence that the sell-off had run its course. With the US Consumer Price Index (CPI) data on the horizon, many traders held back, waiting for a clear bullish signal to confirm that the market had reached at least a temporary low.
Technical Perspective
The last weekly candle finished solid green after posting four consecutive losing weeks, reflecting hope for buyers for the next week.
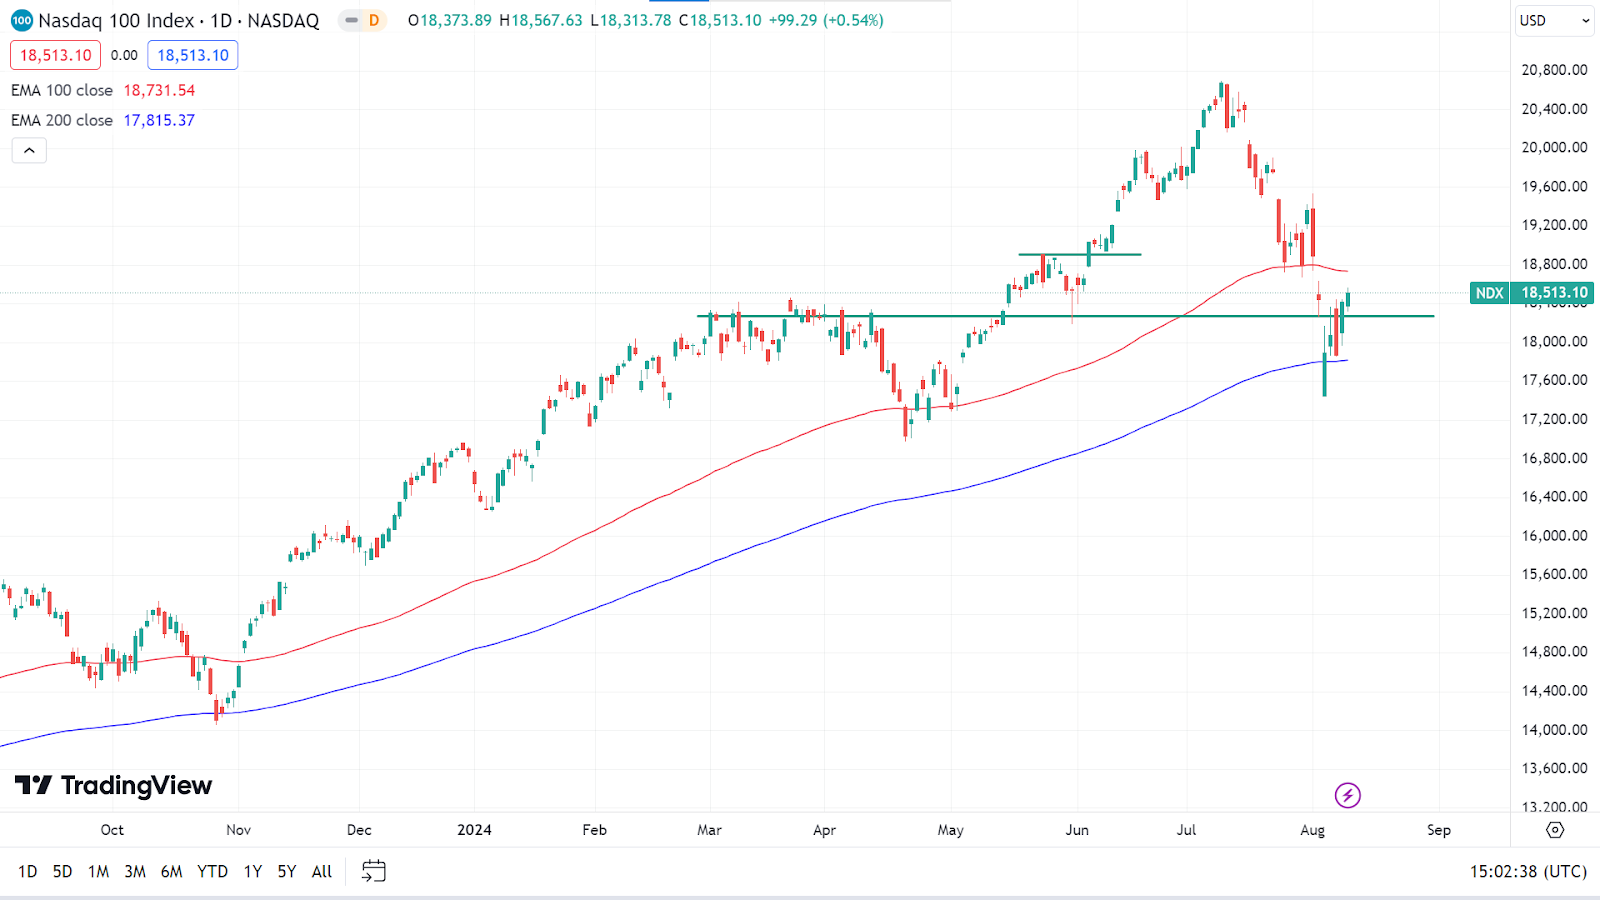
The price floats between the EMA 100 and EMA 200 lines, whereas the EMA 100 line acts as a dynamic resistance and the EMA 200 line acts as a dynamic support. If the price exceeds the EMA 100 line, declaring bullish pressure, it may hit the nearest resistance near 19,198.52, followed by the next resistance near 19,979.93.
Meanwhile, if the price reaches below the EMA 200 line, indicating significant bearish pressure on the asset price, it may get the primary support near 17,606.57, followed by the next support near 17,108.99.
S&P 500 (SPX500)
Fundamental Perspective
The S&P 500 index ended the week at 5,344.16, slightly below the prior week's close of 5,346.56. The index is down 3.2% for the month-to-date but remains up 12% year-to-date. The week was marked by significant daily swings that largely canceled each other out.
The index experienced a sharp 3% drop on Monday, its largest single-day loss since 2022, as recession fears intensified following weaker-than-expected July jobs data. However, it rebounded with a 2.3% gain on Thursday, its biggest one-day increase since 2022, thanks to better-than-expected weekly jobs data.
The materials sector faced the largest decline, falling 1.7%, with Albemarle shares dropping 6.1% due to weak Q2 earnings and reduced guidance. Regarding consumer discretion, Airbnb saw a 10% decline following disappointing earnings. On the positive side, the energy and industrial sectors rose by 1.2%, with Axon Enterprise and ONEOK showing notable gains.
Next week will bring key economic data, including the July producer and consumer price indexes and figures on retail sales, housing starts, and building permits.
Technical Perspective
The last candle on the weekly chart ended solid green after three consecutive losing weeks, leaving buyers optimistic for the upcoming week.
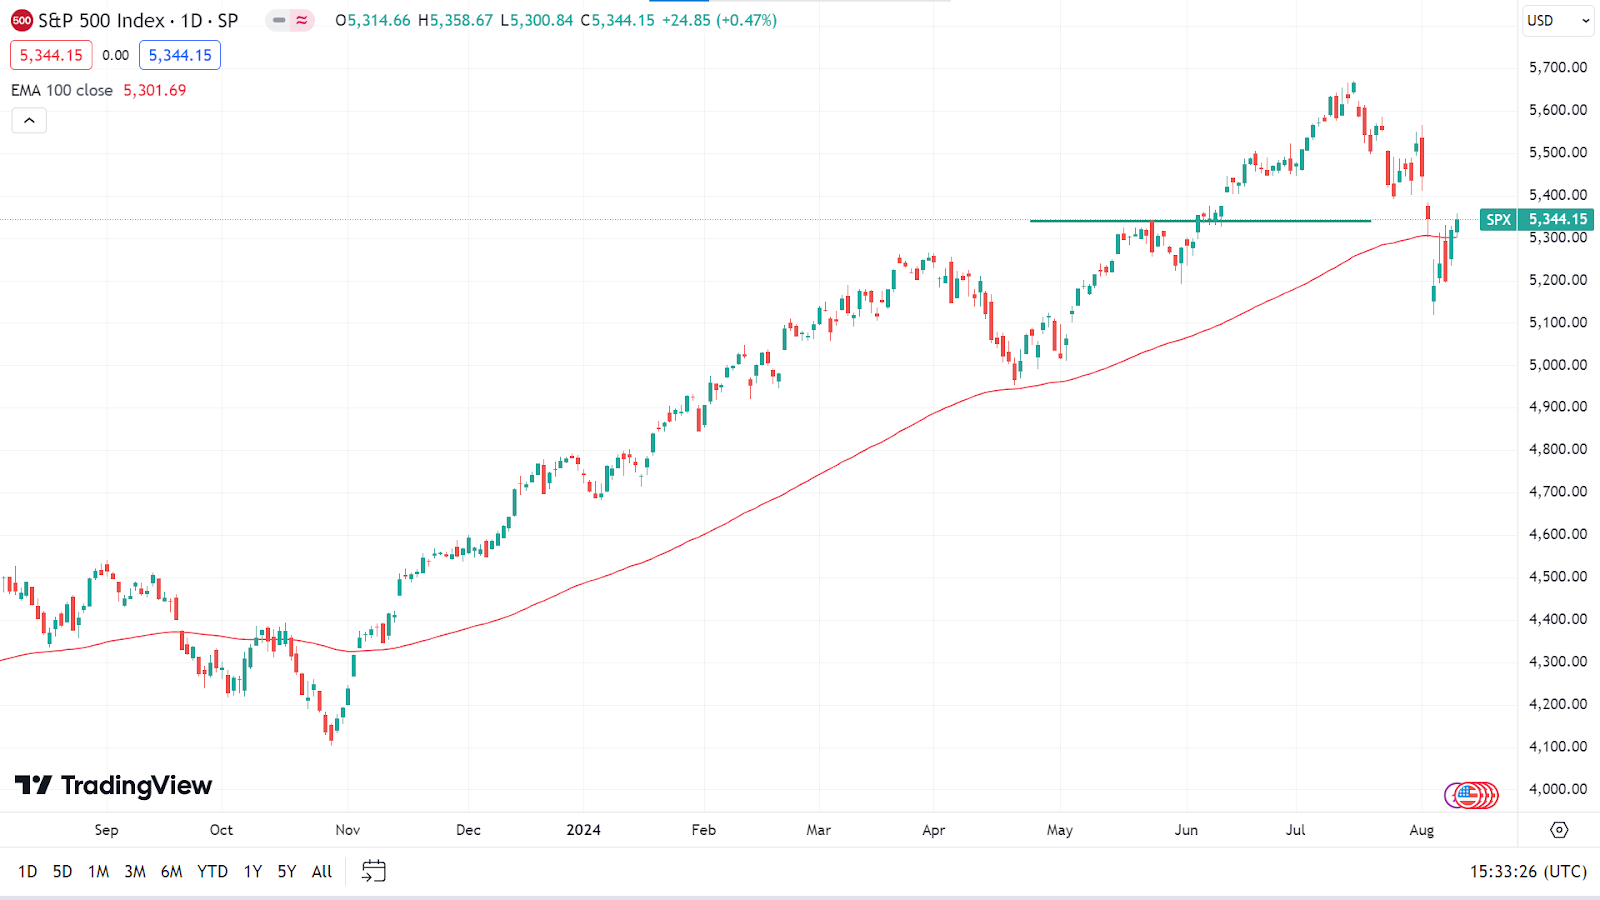
The price exceeds the EMA 100 line, declaring recent bullish pressure on the asset price. If the price remains above the EMA 100 line, it can hit the primary resistance of 5,435.03, followed by the next resistance near 5,566.16.
On the negative side, if the price declines below the EMA 100 line, it can reach the nearest support near 5,200.38, followed by the next support near 5,095.03.
Bitcoin (BTCUSD)
Fundamental Perspective
In 2024, Bitcoin's market shows a significant percentage of UTXOs in loss, similar to the correction seen during the 2020 bull cycle, indicating substantial market stress. Unlike the swift and extensive quantitative easing seen during the COVID-19 pandemic, the current economic climate may not support such immediate policy responses. However, there is a potential for future liquidity support if the Federal Reserve decides to cut interest rates starting in September, given the prolonged market adjustment.
Despite recent market downturns, major institutional investors such as BlackRock, MicroStrategy, Grayscale, and Fidelity have chosen to maintain their Bitcoin holdings, suggesting strong confidence in the cryptocurrency's future. Additionally, the transfer of 404,448 Bitcoins to permanent holder addresses over the past 30 days reflects significant accumulation, indicating that investors perceive recent price dips as temporary and are positioning themselves for long-term gains.
CryptoQuant data also reveals record-high futures trading volume at $154 billion, with spot trading volume reaching $83 billion, reflecting heightened trading activity and continued investor interest amidst market fluctuations. It indicates that, despite short-term volatility, the long-term outlook for Bitcoin remains promising.
Technical Perspective
On the weekly chart, the last candle closed with a green body and wicks on both sides, where the lower wick is long, which indicates the upcoming candle might be another green one.
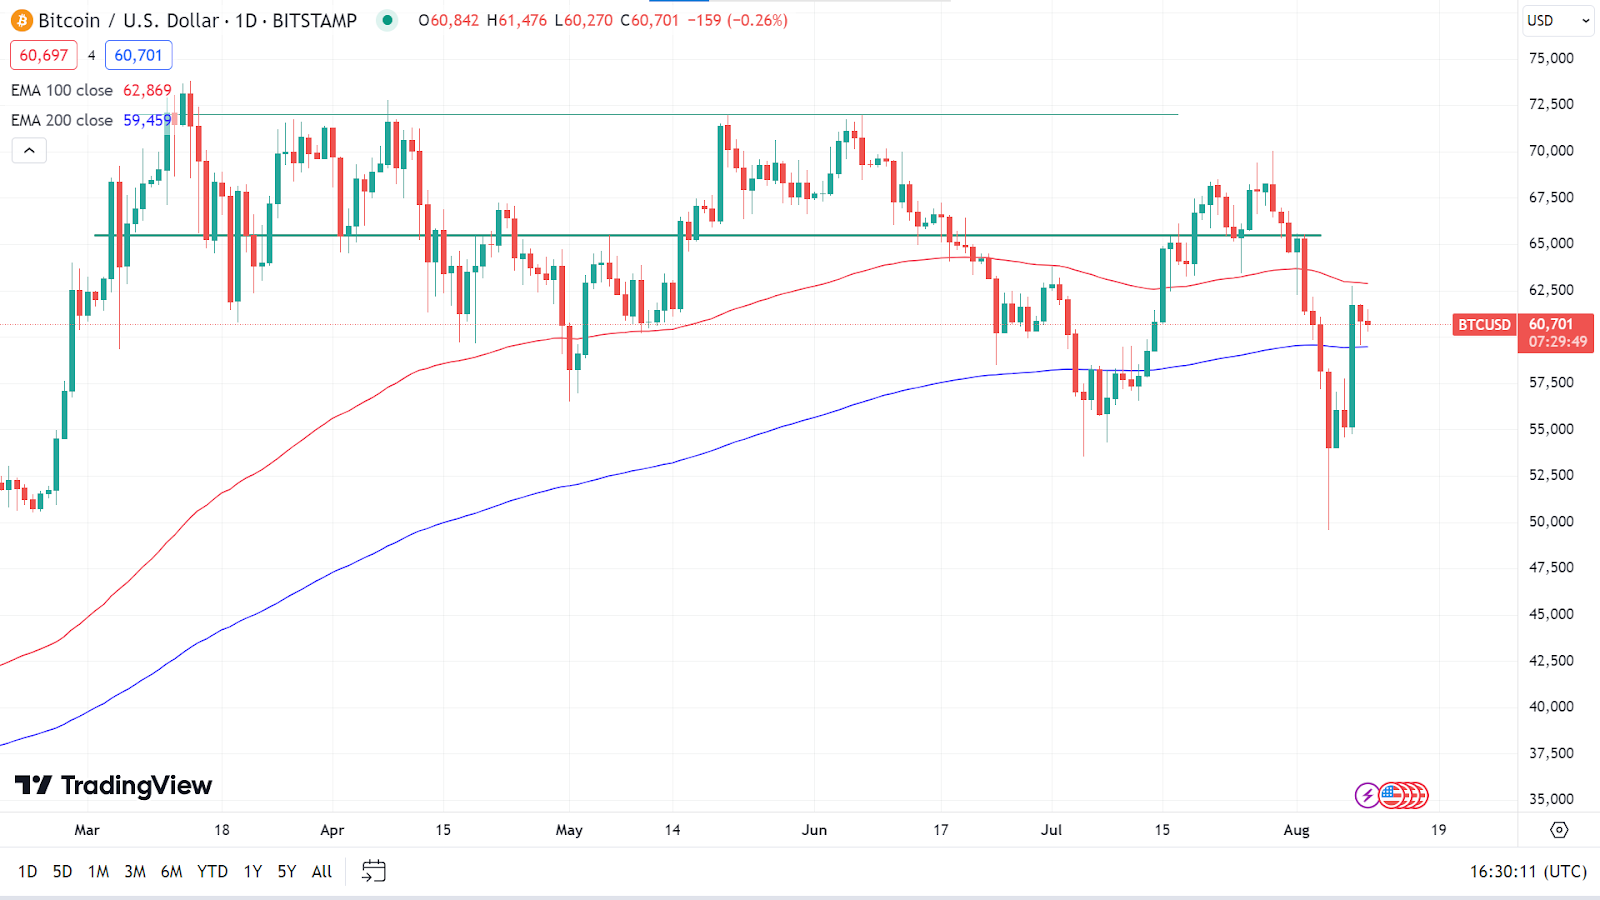
On the daily chart, the price floats between the EMA 100 and EMA 200 lines, where the EMA 100 line acts as a dynamic resistance and the EMA 200 line acts as a dynamic support level. If the price exceeds the EMA 100 line with significant bullish pressure, it may hit the nearest resistance of 65,507. In contrast, a breakout can trigger the price toward the next resistance near 69,043.
On the other hand, if the price declines below the EMA 200 line, it will open the room for reaching the primary support of 57,441, followed by the next support near 54,015.
Ethereum (ETHUSD)
Fundamental Perspective
Last week, Ethereum ETFs saw a negative turn in net flows, with outflows amounting to $23.7 million. BlackRock's ETHA, which had recently led in inflows, recorded no new activity, while Grayscale's ETHE experienced increased outflows of $31.9 million.
Lookonchain reports that a whale, who accumulated 14,384 ETH at an average price of $3,291 between June 22 and August 4, sold all holdings on Binance at $2,417, realizing a loss of $12.57 million.
Jump Trading withdrew 32.6 million USDC from Binance after transferring ETH to the exchange, suggesting a sell of ETH.
Despite these sell-offs, exchanges have continued to experience net ETH outflows, and the ETH Coinbase Premium Index indicates ongoing buying pressure from US investors, reflecting Ethereum's continued recovery.
Technical Perspective
The last weekly candle closed as a dragonfly doji after two consecutive losing weeks, reflecting fresh bullish pressure on the asset price and leaving buyers optimistic for the next week.
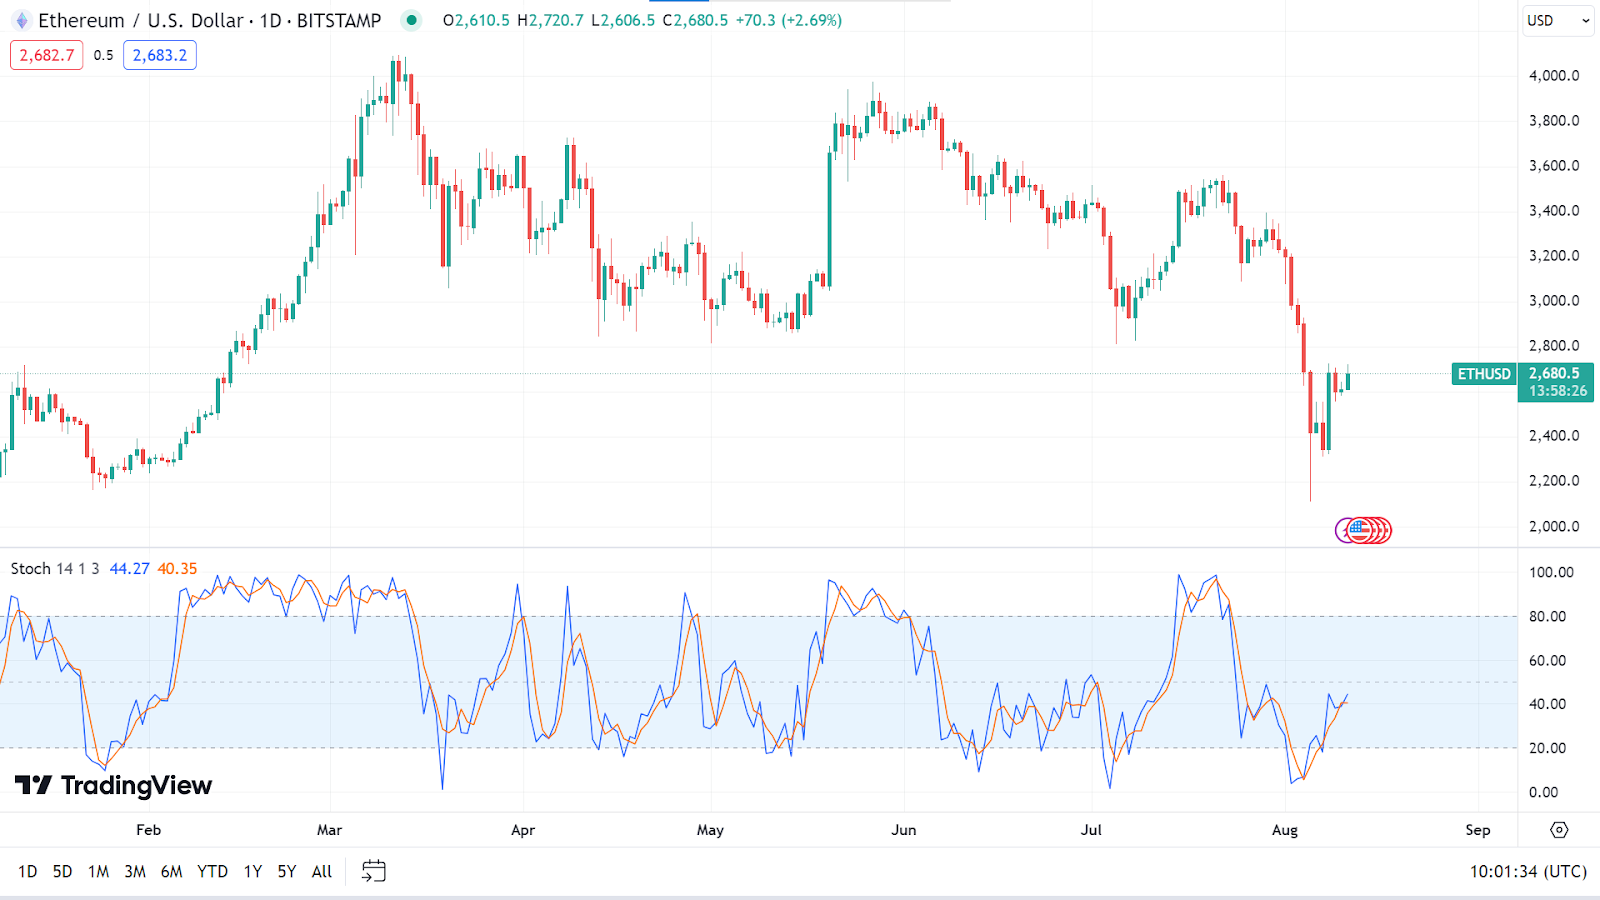
The Stochastic indicator window reveals the fresh bullish pressure as the signal lines edged upside on the daily chart. The price may hit the nearest resistance of 2964.00. In the meantime, any breakout may trigger the price toward the next resistance near 3354.10.
However, the signal lines on the Stochastic indicator window still float below the midline, which reflects the sellers' domination. If the bearish pressure continues, the price may decline toward the primary support of 2453.90, followed by the next support near 2143.00.
Gold (XAUUSD)
Fundamental Perspective
Gold (XAU/USD) experienced significant losses at the start of the week, driven by a broad market selloff linked to the unwinding of Japanese Yen (JPY) carry trades, heightened fears of a US recession, and escalating conflict in the Middle East. Despite these pressures, Gold rebounded strongly later in the week, stabilizing above $2,400 as market dynamics shifted. Investors are now keenly awaiting July's US inflation data to gauge the next move.
Early in the week, Gold failed to capitalize on rising geopolitical tensions, losing over 1% on Monday and continuing its decline on Tuesday as the 10-year US Treasury bond yield surged, diminishing Gold's appeal as a safe haven. By midweek, however, easing concerns about the JPY carry trade and comments from Bank of Japan Deputy Governor Shinichi Uchida, who reassured markets by emphasizing the continuation of monetary easing, helped Gold stabilize and limit its losses.
Gold attracted technical buyers without major data releases after breaking above $2,400 on Thursday, extending gains into Friday. Next week's US inflation data, particularly the Consumer Price Index (CPI), will be pivotal in determining Gold's trajectory. A stronger-than-expected CPI could lift the USD and pressure Gold, while a softer reading might support further gains for XAU/USD.
Technical Perspective
The last weekly candle closed with a small red body and a long lower wick, leaving buyers optimistic for the upcoming week.
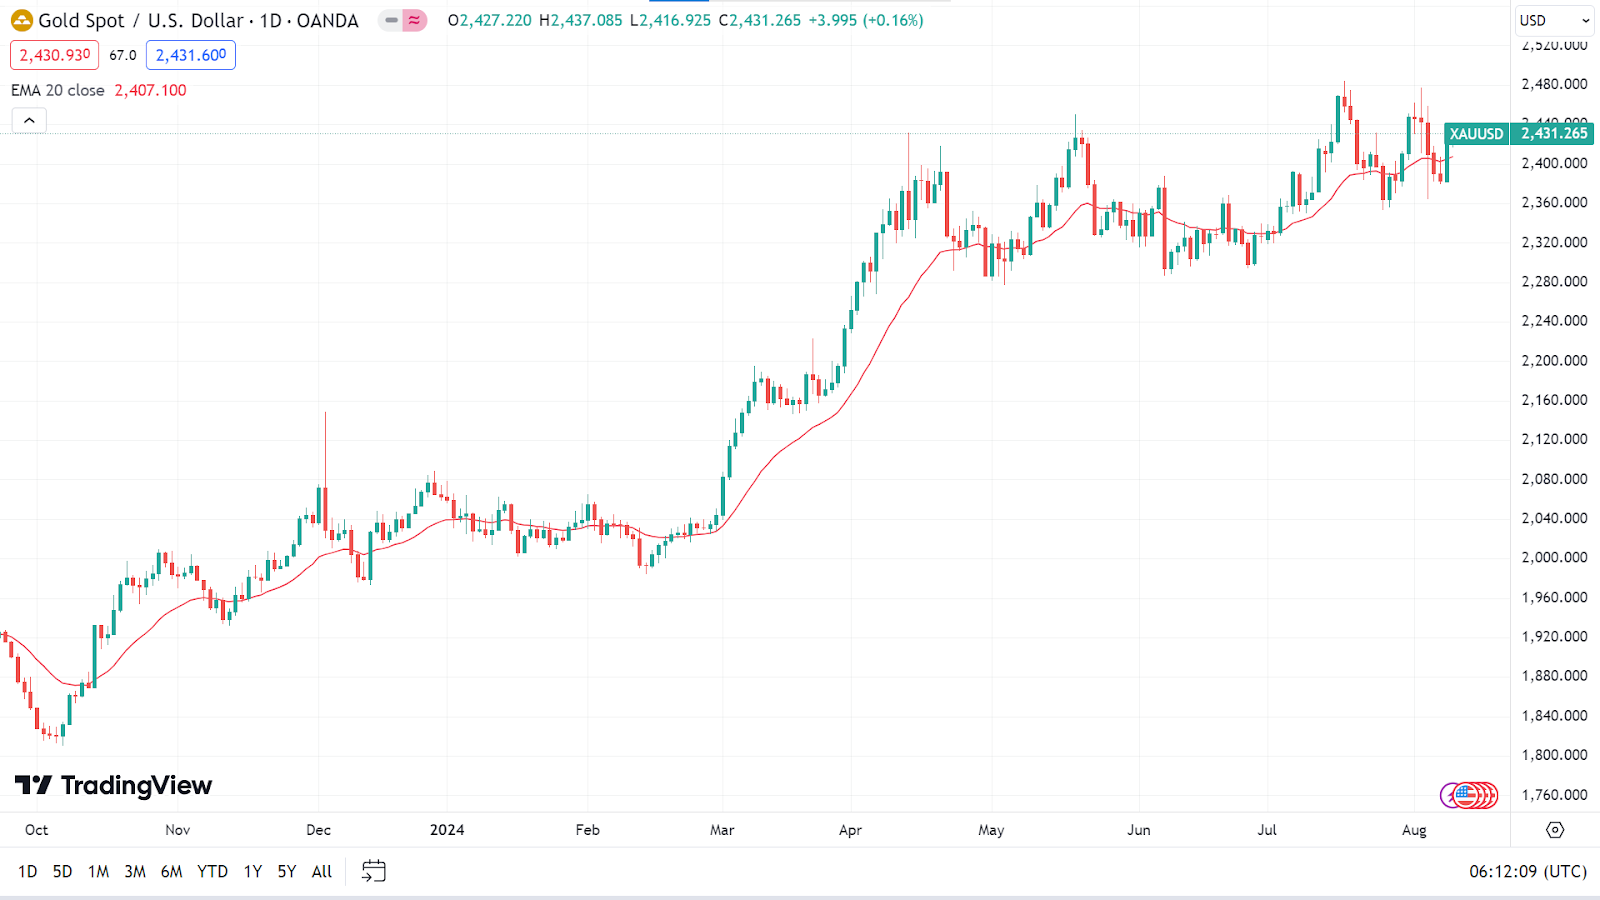
The price floats above the EMA 20 line on the daily chart, supporting the recent bullish trend. So, the price may head toward the primary resistance 2451.12, followed by the next resistance near 2478.73.
On the other hand, if the price declines below the EMA 20 line, it can reach the nearest support near 2388.25, followed by the next support near 2363.72.
Nvidia Stock (NVDA)
Fundamental Perspective
Nvidia's shares have declined by 17.61% over the past month, significantly underperforming the Computer and Technology sector, which saw an 11.22% drop, and the S&P 500, which fell by 4.45%. The company's upcoming earnings report, scheduled for August 28, 2024, is highly anticipated. Analysts expect Nvidia to report earnings per share (EPS) of $0.64, representing a 137.04% increase from the same quarter last year, with projected quarterly revenue of $28.24 billion, reflecting a 109.04% year-over-year growth.
Investors should also monitor analyst estimates for recent changes, as these often signal shifts in the business environment and expectations. Upward revisions generally indicate increased confidence in Nvidia's business performance and profit potential.
Nvidia is currently trading at a Forward P/E ratio of 39.04, notably higher than the industry average of 22.91, suggesting that investors are paying a premium for the company's strong growth prospects.
Technical Perspective
The last weekly candle closed solid green after three consecutive weeks of loss, leaving buyers optimistic for the upcoming week.
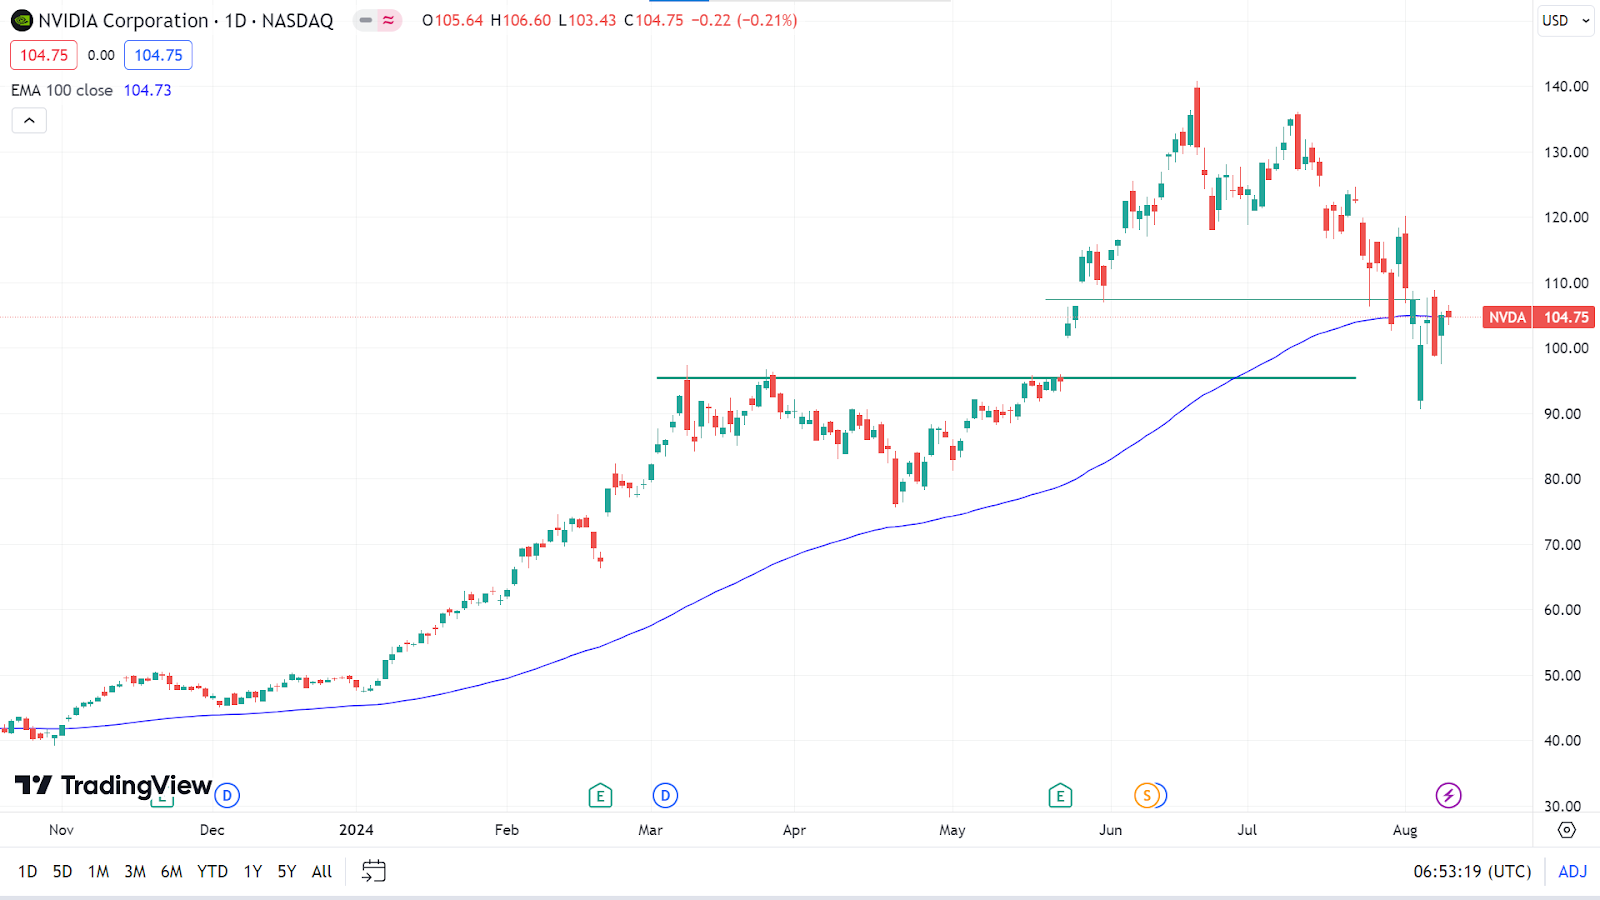
On the daily chart, the price is at the EMA 100 line. If the price keeps moving above the EMA 100 line, it can hit the primary resistance of 111.69, followed by the next resistance of 119.68.
Meanwhile, if the price drops below the EMA 100 line with significant bearish pressure, it can reach the nearest support at 98.03, followed by the next support at 91.72.
Tesla Stock (TSLA)
Fundamental Perspective
Tesla is anticipated to report earnings of $0.59 per share for the current quarter, reflecting a year-over-year decline of 10.6%. The Zacks Consensus Estimate for this figure has decreased by 2.8% over the past 30 days. The consensus estimate for earnings for the full fiscal year is $2.30 per share, representing a 26.3% drop from the previous year, with a 3.3% downward revision in the past month. Looking ahead to the next fiscal year, the consensus estimate stands at $3.14 per share, indicating a 36.3% increase compared to the current year, though this estimate has been revised downward by 6% in the last 30 days.
Earnings growth is a vital indicator of financial health, but it must be supported by revenue growth to be sustainable. Tesla's sales are expected to reach $25.66 billion for the current quarter, marking a 9.9% year-over-year increase. For the full fiscal year, the consensus sales estimate is $98.53 billion, up 1.8%, with next year's revenue projected to rise by 14.8% to $113.1 billion.
To assess whether Tesla's stock is fairly valued, it's important to compare its current valuation multiples, such as price-to-earnings (P/E), price-to-sales (P/S), and price-to-cash flow (P/CF), both against its historical values and relative to its industry peers.
Technical Perspective
The last weekly candle closed solid green after four consecutive losing weeks, indicating sellers may be losing power at this level and leaving buyers optimistic for the next week.
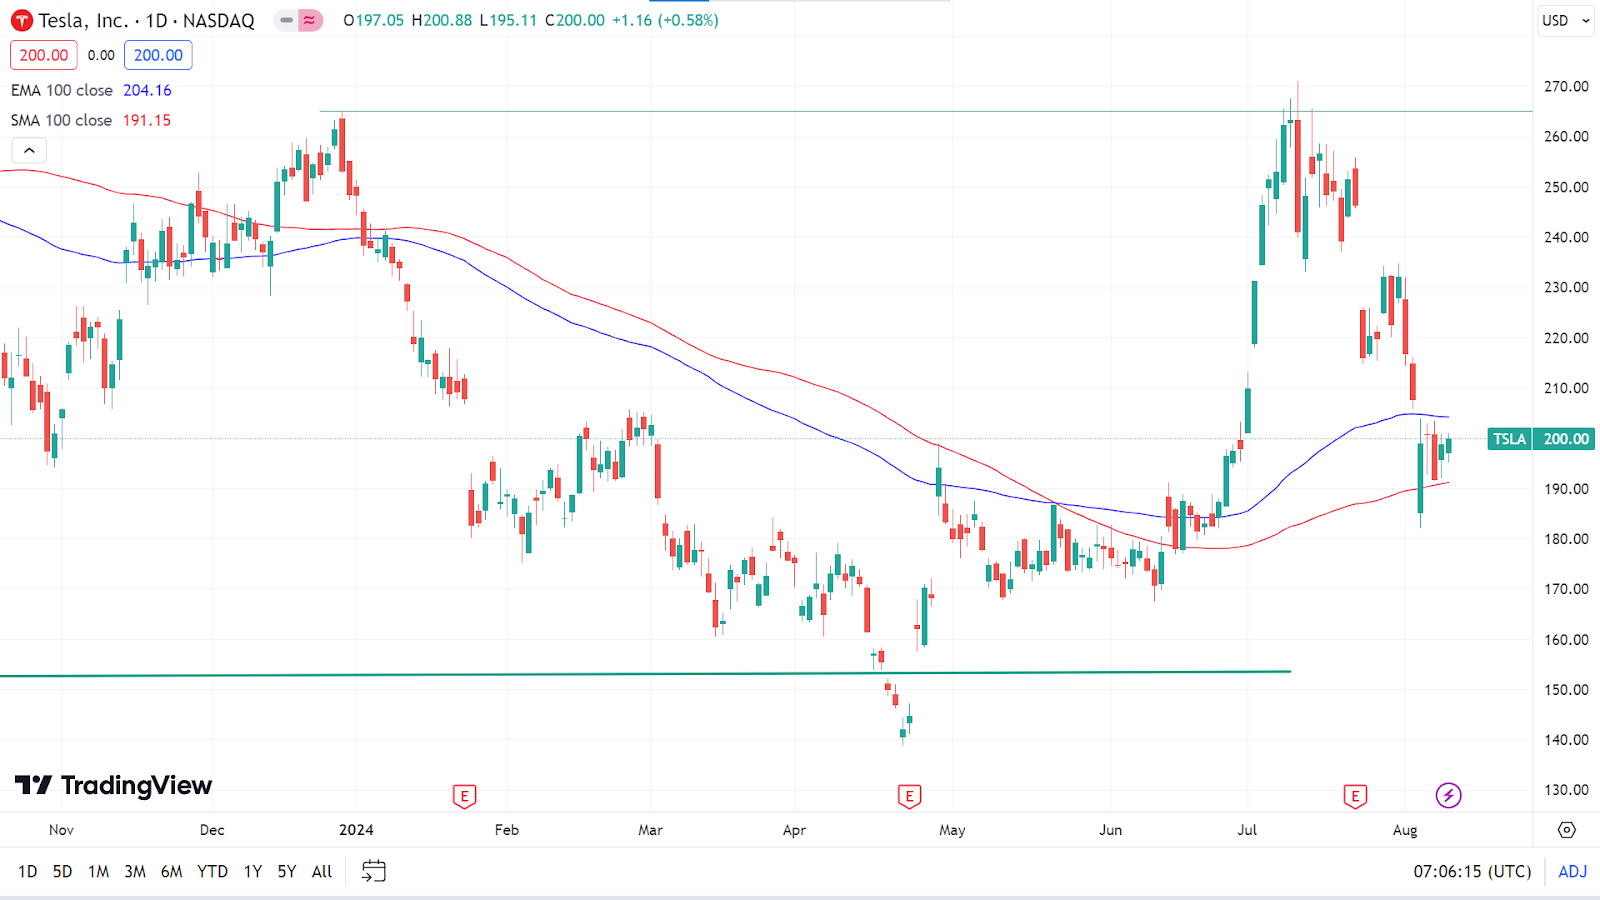
The price is floating between the EMA 100 and SMA 100 lines, where the EMA 100 lines act as a dynamic resistance and the SMA 100 lines act as a dynamic support level. If the price exceeds the EMA 100 line, it can hit the nearest resistance at 217.70, followed by the next resistance 232.39.
Meanwhile, if the price declines below the SMA 100 line, the price may head toward the primary support of 185.15, followed by the next support near 175.22.
WTI Crude Oil (USOUSD)
Fundamental Perspective
Oil prices advanced on Friday during the US trading session following reports that Russia had exceeded its production quota under the OPEC agreement but is committed to adhering to the quota by reducing output in August and September, according to Interfax. This development, along with upcoming events and supportive news such as Israel's resumption of talks with Hamas, has led traders to buy back into oil. Additionally, Yahoo! Finance reported that an Indian company received a waiver from US authorities to purchase crude from Venezuela, influencing market dynamics.
In contrast, the US Dollar Index (DXY), which measures the dollar against six major currencies, struggled to maintain its recovery. The DXY has attempted to close above a key level for the fourth consecutive day but is faltering again on Friday. This ongoing struggle may signal a broader outflow of the US Dollar, potentially leading to further declines against most major currencies in the coming week.
Technical Perspective
The last weekly candle finished solid green, recovering from the previous four weeks of consecutive loss, indicating a reversal, and the next candle might be another green one.
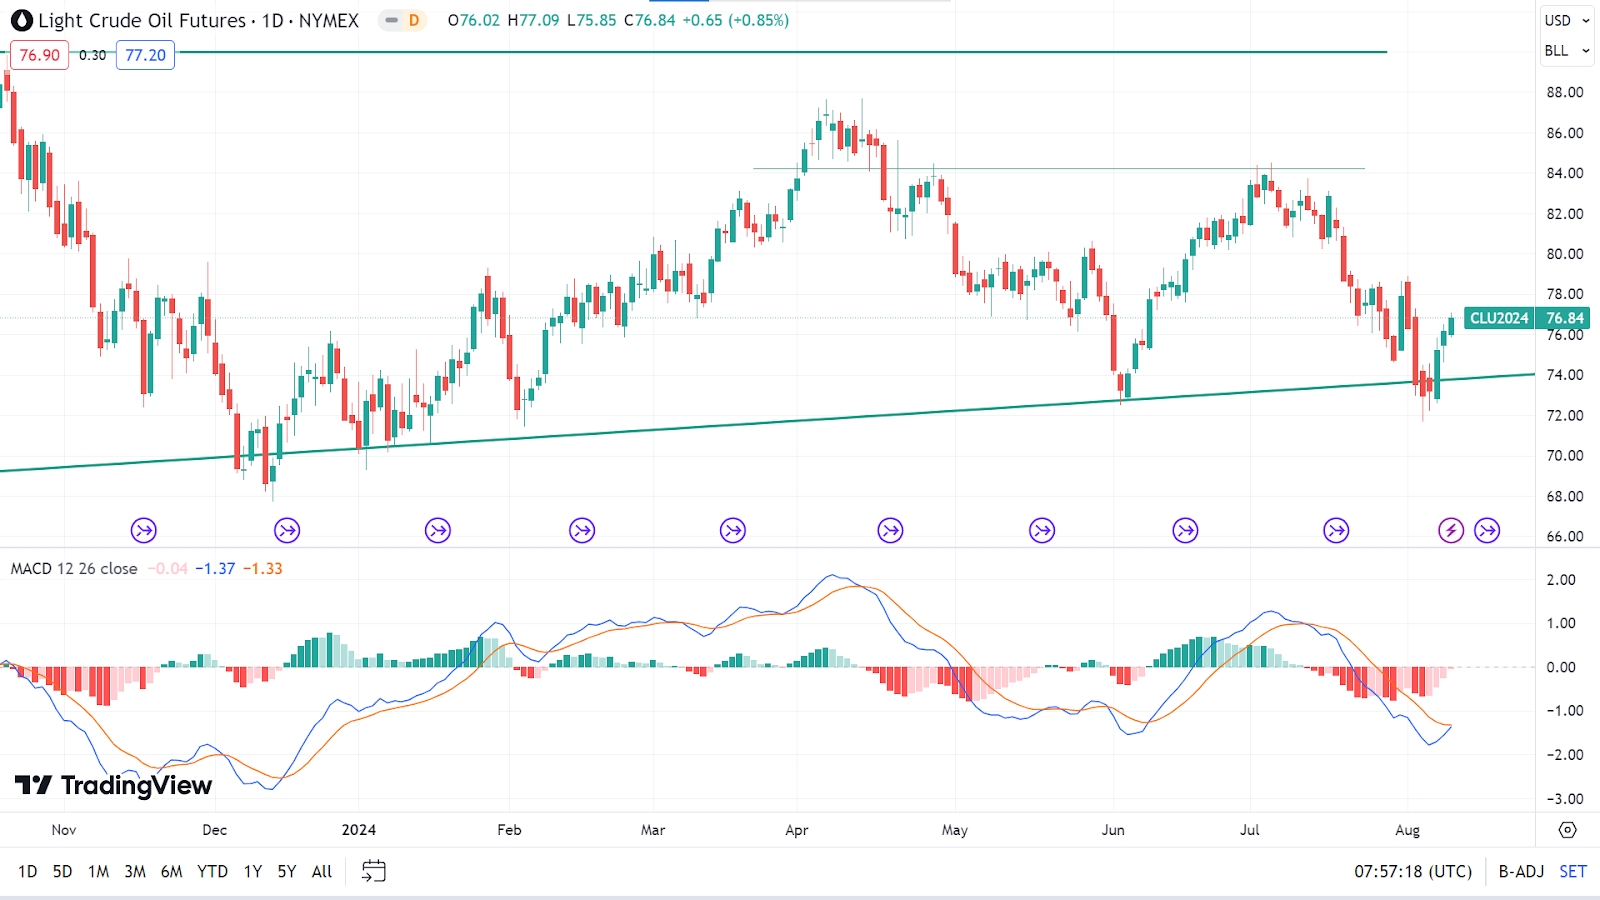
The price still has bearish pressure, as the MACD indicator window shows through red histogram bars and signal lines below the midline. So, the price may hit the primary support of 74.23, followed by the next support near 71.91.
Meanwhile, the fading red histogram bars reflect that the selling pressure may dim, and the signal lines may also create a bullish crossover and start edging upward. In that case, the price may hit the primary resistance of 78.87, followed by the next resistance near 82.35.


