EURUSD
Fundamental Perspective
The EURUSD pair hit a nearly four-month low of 1.0760 before rebounding above 1.0800. Initially, the US dollar gained as investors sought safety, though renewed interest in high-yield assets emerged later on, fueled by upbeat US economic data.
Political risks and geopolitical strains pressured market sentiment. Israel's continued military actions in Gaza and Lebanon persisted despite US-led ceasefire efforts by Secretary of State Antony Blinken. Meanwhile, the tight US presidential race between Vice President Kamala Harris and former President Donald Trump has raised concerns about potential shifts in Federal Reserve policies should Trump win, which could disrupt inflation control efforts.
Eurozone data reflected a challenging economic landscape. The German Composite PMI showed slight improvement but remained in contraction, with weakening private-sector output and employment. Similarly, Eurozone PMI data signaled persistent economic pressure.
ECB officials have hinted at further rate cuts in response to weak growth, while US indicators showed resilience, with lower-than-expected jobless claims and a stronger PMI. Upcoming key data releases, including GDP and inflation measures, could drive significant EUR/USD movement as investors weigh the economic outlook for both regions.
Technical Perspective
The weekly chart creates a valid double-top pattern, confirming a reversal from the resistance and indicating possibilities for a downtrend continuation.
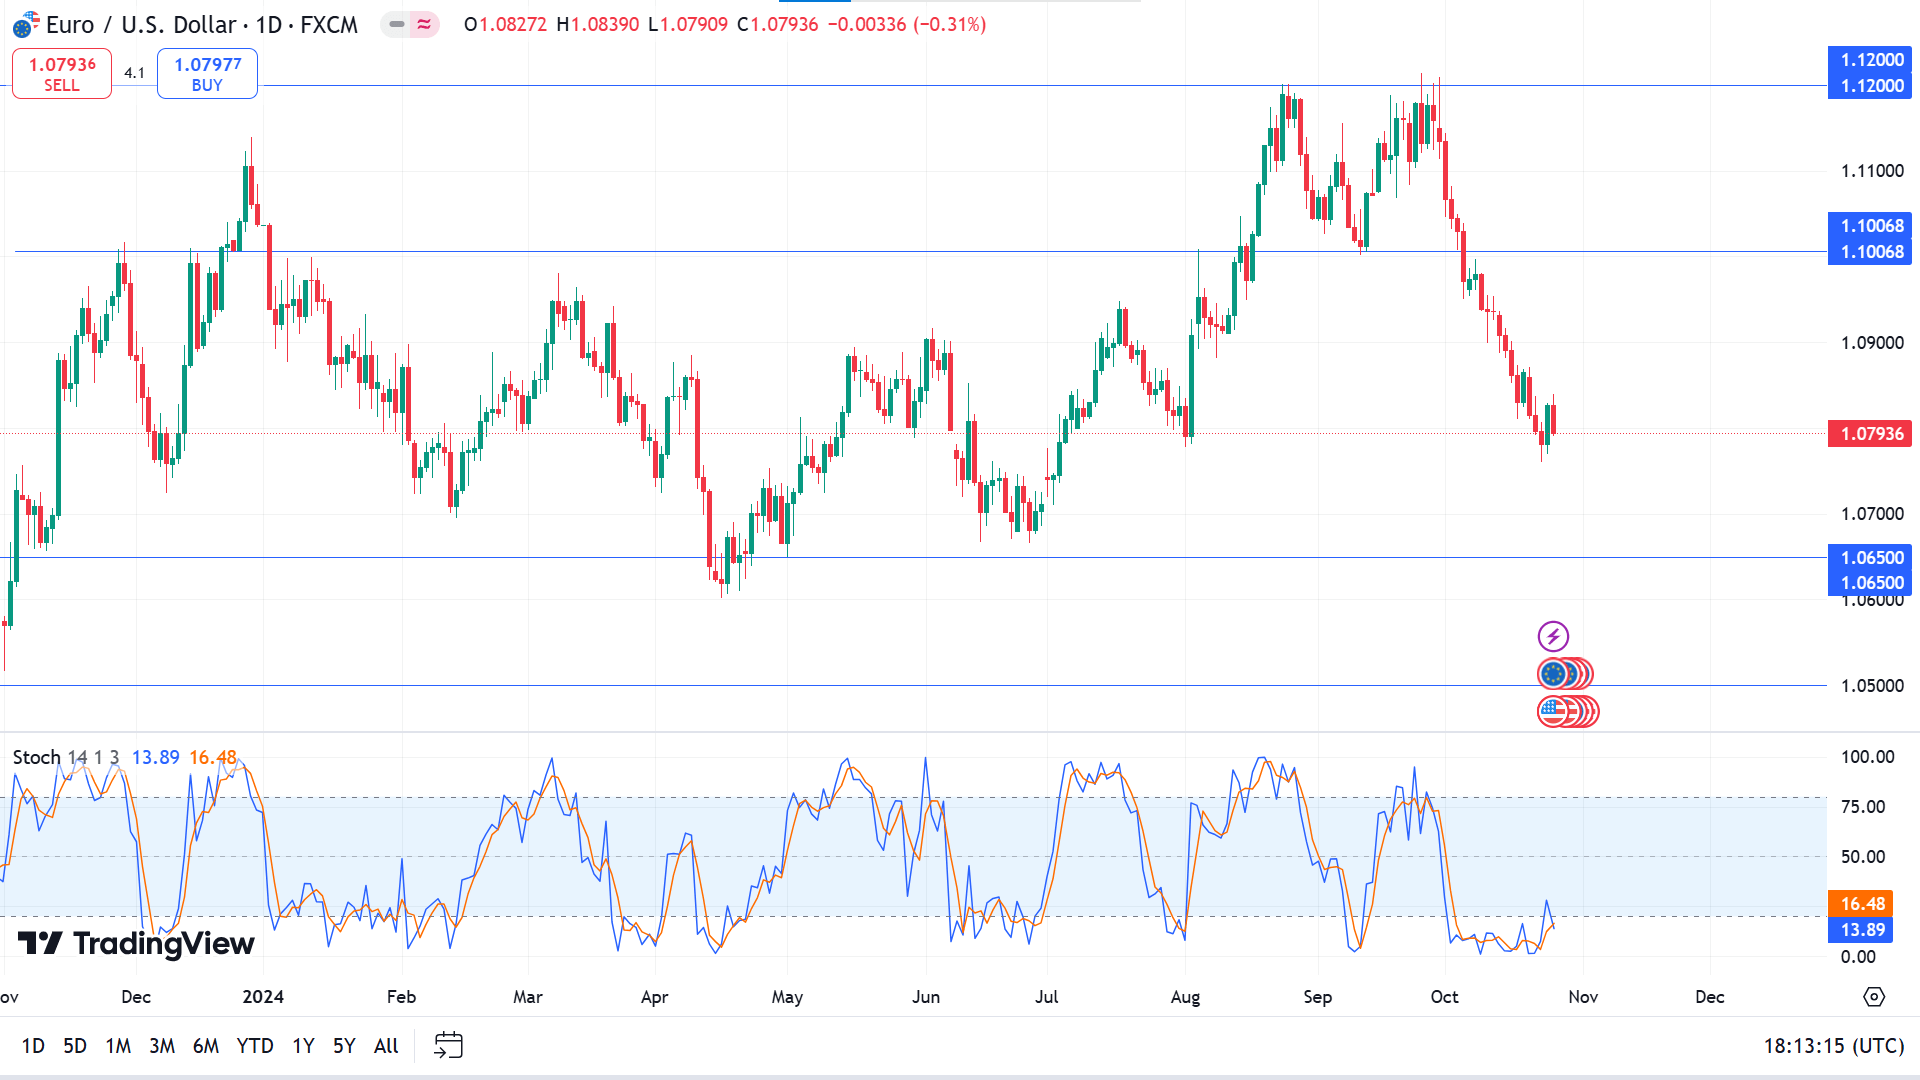
On the daily chart, the price remains in a downtrend as the Stochastic dynamic lines float below the lower line on the indicator window, reflecting oversold conditions and creating a fresh bearish crossover. If the bearish pressure sustains, the price might hit the primary support near 1.0650, followed by the next possible support near 1.0500.
Meanwhile, if the dynamic signal lines of the Stochastic indicator window start edging upside, the price can bounce back to the neckline near 1.1006, and a breakout may trigger toward the next resistance near 1.1200.
GBPJPY
Fundamental Perspective
Tokyo's October Consumer Price Index (CPI) rose 1.8% year-over-year, slightly easing from September's 2.2%, according to Japan's Statistics Bureau. Core inflation also edged up, with the Tokyo CPI excluding Fresh Food and Energy rising to 1.8% from 1.6%. In comparison, the Tokyo CPI excluding Fresh Food reached 1.8%, slightly surpassing projections but down from 2% the prior month.
On the other hand, the Pound Sterling faces continued pressure amid a risk-averse environment and increased expectations of a Bank of England (BoE) rate cut in response to softening inflation. Recent data from the Office for National Statistics (ONS) showed a notable decline in UK CPI inflation, which fell to 1.7% in September from 2.2% in August, marking its lowest level since April 2021.
Looking ahead, Wednesday will feature the UK Autumn Budget and the US ADP Employment Change report, both closely watched by markets. On Thursday, BoE policymaker Sarah Breeden will speak early, followed by releasing the US core Personal Consumption Expenditures (PCE) Price Index and Jobless Claims later in the day, potentially offering fresh insights on central bank policy directions amidst moderating inflation.
Technical Perspective
The weekly chart shows the price is recovering from the previous downtrend and may resume the long-term uptrend by delivering consecutive green candles.
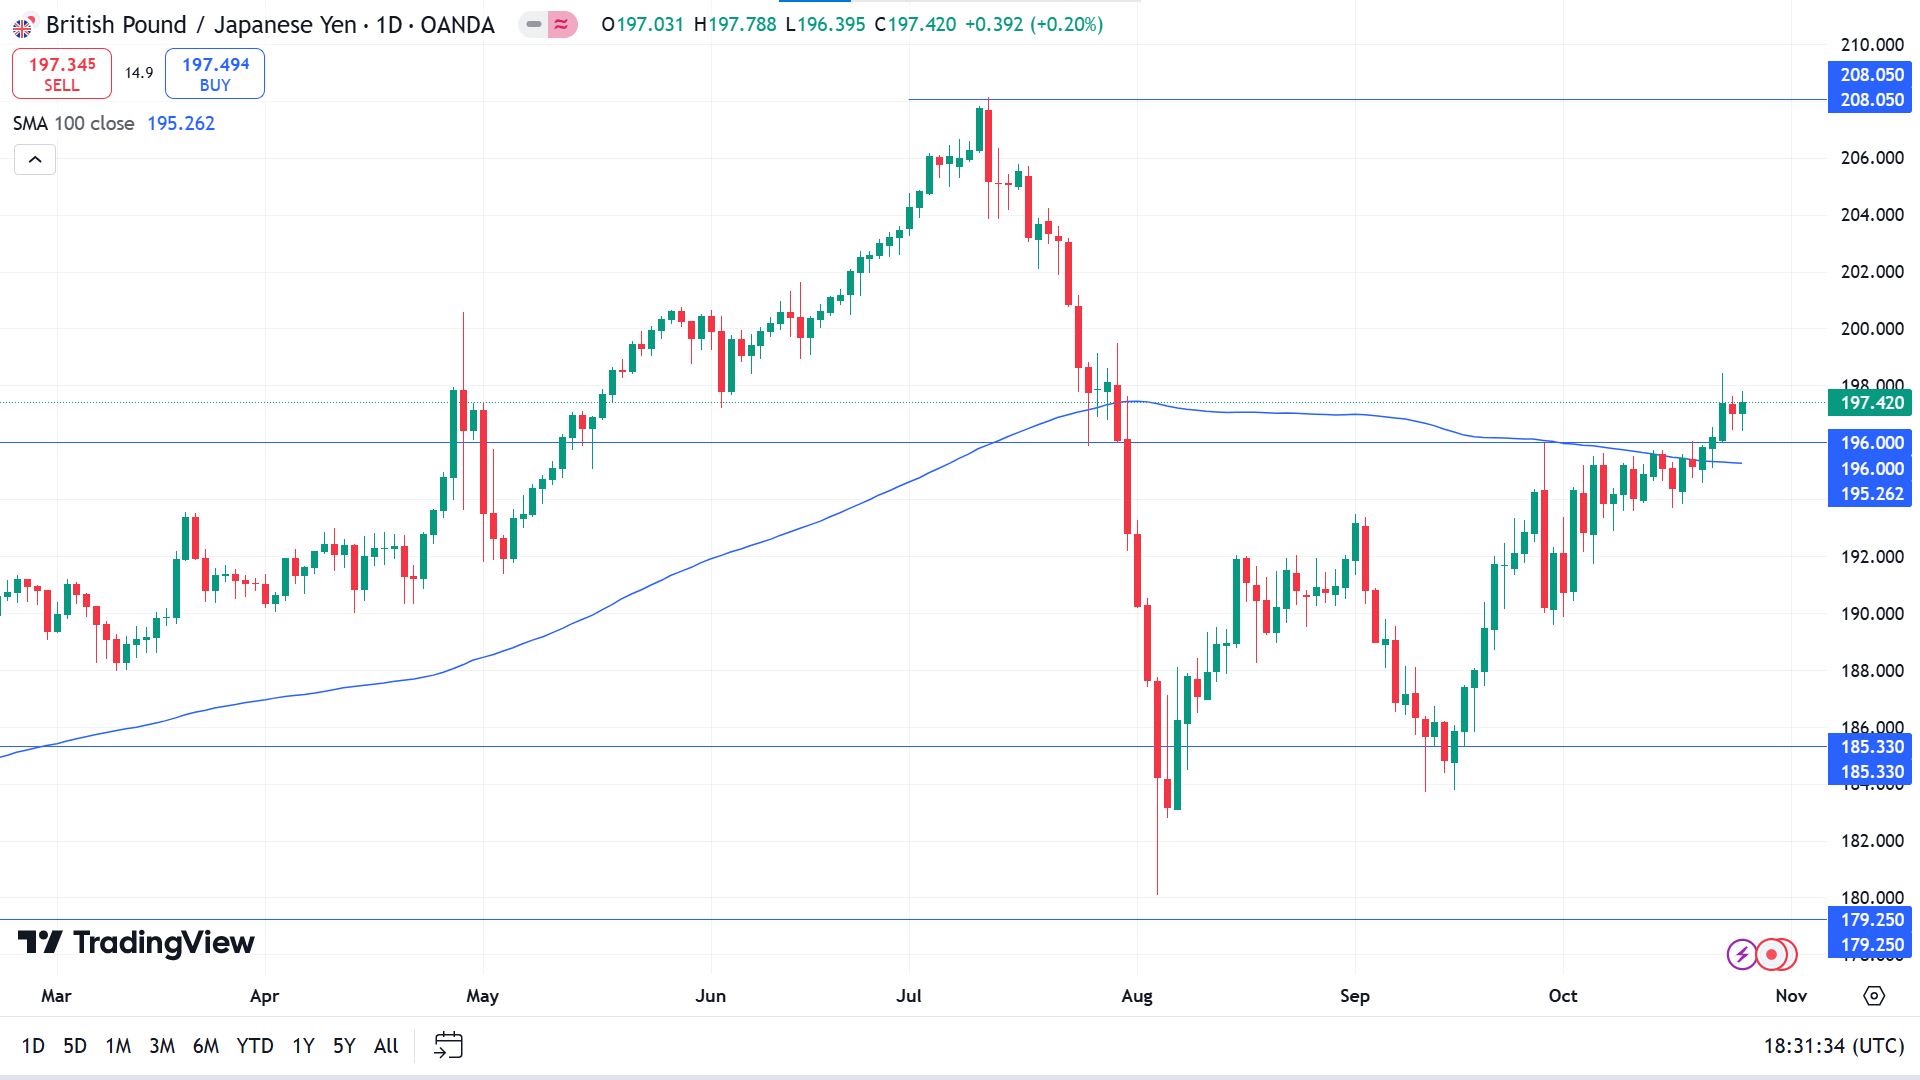
Due to the current bullish pressure, the price reached above the SMA 100 line on the daily chart. If the GBPJPY pair continues to float above the SMA 100 line, it can hit the nearest resistance of 200.86, and a breakout might lead the pair toward the next resistance, which is near 208.05.
On the other hand, if the price declines below the SMA 100 line, it can reach the primary support near 191.94, followed by the next support near 185.33.
Nasdaq 100 (NAS100)
Fundamental Perspective
The Nasdaq Composite achieved a seven-week winning streak—the longest in 2024—and closed just 0.7% below its July 10 record. In contrast, the S&P 500 remained flat, while the Dow Jones Industrial Average fell 0.6%, ending its six-week winning streak.
Data from Friday's durable goods report showed stronger-than-anticipated business investment, excluding defense and aircraft. Additionally, the 10-year Treasury yield climbed to 4.232%, extending gains for a sixth straight week, its longest losing streak since early March 2023.
Analysts noted that recent Treasury yield gains are likely unrelated to the upcoming U.S. presidential election. Meanwhile, the University of Michigan's consumer sentiment survey reported increased confidence, particularly among Republicans, as polls remain tight between Donald Trump and Kamala Harris.
The Cboe Volatility Index (VIX), a key measure of market uncertainty, jumped 6.6% Friday to 20.33 and is up 21.5% in October, reflecting investor caution as the November 5 Election Day approaches.
Technical Perspective
The weekly chart reveals that the price has resumed trending bullish, leaving buyers optimistic for this week.
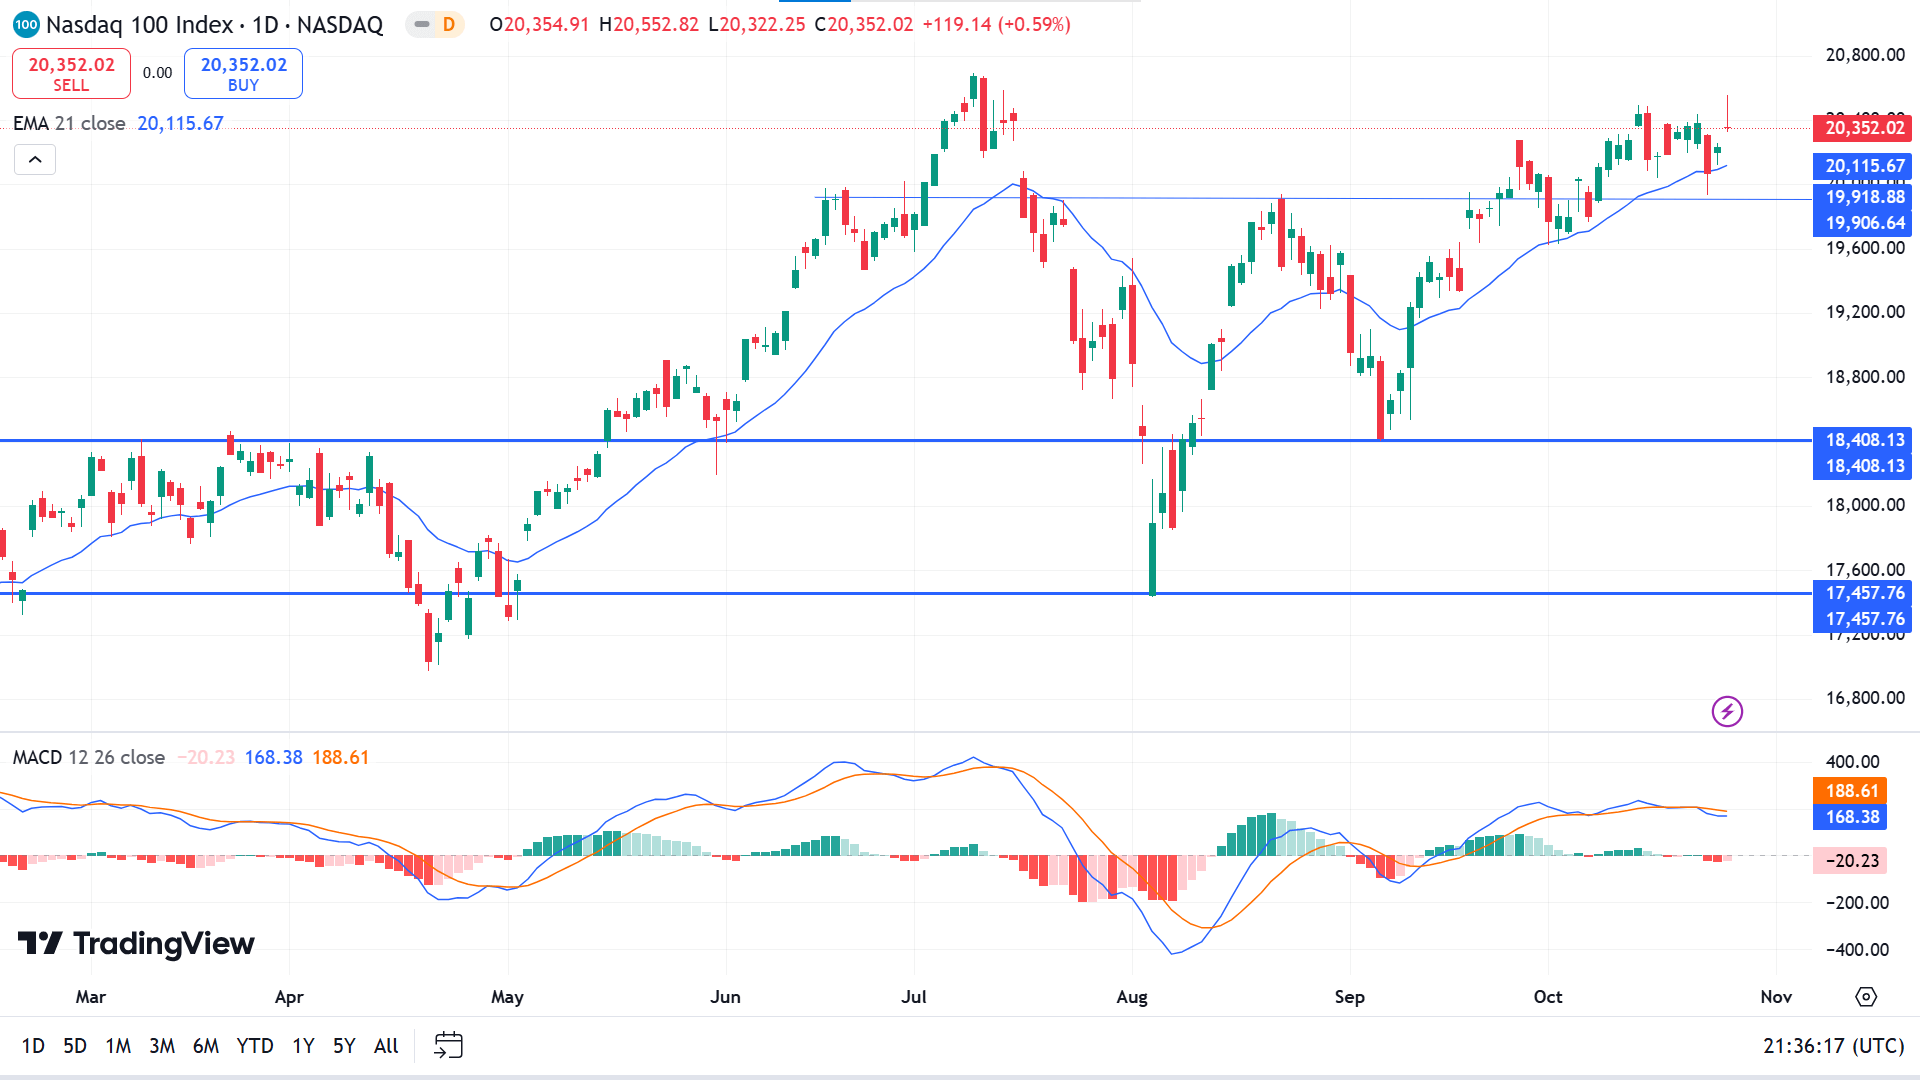
The price is currently on a bullish trend as it remains above the EMA 21 line on the daily chart. However, the MACD indicator window signals the opposite through the dynamic signal lines, creating a new bearish crossover above the midline.
Therefore, if the price continues floating above the EMA 21 line, it can regain its previous peak of 20,690.97, and a breakout may trigger the price toward the next possible resistance, which is near 21,450.65.
On the bearish side, if the price fails to hold the declines below the EMA 21 line, it may reach the primary support near 19,446.86, followed by the next support near 18,408.13.
S&P 500 (SPX500)
Fundamental Perspective
The S&P 500 declined 1% last week, marking its first weekly drop since early September. The index closed at 5,808.12. Despite this, it remains up 0.8% in October and has gained 22% year-to-date.
Earnings season has largely seen companies exceed expectations, with Coca-Cola and Tesla reporting solid results, while Union Pacific fell short on revenue and earnings. By sector, materials and healthcare led the declines, down 4% and 3%, respectively. Newmont's 16% drop followed a Q3 earnings miss, while HCA Healthcare slid 13% due to hurricane disruptions impacting operations.
Carrier Global fell 9.6% in industrials after missing Q3 expectations and cutting its 2024 guidance. However, consumer discretionary and technology sectors managed slight gains, up 0.9% and 0.2%, respectively. Tesla's 22% jump boosted consumer discretionary, as the automaker's Q3 earnings exceeded expectations despite weaker revenue, and Lam Research lifted the tech sector with a 6.6% rise on solid earnings.
Next week, key earnings reports will include Alphabet, Visa, Pfizer, and Amazon, among others. Investors will also watch for October's employment data, with the ADP report on Wednesday and the Labor Department's jobs report on Friday, alongside Q3 GDP and personal consumption data.
Technical Perspective
The weekly chart shows that the S&P 500 index is bullish and finished the last candle red after several consecutive gaining weeks, reflecting increasing buyers' domination in the asset price.
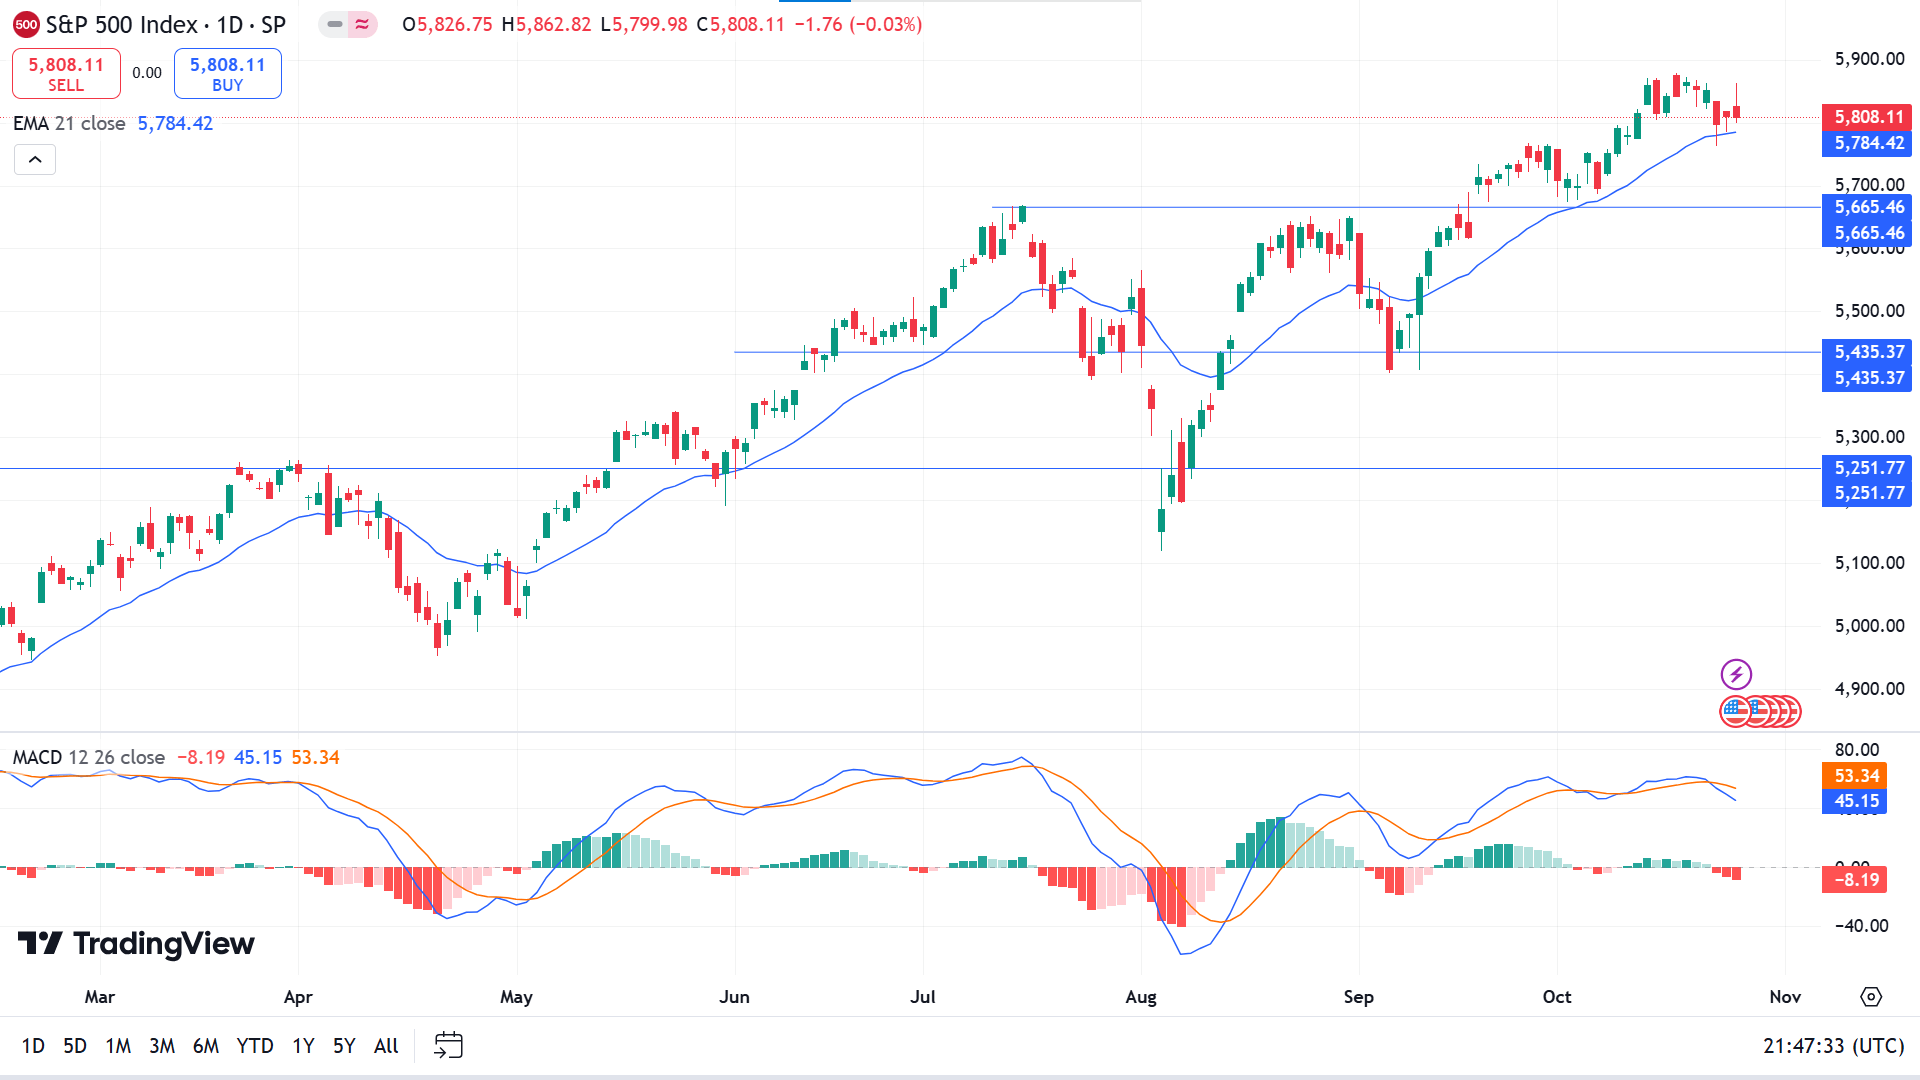
The price is floating near the ATH on the daily chart above the EMA 21 line, while the MACD indicator suggests a fresh bearish pressure.
Considering the buying pressure above the EMA 21 line, it may hit the primary resistance near 5,869.58, followed by the next possible resistance near 6,008.91.
Meanwhile, on the downside, the buying pressure is corrective within a rising wedge pattern from where a valid bearish trendline breakout could initiate massive selling pressure.
Gold (XAUUSD)
Fundamental Perspective
Gold (XAUUSD) climbed to a record high above $2,750 last week, though rising U.S. Treasury yields and a shift in market sentiment curtailed its bullish trend by midweek. The upcoming U.S. economic reports on third-quarter GDP and October labor figures are anticipated to impact Gold's valuation significantly.
The week started positively for Gold as the People's Bank of China lowered the one-year Loan Prime Rate by 25 basis points, alleviating concerns about an economic slowdown. Additionally, geopolitical tensions heightened safe-haven demand following Hezbollah's claim of responsibility for a drone attack on Israeli Prime Minister Benjamin Netanyahu. Gold gained over 1% on Tuesday, but after reaching an all-time high of $2,758 on Wednesday, it reversed and closed with a 1.2% loss due to profit-taking and a strengthening U.S. dollar.
As the week progressed, data indicated healthy growth in U.S. business activity, with the S&P Global Composite PMI rising to 54.3 in October. This report failed to revive Gold's momentum, which fluctuated in a narrow range on Friday. Next week, investors will focus on U.S. GDP growth, expected at 3%, and labor market data, with a significant NFP reading potentially influencing market expectations for Federal Reserve rate cuts.
Technical Perspective
The XAUUSD pair is rising rapidly as the weekly chart shows a straight bullish trend, leaving buyers optimistic for this week.
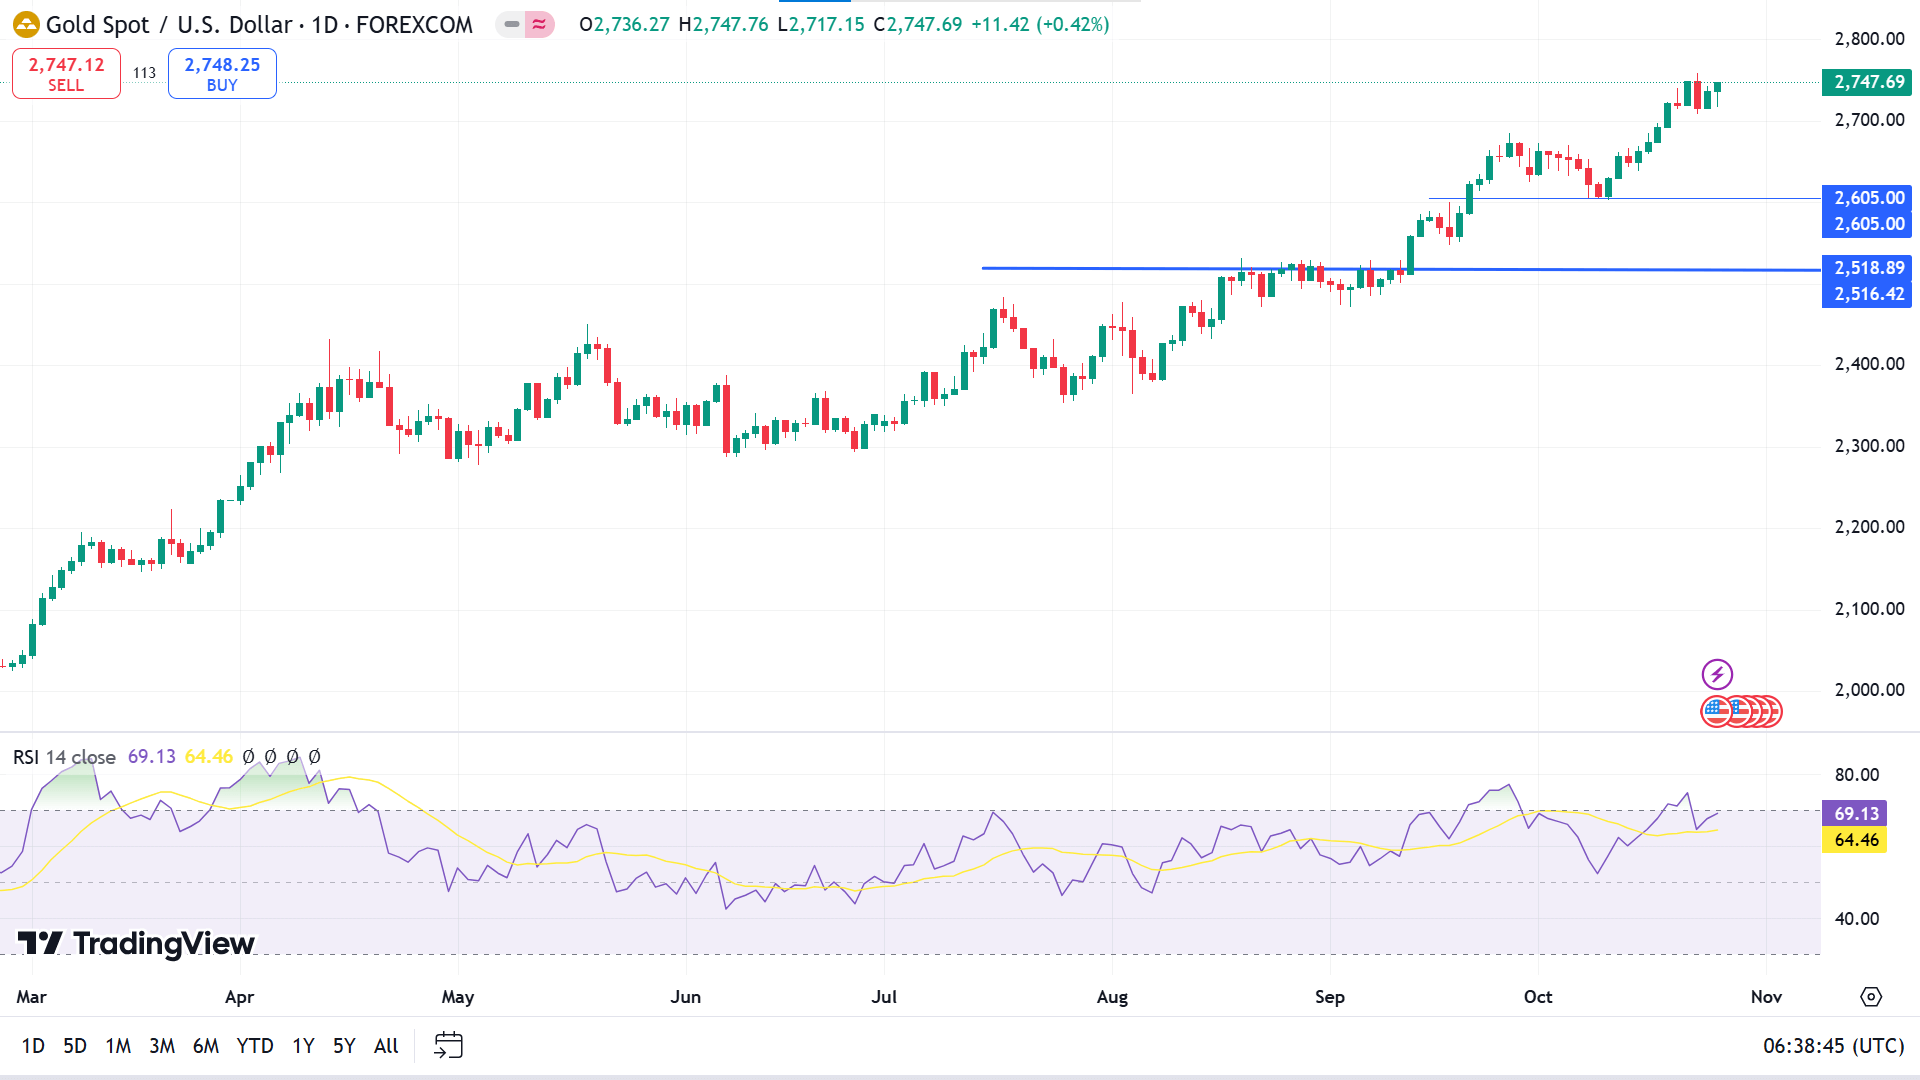
The price has remained on a bullish trend in the daily chart, as the RSI indicator widow shows through the dynamic signal line floating just below the upper line of the indicator window. Considering the ongoing momentum, the price might hit the primary resistance near 2,811.10, and a breakout can drive the price toward the next resistance near 2,955.21.
Meanwhile, a bearish exhaustion from the all-time high area could signal a price reversal. In that case, a bearish daily close below the 2605.00 low could lower the price below the 2400.00 area.
Bitcoin (BTCUSD)
Fundamental Perspective
Bitcoin (BTC) went slightly down for the week after a brief dip below 66,000.00 midweek. Despite a 2% weekly decline, technical indicators suggest a bullish outlook, with projections targeting a new all-time high of around 78,900.00. Institutional interest remains a strong driver, with ETF inflows surpassing $500 million, primarily fueled by U.S. spot ETFs and BlackRock's contributions.
Bitcoin started the week with a decline as profit-taking set in; Santiments Network Realized Profit/Loss (NPL) showed a significant rise, indicating increased profit-taking from holders. Institutional investors seized on the dip, with U.S. spot ETFs recording a $297.6 million net inflow on Monday. Although inflows eased on Tuesday, Bitcoin stabilized around $67,000, and Wednesday saw another decline as some holders took further profits while institutional investors added another $198.5 million.
Thursday brought a 2.3% recovery, supported by $187.58 million in spot ETF inflows. Meanwhile, Glassnode reported that open interest (OI) across futures contracts hit a new high of $32.9 billion, signaling rising leverage in the market and reinforcing the bullish momentum despite recent price fluctuations.
Technical Perspective
On the weekly chart, the price has remained between 71,652.00 and 53,550.00 since March this year. It is currently in a bullish trend, as the current candle has a lower wick, and the previous candle is solid green.
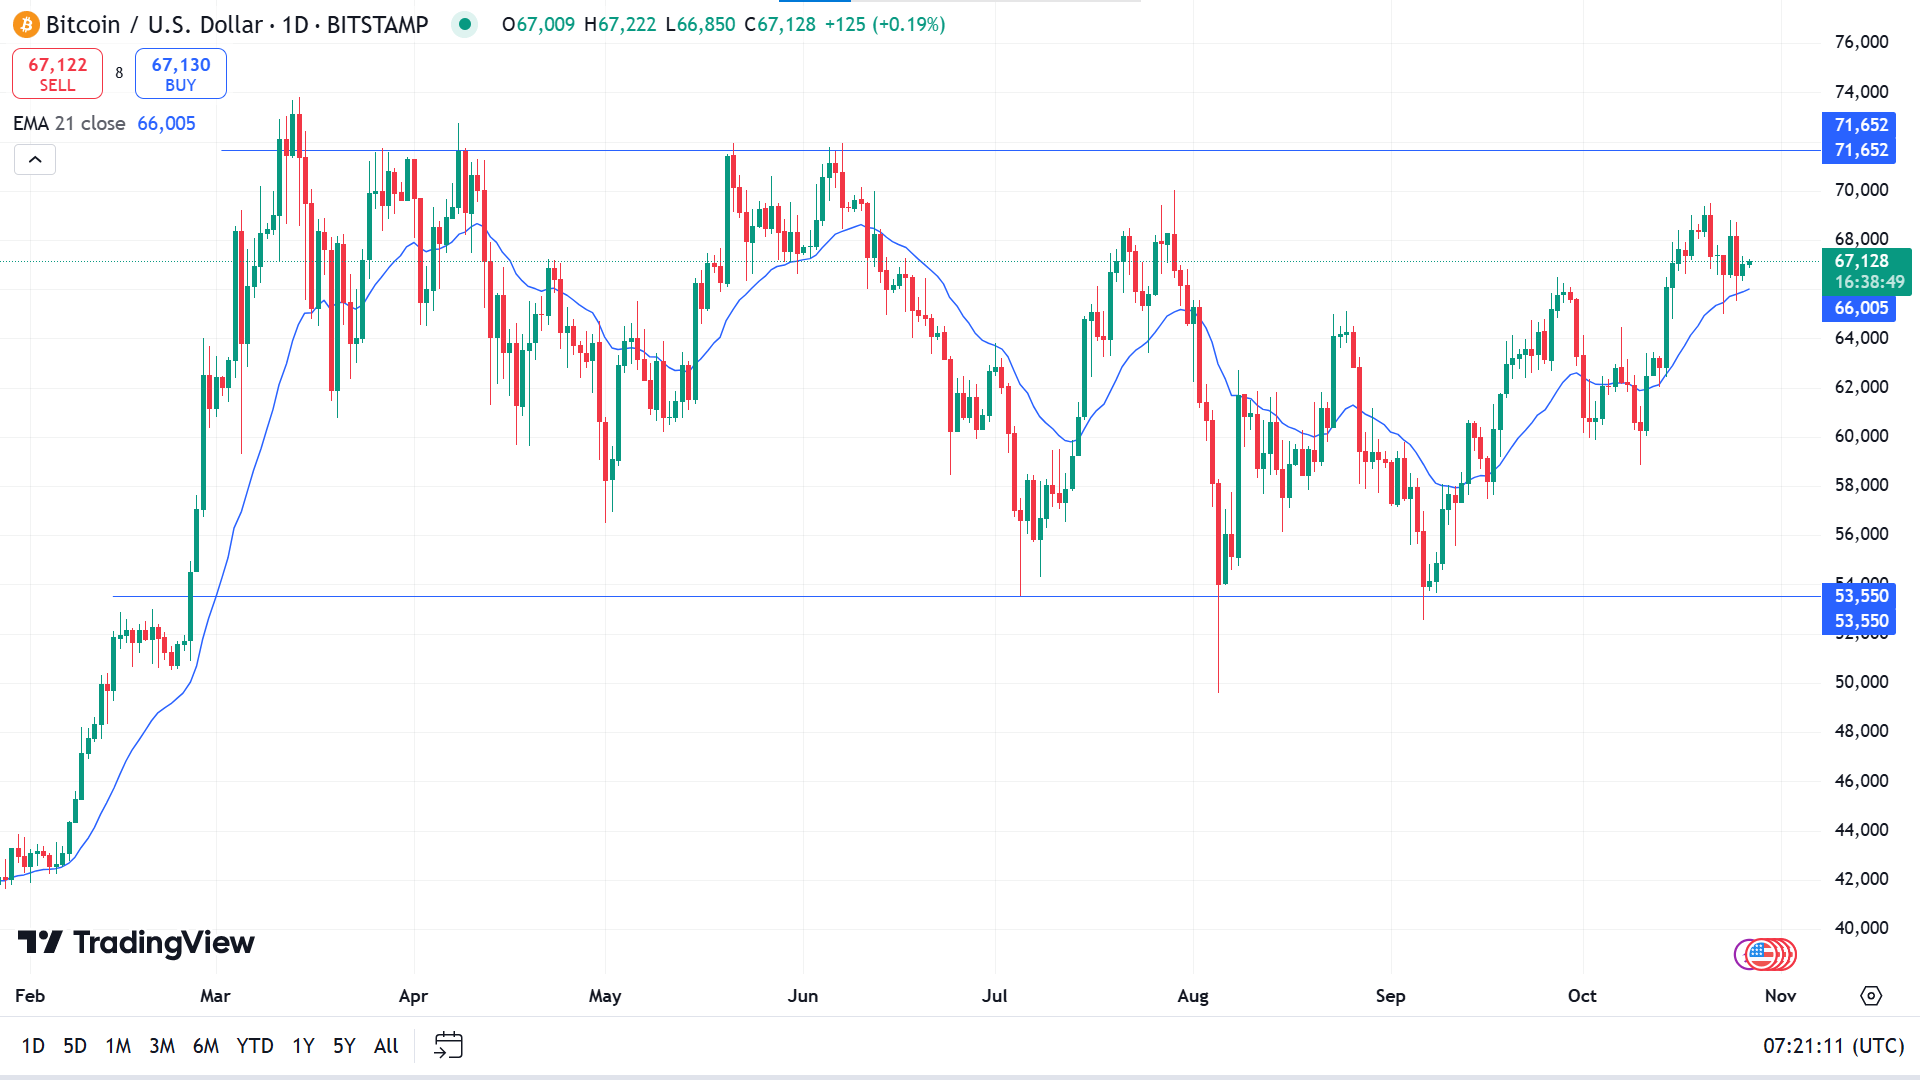
The price is trading sideways after a long bullish wave, reflecting bullish pressure on the asset price. This pressure may drive the price toward the primary resistance near 69,466, followed by the next resistance near 71,652.
However, if the price declines below the EMA 21 line, it will enable the price to get to the primary support near 63,411, followed by the next support near 60,070.
Ethereum (ETHUSD)
Fundamental Perspective
Ethereum has been trailing in the current bullish cycle, failing to keep pace with Bitcoin's rally above $70,000 in March. ETH struggled to surpass $4,000, briefly reaching $4,100 before a significant decline. Over the past seven months, Ethereum has lost nearly 40% from its 2024 highs, and analysts warn of potential further losses if it cannot break through $3,000 soon.
An analyst on X suggests that Ethereum's lag isn't due to network issues or leadership but rather to a lack of understanding among investors. The Ethereum Foundation and co-founder Vitalik Buterin have sold portions of their holdings throughout the year, which could be contributing to bearish market sentiment. However, the analyst asserts that these sales, aimed at network improvements and charitable donations, should not be viewed negatively.
The analyst further argues that Ethereum's growth could hinge on its ability to position itself as a robust store of value, potentially surpassing Bitcoin. With its top position in smart contracts and extensive network versatility, ETH could gain broader appeal by focusing on robust supply dynamics and financial applications, enhancing its attractiveness to both investors and developers.
Technical Perspective
The last weekly candle closed solid red due to recent bearish pressure, but the price may find support at this level as the price moves slightly sideways, leaving mixed signals.
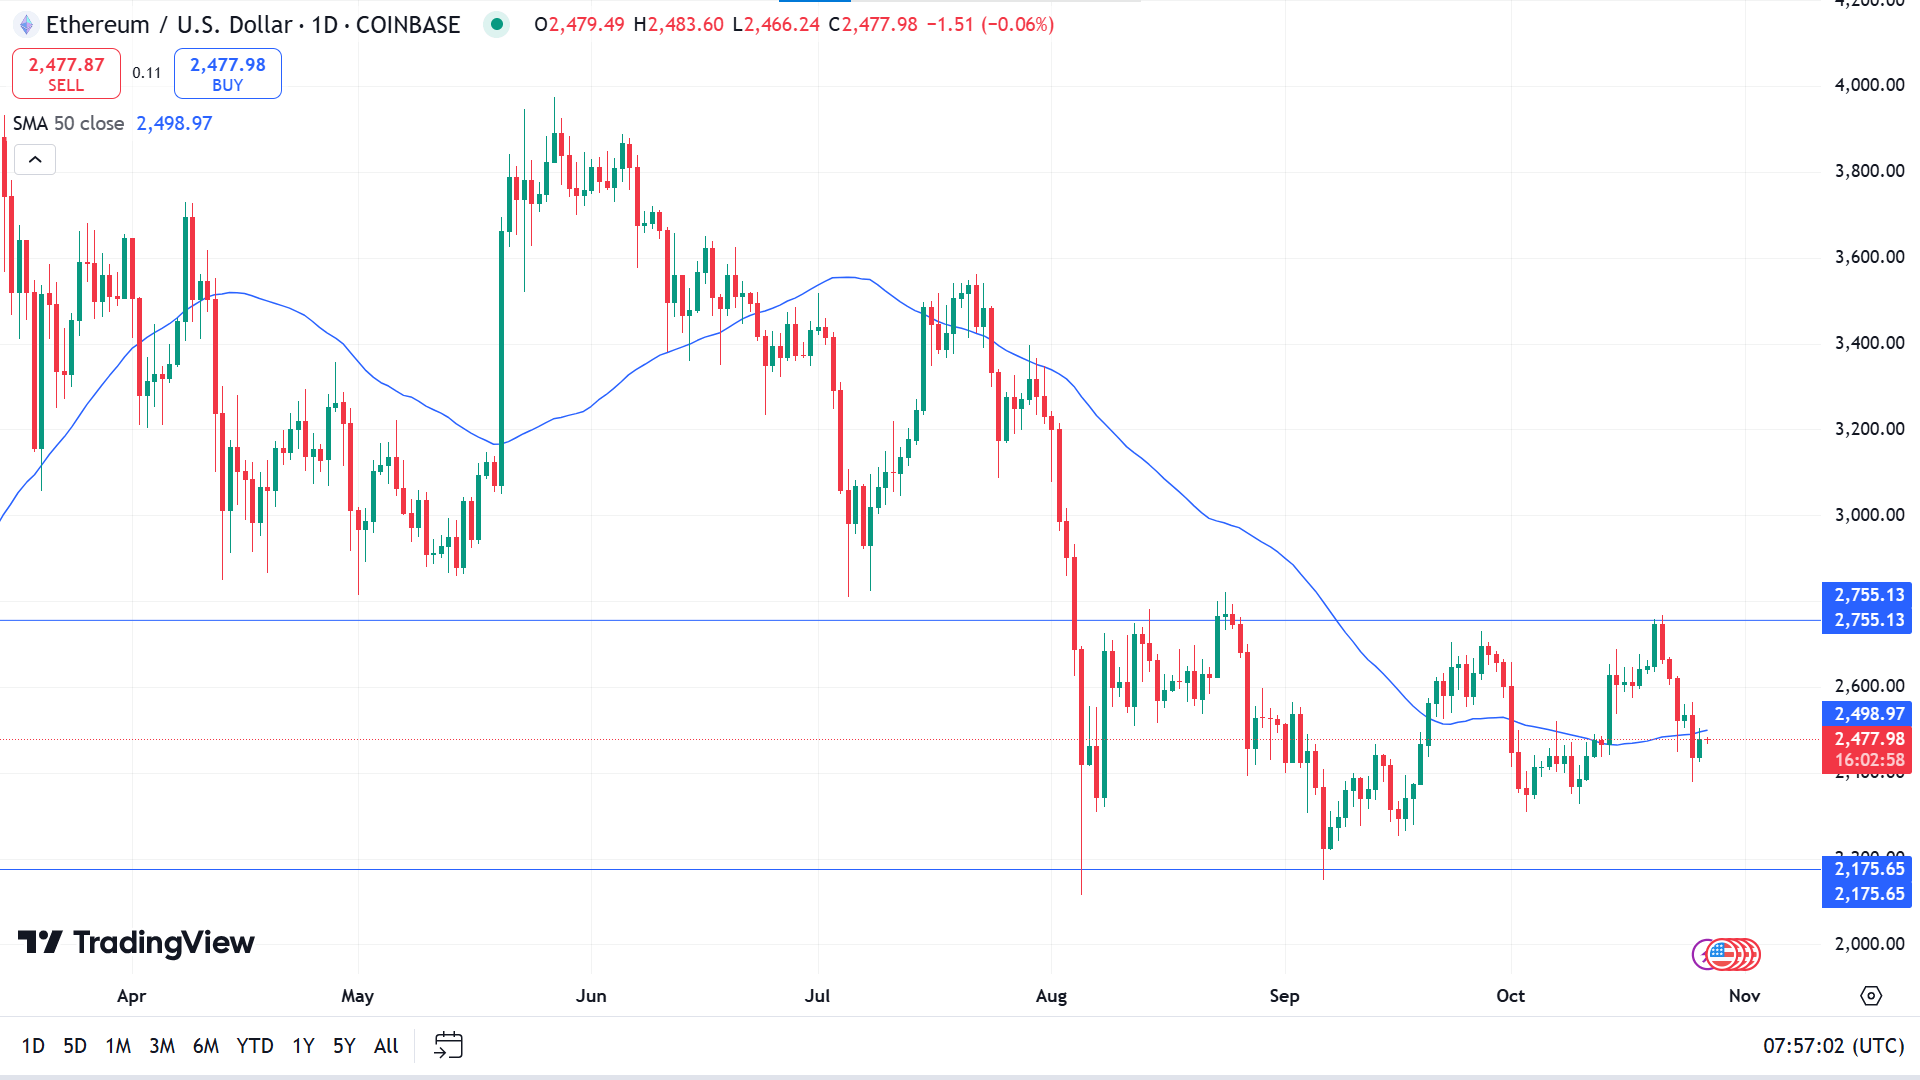
The price is floating below the SMA 50 line on the daily chart, although it remains sideways or within a range. If the price continues to move below the SMA 50 line, it may reach the primary support near 2,348.92, followed by the next support near 2,175.65.
However, suppose the price exceeds the SMA 50 line. In that case, it will declare significant bullish pressure, which may drive the price toward the nearest resistance near 2,655.13. A breakout might trigger the price toward the next possible resistance near 3,046.30.
Tesla Stock (TSLA)
Fundamental Perspective
TSLA reported Q3 earnings Wednesday that exceeded profit expectations, while revenue came in slightly below projections. Shares rose by about 17% on Thursday morning.
Key results vs. analyst forecasts from LSEG:
- Adjusted earnings per share: 72 cents vs. 58 cents anticipated.
- Revenue: $25.18 billion vs. $25.37 billion estimated.
Revenue grew 8% year-over-year from $23.35 billion, and net income surged to $2.17 billion, or 62 cents per share, up from $1.85 billion, or 53 cents a share. Profit margins were supported by $739 million in automotive regulatory credit revenue, as Tesla's all-electric production allowed it to sell excess credits to other automakers.
In segment results, automotive revenue increased 2% to $20 billion, while energy generation and storage revenues jumped 52% to $2.38 billion. Services and other revenue, which includes non-warranty vehicle repairs, grew 29% to $2.79 billion.
CEO Elon Musk projected 20%-30% vehicle growth for next year, spurred by lower-cost models and autonomy advancements. Analysts expect a 15% increase in deliveries. Musk noted that future Tesla models will feature autonomous capabilities, with plans to launch driverless ride-hailing services by 2025 in Texas and California.
Technical Perspective
The last weekly candle was finished with a solid green body recovering from the previous week's loss and reaching above the last peak, declaring bullish pressure and possibilities for the next candle to be another green one.
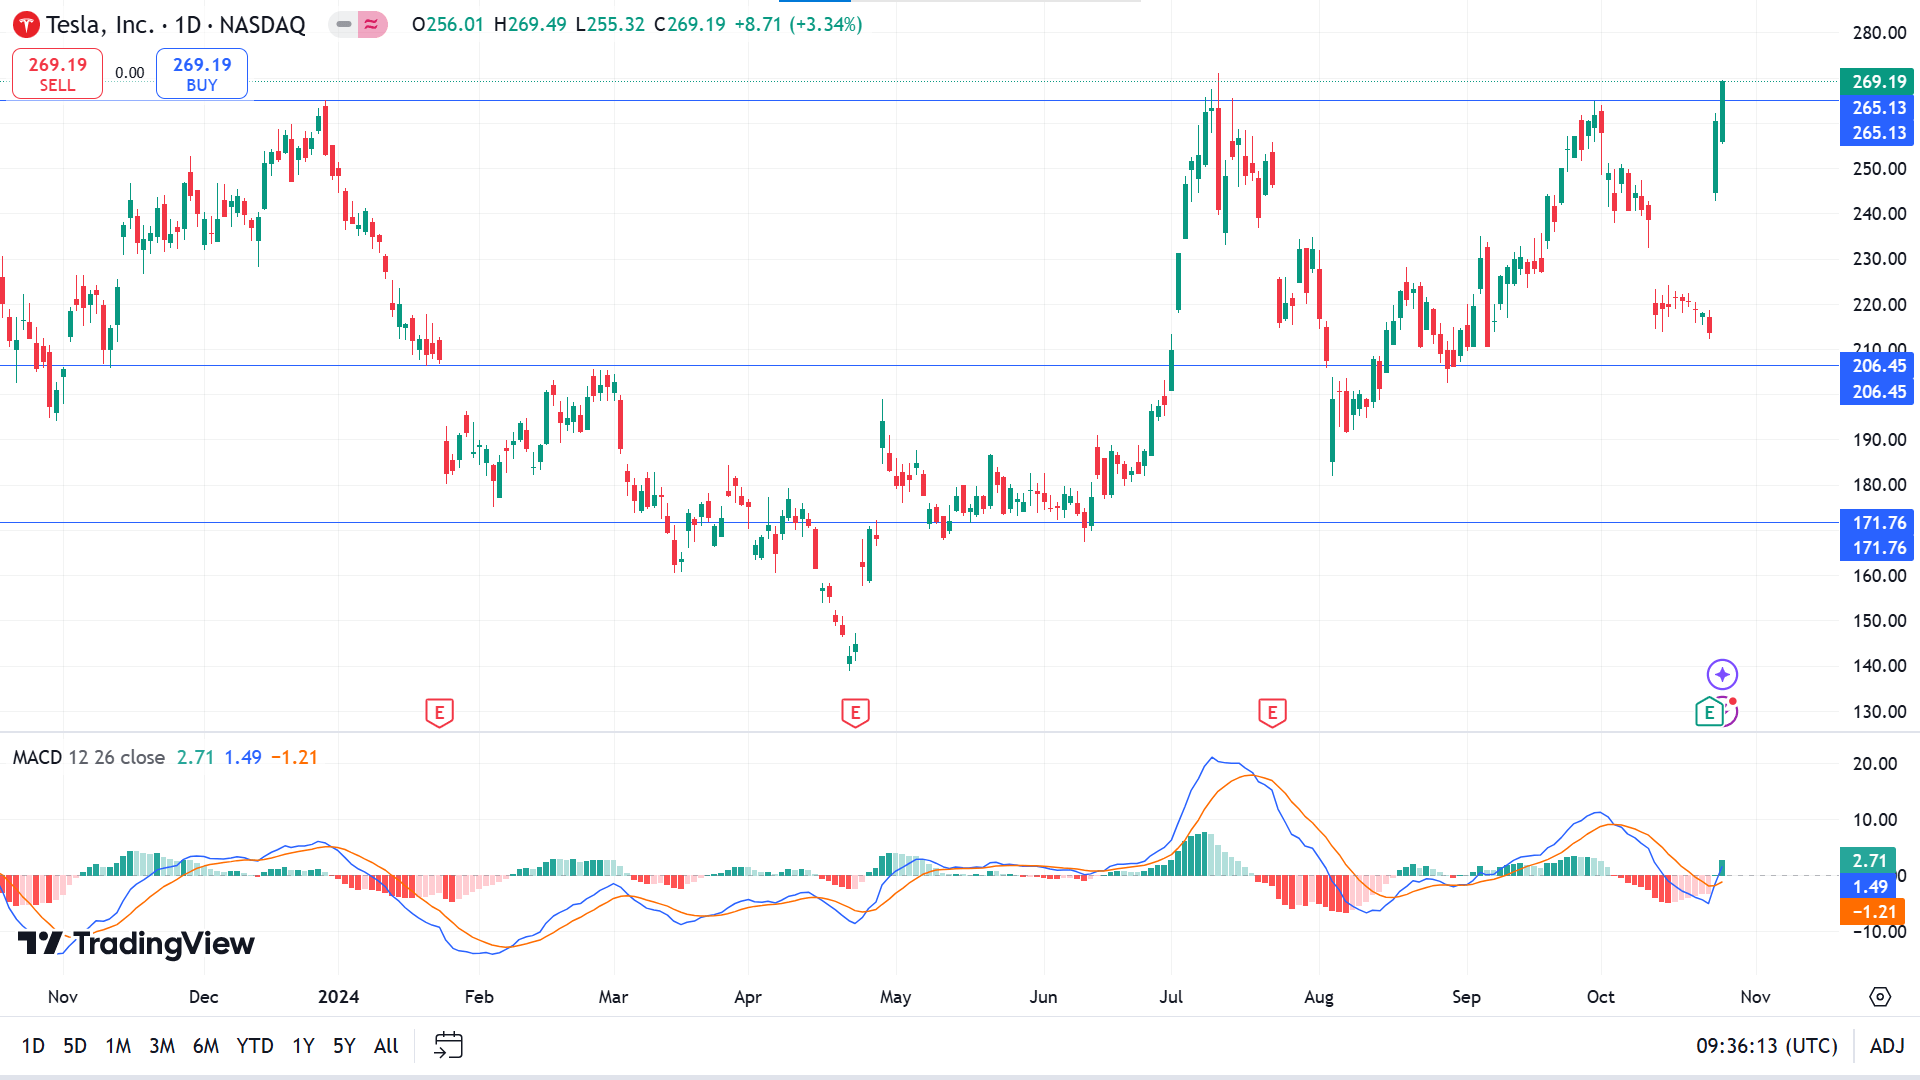
On the daily chart, the price reaches above the previous peak due to the bullish pressure. The MACD indicator window shows dynamic lines creating a new bullish crossover, and a green histogram bar appears above the midline of the indicator window. If the bullish pressure sustains, the price may hit the primary resistance near 288.52, followed by the next resistance near 312.35.
Meanwhile, if the recent breakout isn't sustained or the MACD reading turns bearish, the price can drop back to the primary support at around 234.17, followed by the next support at around 206.45.
Nvidia Stock (NVDA)
Fundamental Perspective
Nvidia (NVDA) shares surged over 4% on Monday, reaching a new high of $143.71, just days after its last record. Driven by skyrocketing AI chip demand, Nvidia's stock has nearly tripled this year.
Analysts remain optimistic, with 21 of 22 analysts assigning a “buy” or equivalent rating. Their consensus price target stands at $154.19, suggesting over 7% potential upside.
Last week, Bank of America raised its target for Nvidia to $190, calling it a “top AI pick.” This boost followed CEO Jensen Huang's comments that demand for Nvidia's Blackwell AI chips is “insane,” highlighting the company's continued leadership in AI.
Technical Perspective
The price reaches the ATH posting consecutive gaining weeks, enabling the possibility that the next candle might be another green one.
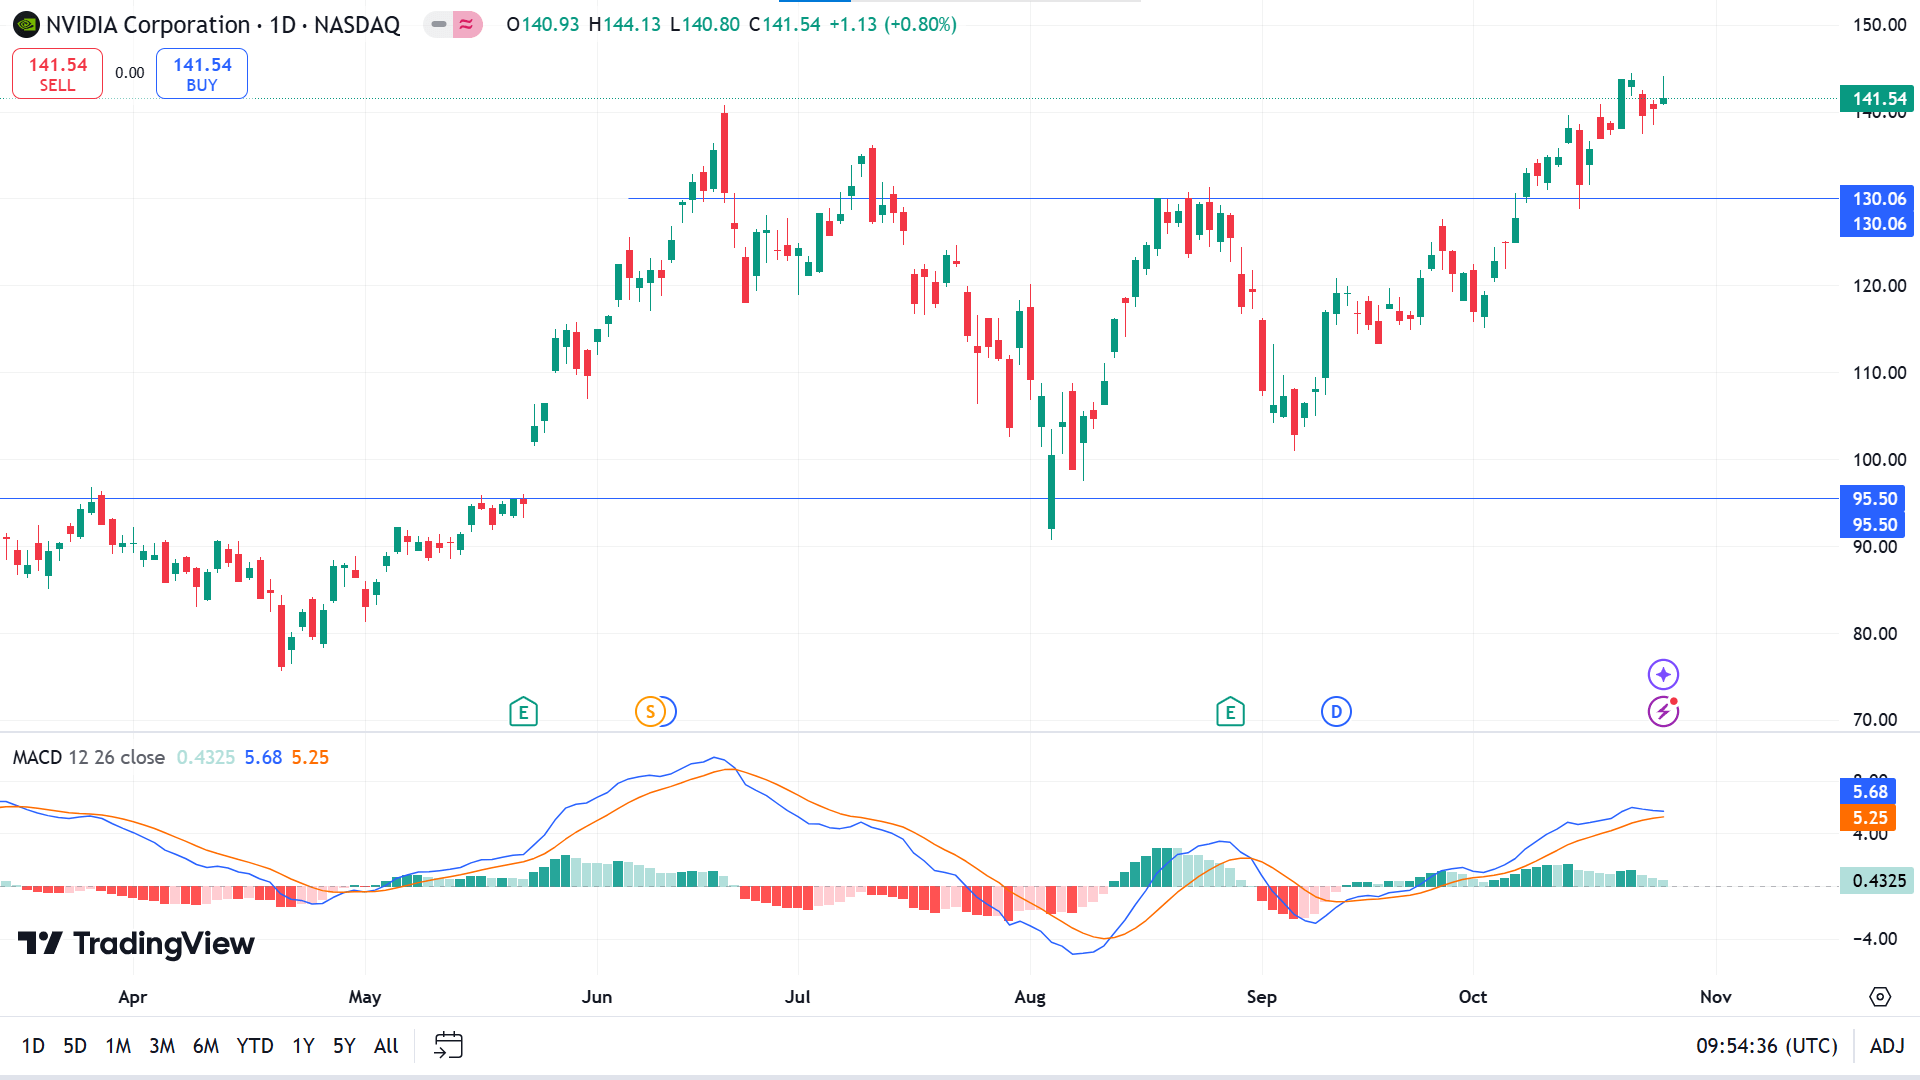
On the daily chart, the price remains in a straight bullish trend as the MACD indicator window conforms through dynamic signal lines moving upward and green histogram bars above the midline of the indicator window. According to the reading, the price can hit the primary resistance of 143.40, and a breakout can drive the price toward a possible resistance near 170.12.
Meanwhile, if the bullish pressure is not sustained as the green histogram fades and the MACD reading turns bearish, the price can decline back to the primary support near 130.06, which can extend to the next possible support near 116.09.
WTI Crude Oil (USOUSD)
Fundamental Perspective
Crude oil prices ticked higher on Friday amid reports that U.S. Secretary of State Antony Blinken is working to bring Israel and Iran to the table for ceasefire negotiations. With the U.S. presidential election on November 5, the Biden administration is ramping up diplomatic efforts, aiming for a potential ceasefire that could enhance both the administration's and the Democratic Party's positioning.
The U.S. Dollar Index (DXY) softened further following underwhelming U.S. Durable Goods data for September and in anticipation of the final October consumer sentiment reading from the University of Michigan. The DXY's close could signal next week's trend, especially given the uncertainties around the election outcome.
The International Energy Agency (IEA) cautioned that global oil demand growth may slow due to China's economic deceleration and rising adoption of electric vehicles. Market focus will turn to Q3 earnings reports next week from key oil players, including BP, Shell, Chevron, ExxonMobil, PetroChina, Sinopec, and TotalEnergies. Additionally, Eni's recent CPC Blend sale to ExxonMobil underscores a problematic year for oil refiners, according to Neste's CEO.
Technical Perspective
The last weekly candle closed green, recovering approx. Half of the previous week's loss validates the support level and may continue to gain in the upcoming weeks.
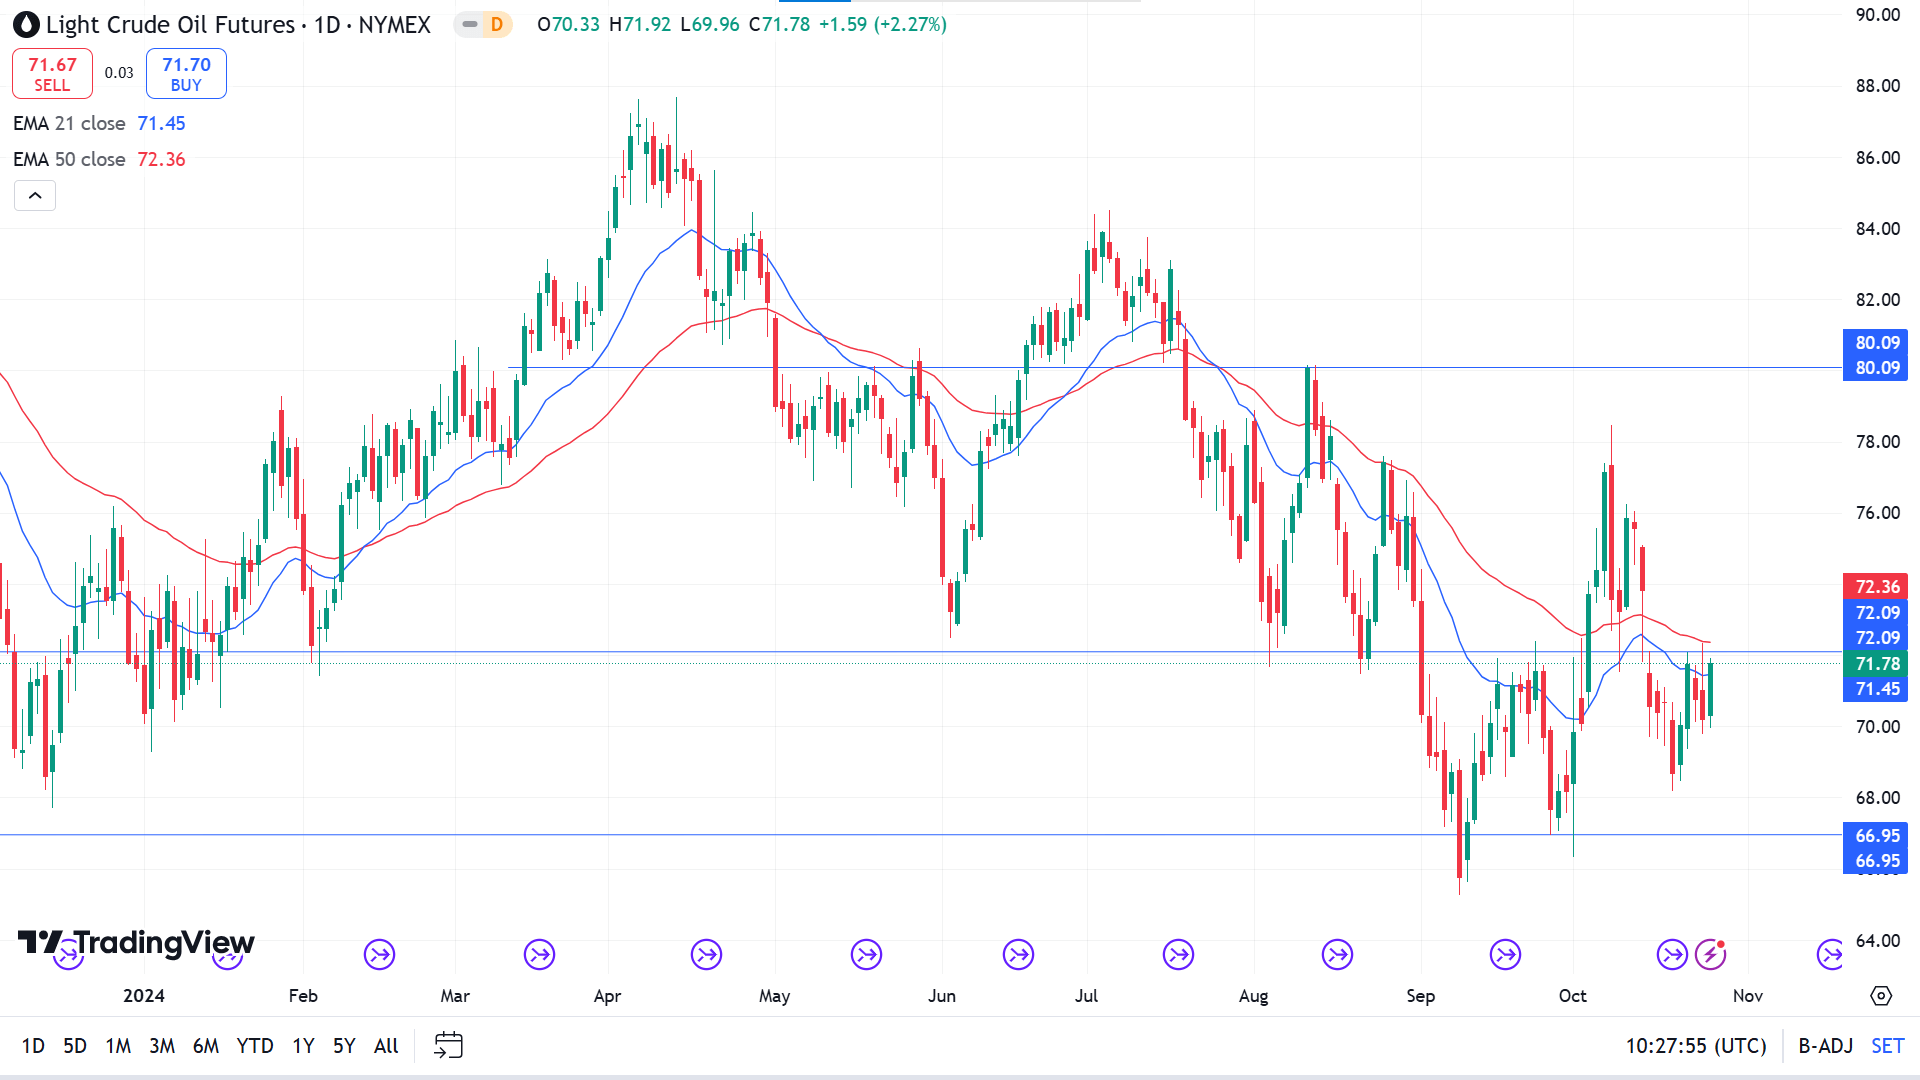
On the daily chart, the price floats between the EMA 21 and EMA 50 lines, leaving mixed signals to the investors. If the price continues to exceed the EMA 50 line, it will declare significant bullish pressure, which may drive the price toward the primary resistance of 75.01, followed by the next resistance near 80.09.
Meanwhile, if the price declines below the EMA 21 line, it will declare sufficient bearish pressure, which may lead the price to the primary support near 69.71, followed by the next support near 66.95.


