EURUSD
Fundamental Perspective
The EURUSD pair climbed back above 1.1150 level, recovering the bulk of its intraday losses as the US Dollar weakened after the release of the August Personal Consumption Expenditures (PCE) Price Index. The report showed that inflation gradually aligns with the Federal Reserve's 2% target. Annual PCE inflation increased by 2.2%, slightly below the 2.3% forecast and down from July's 2.5%. Core inflation, which excludes food and energy, rose as expected to 2.7% year-on-year.
The US Dollar Index (DXY) slipped to 100.40, edging closer to its crucial support level of 100.20. This weakening Dollar has boosted the EURUSD pair as investors anticipate further rate cuts from the Federal Reserve. Markets are increasingly confident of a second rate cut in November but remain divided between a 25- and 50-basis-point reduction.
Looking ahead, attention will shift to Fed Chair Jerome Powell's speech on Monday, along with a series of labor market reports and the ISM Purchasing Managers' Index (PMI), which could provide more clarity on the Fed's policy direction and the Dollar's outlook.
Technical Perspective
The last weekly candle doji, with a small green body after a solid green candle, reflects a pause in the current bullish trend, leaving buyers optimistic for the next week.
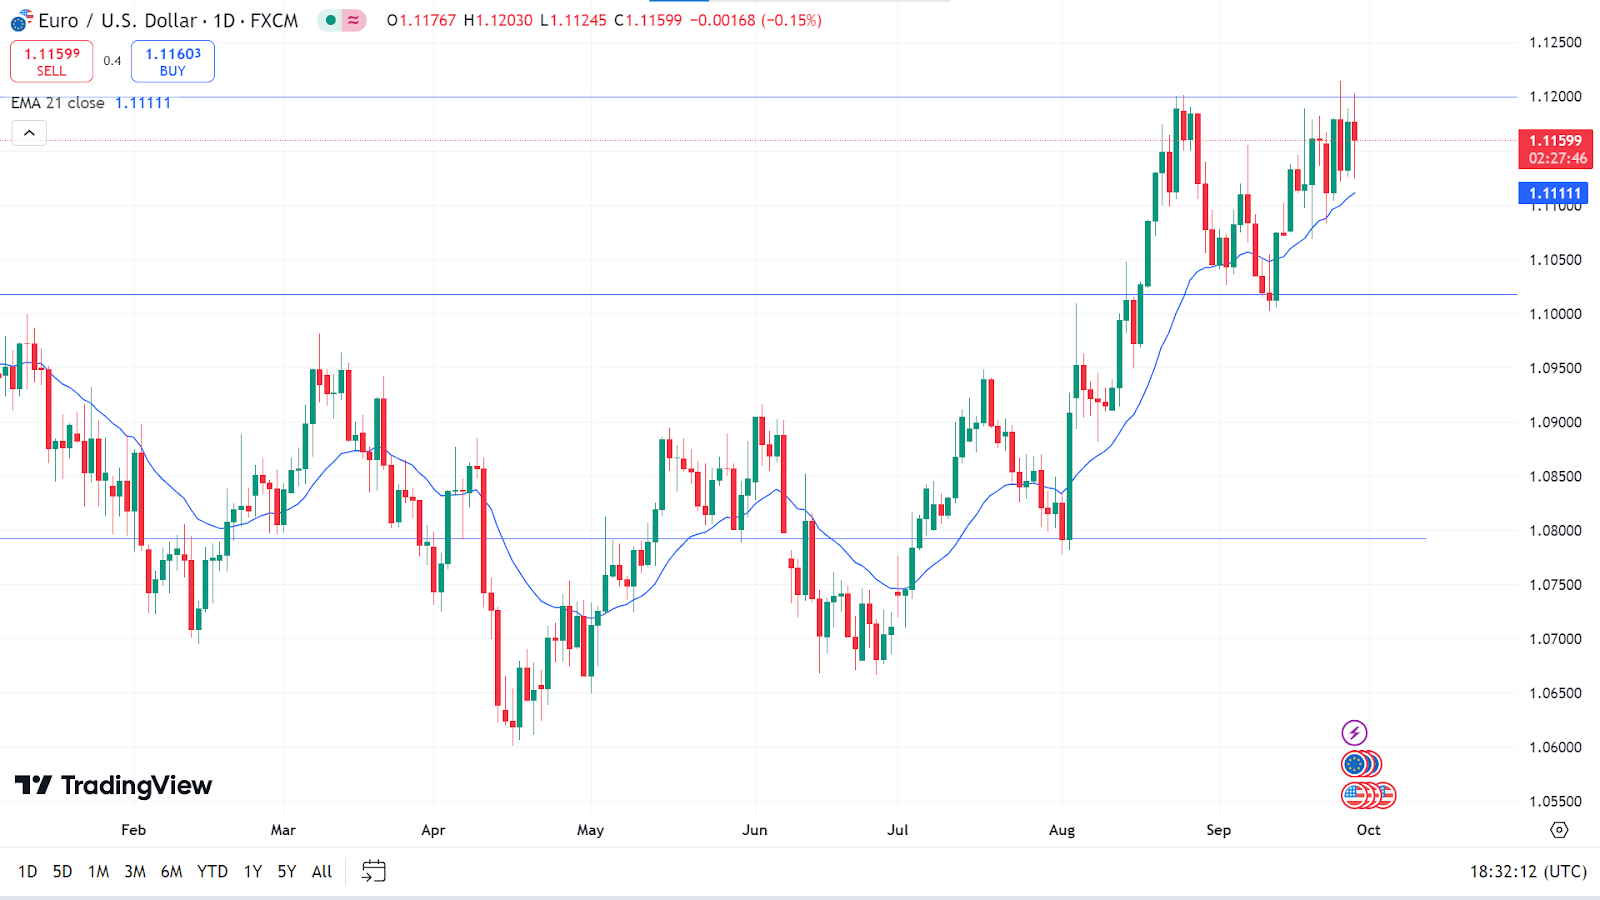
The price is floating above the EMA 21 line, signaling the recent bullish pressure on the asset price. The price may head toward the nearest resistance, 1.1270, followed by the next resistance near 1.1432.
In the meantime, any pause occurs in the current uptrend, and if the price declines below the EMA 21 line, it can reach the primary support near 1.1017, followed by the next support near 1.0882.
GBPJPY
Fundamental Perspective
The Yen's sharp rally reflects market expectations that Shigeru Ishiba's anticipated win as Japan's next Prime Minister could lead to further interest rate hikes by the Bank of Japan (BoJ). Ishiba's previous comments affirming that the central bank is on the "right policy track" with its current rate hikes have fueled these expectations.
Globally, positive risk sentiment persists amid hopes that rate cuts will drive economic growth. Investor confidence has been bolstered by the People's Bank of China (PBOC) introducing new stimulus measures, including reducing the seven-day repo rate to 1.5% from 1.7% and lowering the Reserve Requirement Ratio (RRR) by 50 basis points. These actions have enhanced the appeal of riskier assets in the global markets.
At the same time, the expectation is that the Bank of England (BoE) will cut rates, which could prevent significant losses in the GBPJPY pair.
Technical Perspective
The last weekly candle closed inverted hammer with a red body after a solid green candle reflects seller domination and increases the possibility of an upcoming reversal. So, the next candle might be another red one.
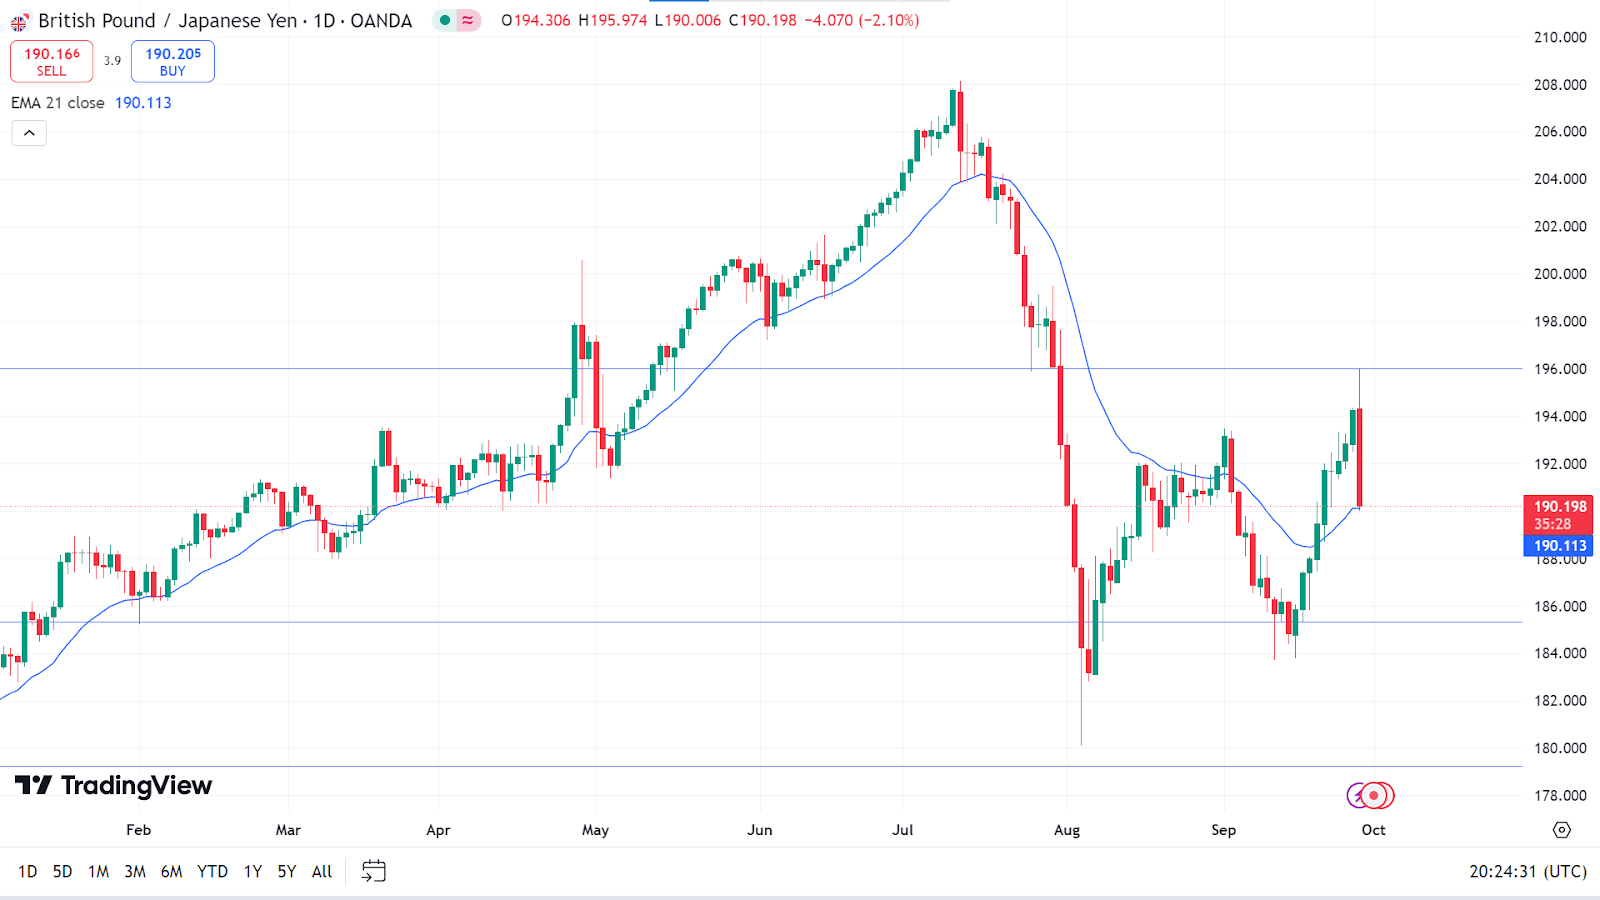
The price declined to the EMA 21 line on the daily chart after reaching an acceptable resistance level. If the price returns from this level, it can regain the peak of 196.00, followed by the next resistance near 201.58.
Meanwhile, if the price drops below the EMA 21 line, it will declare significant bearish pressure on the asset and indicate it can decline to the nearest support of 185.33, followed by the next support near 180.27.
NASDAQ 100 (NAS100)
Fundamental Perspective
In August, the Federal Reserve's preferred inflation gauge, the PCE (personal consumption expenditure) index, increased by 2.2% year-over-year, according to a report from the Commerce Department, while the estimation was 2.3%, following economists' poll by Reuters. The index posted a gain of 0.1% on a month-to-month basis.
Following the data release, the probability of a 50-basis point rate cut in November increased from 50% to 53%. According to the FedWatch Tool from CME Group, the chances of a 25-basis point cut now stand around 47%.
For this week crucial economic releases will come from Carnival Corporation (CCL), Nike Inc (NKE), RPM International (RPM), Constellation Brands Inc (STZ) and Uranium Energy Corp. (UEC).
Technical Perspective
The last weekly candle closed with a small green body and an upper wick. It posted three consecutive gaining weeks, which leaves buyers optimistic for the next week.
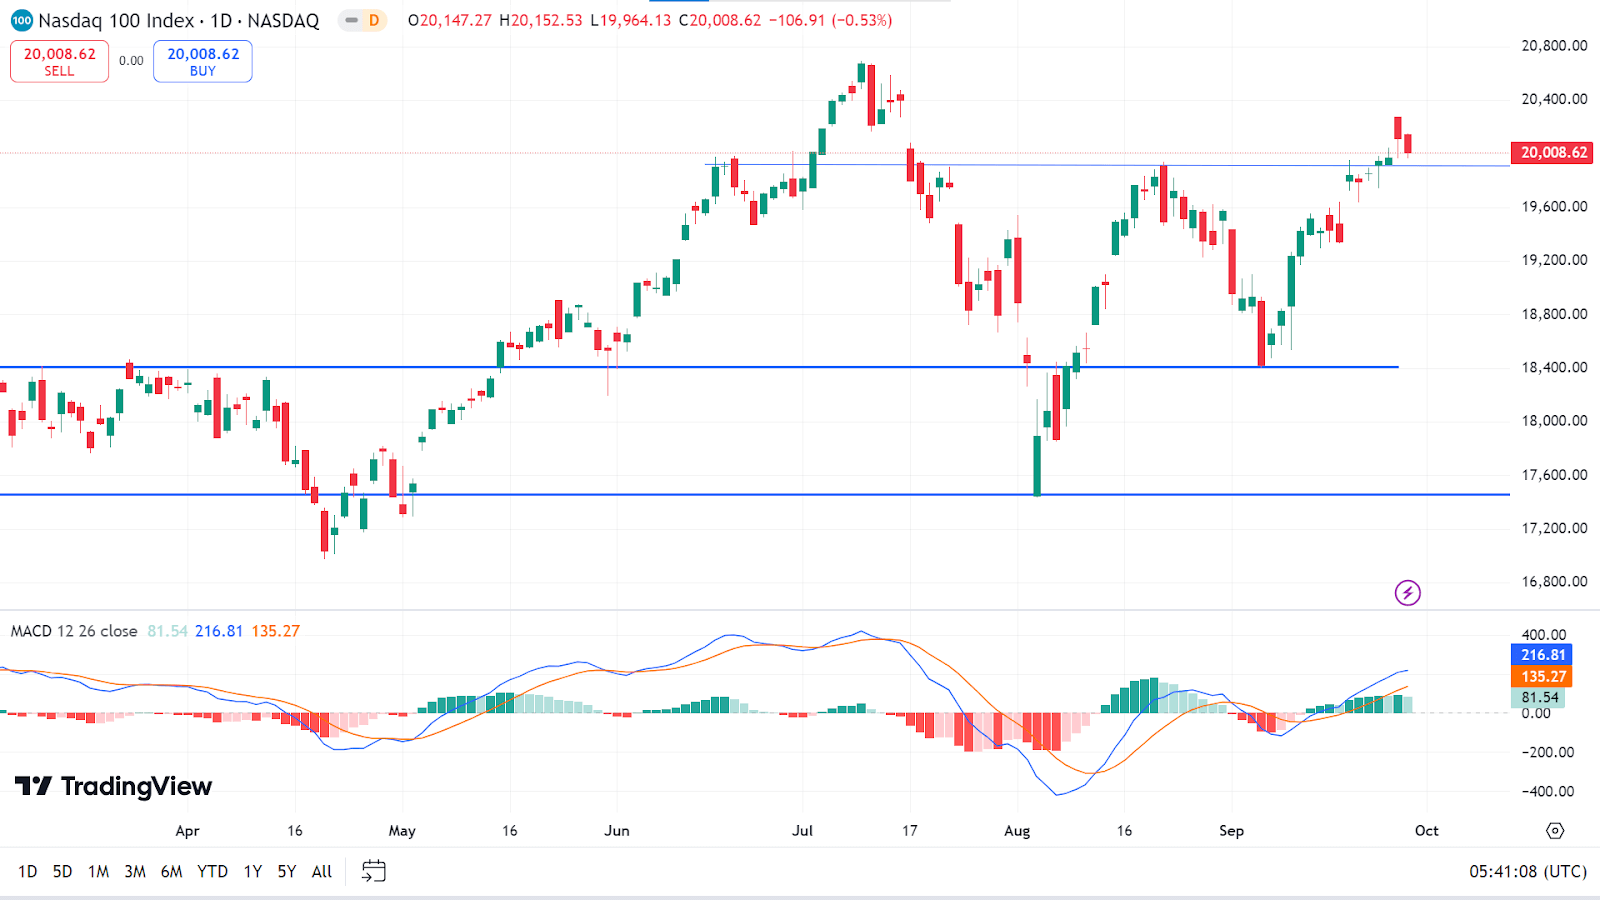
The price reaches the previous peak on the daily chart, and as the MACD indicator window suggests through dynamic signal lines and green histogram bars, it remains on a bullish trend. So, the index price may hit the nearest resistance near 20,530.14, followed by the next resistance near 21,486.48.
Meanwhile, green histogram bars fade at the MACD indicator window, signaling a decrease in bullish pressure. This may trigger the price toward the primary support of 19,553.10, followed by the next support near 18,855.21.
S&P 500 (SPX500)
Fundamental Perspective
A recent economic report shows the August PCE index increased by 0.1%, beating anticipation, while inflation came in at 2.2%, down from 2.5% in July. On a monthly basis, the index surged 0.2% in July.
The Core PCE index, which excludes volatile energy and food, also surged by 0.1% in August, failing to beat the anticipated 0.2%, which followed a 0.2% increase in July. On a yearly basis, the core PCE inflation increased slightly to 2.7% in August from 2.6% in July.
Meanwhile, the University of Michigan's consumer sentiment index was revised in September to 70.1, exceeding the expected 69.4 and improving from the preliminary reading of 69. This also marked an increase from August's final figure of 67.9. Survey respondents forecasted a 2.7% inflation rate for the coming year, a decrease from 2.8% in August, while five-year inflation expectations rose to 3.1% after remaining at 3% for five consecutive months.
eMost US Treasury yields declined, with the 10-year yield dropping by 3.7 basis points to 3.75% and the two-year yield falling 5.4 basis points to 3.57%.
Technical Perspective
The weekly chart shows three consecutive gaining candles, reflecting optimism that the next candle might be another green one.
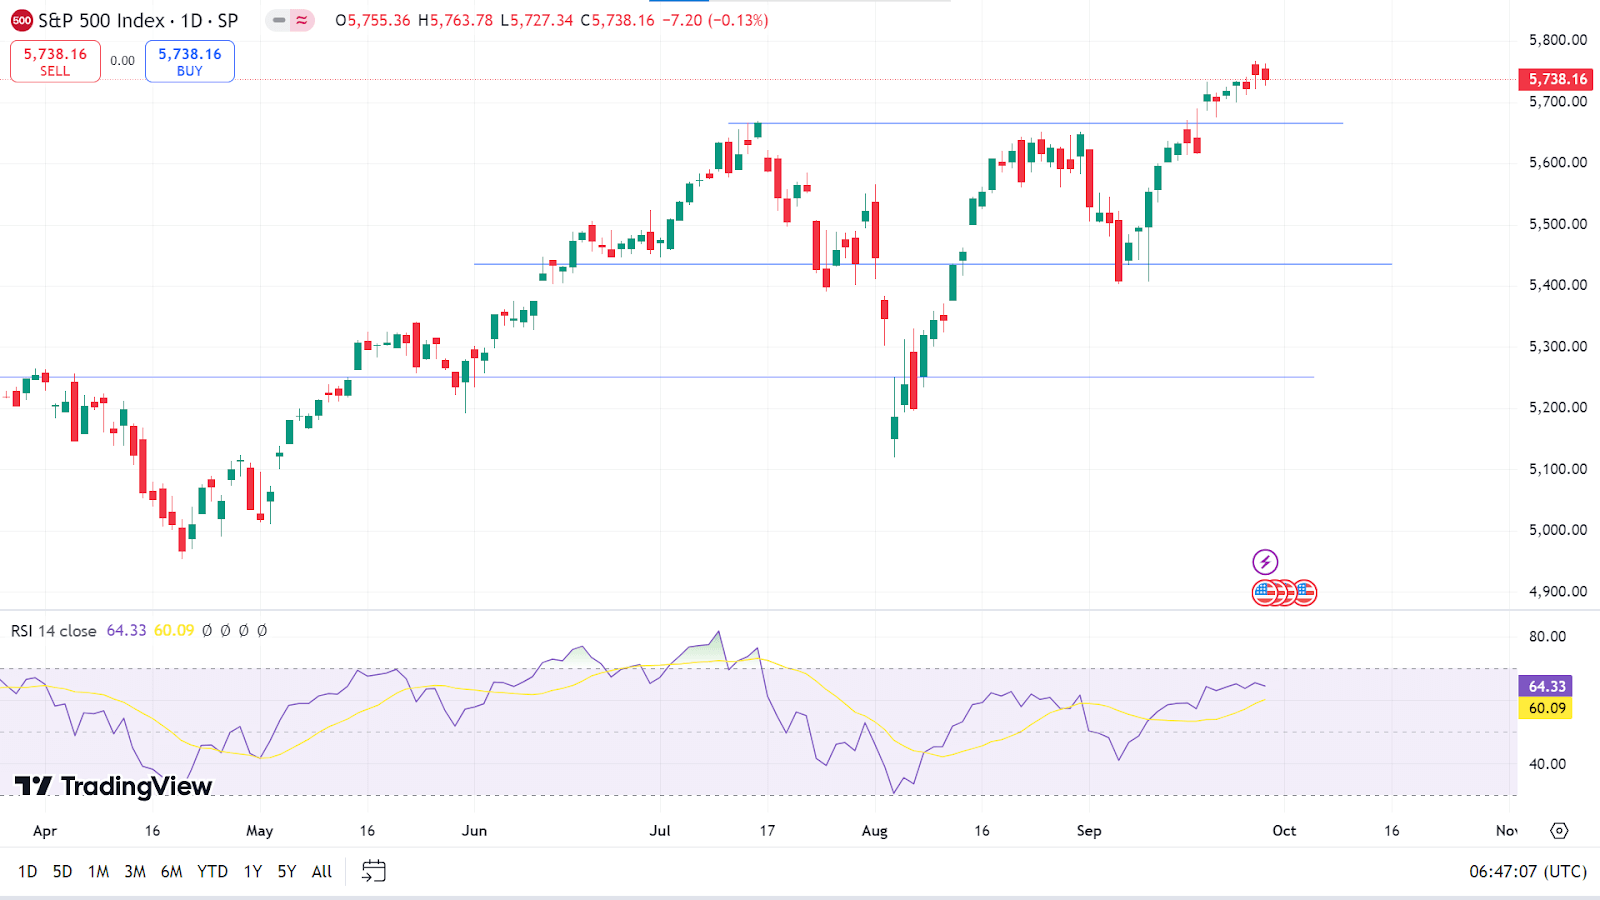
The RSI indicator window confirms that the price remains in a bullish trend on the daily chart as the dynamic signal line moves closer to the upper line of the indicator window. So, the price may hit the possible resistance of 5,802.09, followed by the next resistance near 6,005.45.
Meanwhile, if a pause comes in the current uptrend or the dynamic signal line of the RSI indicator window edges lower, the price may decline toward the primary support of 5665.46, followed by the next support near 5,528.21.
Bitcoin (BTCUSD)
Fundamental Perspective
Bitcoin (BTC) has risen roughly 3% this week, surpassing the critical resistance level of $64,700. This upward momentum has been driven mainly by strong institutional interest in Bitcoin ETFs, which recorded over $612 million in inflows. While some analysts believe the broader macroeconomic environment will continue to bolster risk assets like Bitcoin, others see signs of ongoing consolidation. From a technical standpoint, bulls are in control, with the following primary resistance target at $70,000.
Institutional demand has been a significant factor in Bitcoin's recent performance. Data from Coinglass shows that US spot Bitcoin ETFs saw inflows for four consecutive days through Thursday, totalling $612.60 million. The total Bitcoin reserves held by these ETFs increased from $50.53 billion to $51.15 billion, marking their highest levels since July.
QCP Capital's report highlights several macroeconomic developments supporting risk assets. The People's Bank of China (PBoC) introduced measures to boost its struggling housing and equity markets. At the same time, the widening yield spread between 2-year and 10-year US Treasury notes indicates optimism for future economic growth, benefiting risk assets.
On the US front, Kamala Harris' supportive remarks on AI and digital assets and the SEC's approval of options trading on BlackRock's Spot BTC ETF underscore rising institutional interest in the digital asset space.
Technical Perspective
The weekly chart gives insights into the next possible candle, which might be another green one. The indication comes through chart patterns and candle formation.
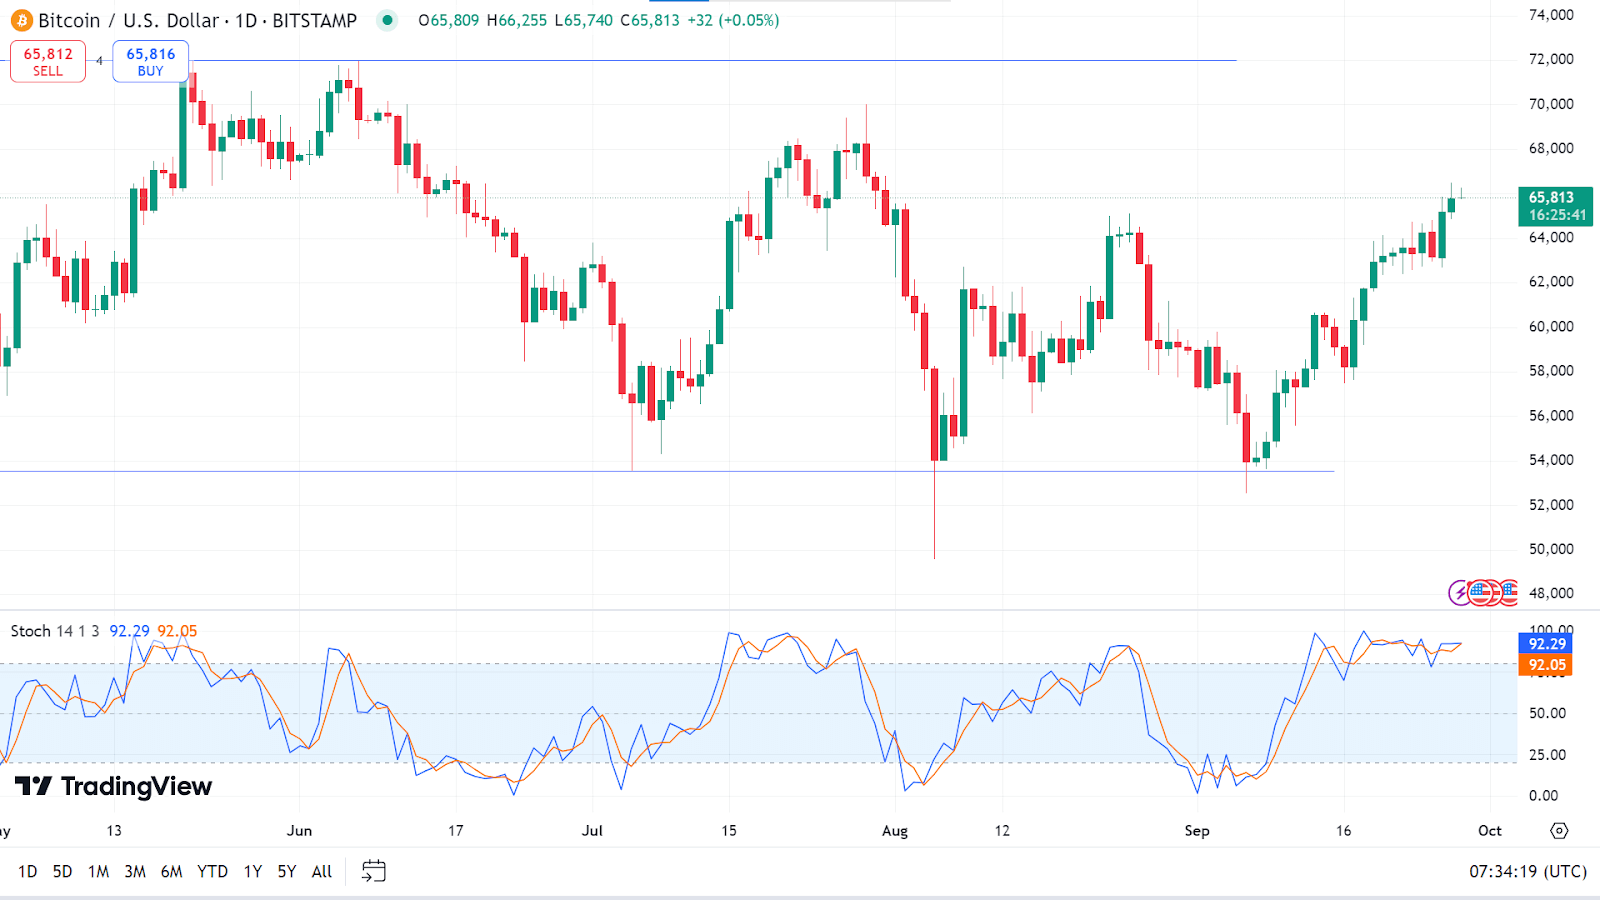
As the Stochastic indicator window suggests, the price moves in a straight uptrend on the daily chart through dynamic lines floating above the upper line of the indicator window. So, the price may head to regain the previous resistance of 68,479, followed by the next resistance near 72,000.
In contrast, if the dynamic signal line of the Stochastic indicator window gets below the upper line of the indicator window and continues to slope downward, the price can retouch the previous support of 60,717, followed by the next support near 57,613.
Ethereum (ETHUSD)
Fundamental Perspective
Ethereum (ETH) is trading at $2,673, increasing 10% over the past ten days. This recent rally marks a recovery from its decline after the crash of August 5. With this recent rally, many are questioning whether Ethereum will hit $3,000 in October.
From both technical and on-chain analysis, the probability of Ethereum reaching the psychological level of $3,000 is high. Historical trends for October and the fourth quarter generally favor a bullish outlook for the crypto market, increasing the likelihood of ETH exceeding $3,000 and potentially approaching the $3,500 resistance. However, a short-term correction is possible before this upward movement continues.
Three factors drive today's 1.71% increase: Bitcoin's recent breakout to $65,000, pulling altcoins like Ethereum up; the end of the bearish third quarter; and month-end volatility, which has boosted ETH in recent days.
Despite this positive momentum, on-chain metrics suggest caution. Santiment's 30-day Market Value to Realized Value (MVRV) ratio at 6.5% signals a possible reversal, as past entries into the 6-10% range have led to price corrections. While Ethereum could reach $3,000, a short-term pullback is likely.
Technical Perspective
The weekly chart reflects recent bullish pressure through two consecutive gaining weeks, leaving buyers optimistic for the next week.
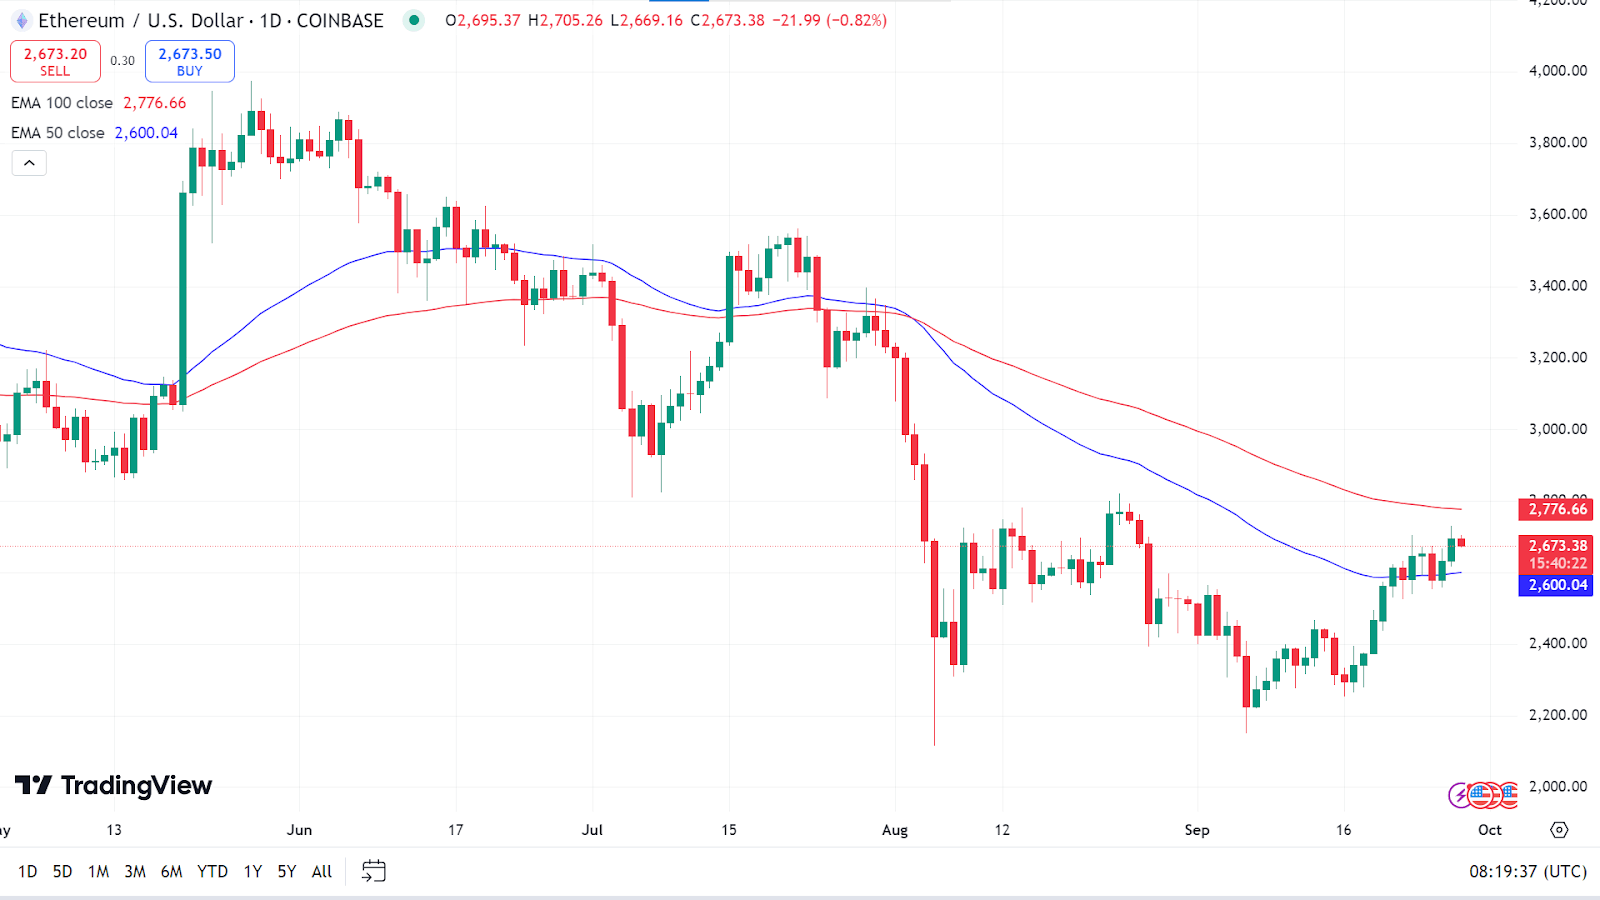
When writing, the price is floating between the EMA 50 and EMA 100 lines on the daily chart, which leaves mixed signals for investors. If the price exceeds the EMA 100 line, it can hit the psychological resistance of 3.053.77, followed by the next resistance near 3,319.54.
However, if the price declines below the EMA 50 line, indicating significant bearish pressure, it may head toward the primary support of 2,485.32, followed by the next support near 2,331.92.
Gold (XAUUSD)
Fundamental Perspective
XAUUSD reached record highs just below $2,700 per ounce. This upward momentum has been fueled by several factors: expectations of additional interest rate cuts by the Fed in the coming meetings and through 2025, ongoing geopolitical concerns primarily involving the Middle East and the Russia-Ukraine conflict, and the continued weakening of the US Dollar.
As the US Dollar faces its third consecutive week of losses, gold prices are poised for their third week of gains. Since late June, investors have increasingly favored gold due to rising expectations of Fed rate cuts, including a notable 50-basis-point reduction in September. Despite this, market participants still anticipate around 75 bps of additional cuts by the end of the year, with further reductions of 100-125 bps expected by the close of 2025.
While the $3,000 mark for gold seems within reach, overbought market conditions may lead to a short-term correction, creating opportunities for cautious investors. Additionally, geopolitical risks, especially the Israel-Hamas crisis and the protracted Russia-Ukraine war, continue to increase demand for gold as a safe-haven asset.
Technical Perspective
A range breakout occurred on the weekly chart, and since then, XAUUSD has posted consecutive winning candles, which leaves buyers optimistic for the next week.
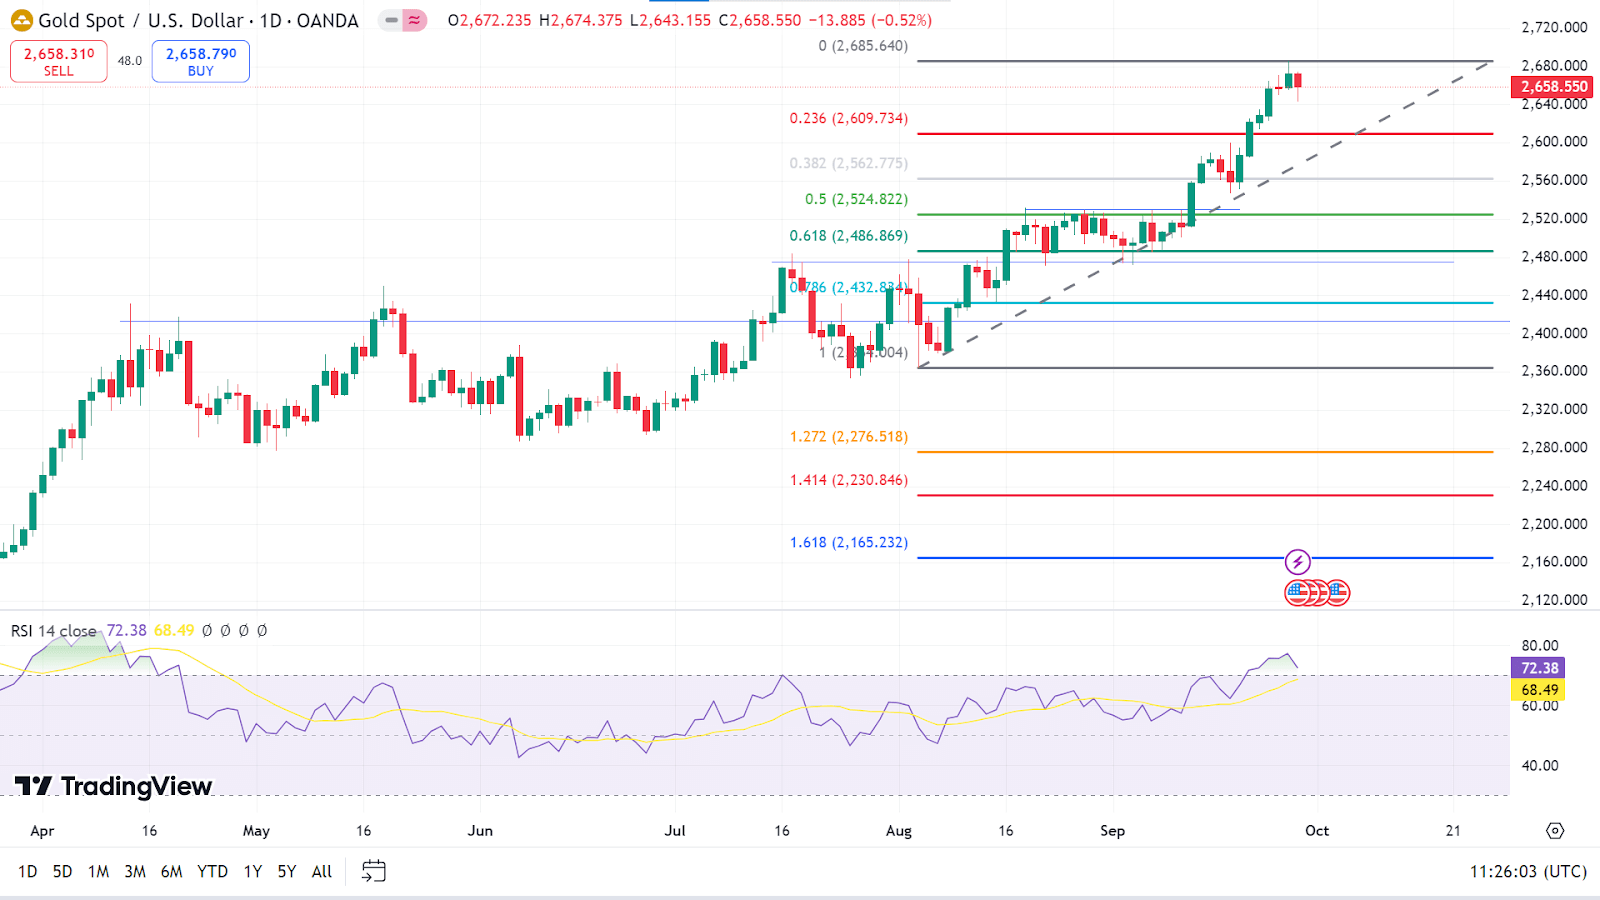
The RSI indicator window shows a fresh bearish initiation through the dynamic signal line edging downside, although it remains above the upper line, declaring an overall bullish trend. So, any correction on the current uptrend may guide the price to reach the primary support of 2,609.73. However, any breakout might cause the price to decline further toward 2534.82.
In the meantime, the price remains on a bullish trend for a considerable period; with consecutive bullish pressure, XAUUSD can beat the ATH of 2,685.64, followed by the next possible resistance near 2,801.26, according to the Fibonacci reading.
Tesla Stock (TSLA)
Fundamental Perspective
Tesla (TSLA) stock saw its first decline in four days despite positive sentiment around third-quarter deliveries and the upcoming Robotaxi event on October 10. The broader market's early rally, fueled by China's new stimulus measures, provided initial support, but the momentum faded later.
Over the past month, Tesla shares have gained more than 20%, driven by various factors. The Federal Reserve's interest rate cut on September 18 has been a key contributor, as lower rates make car payments more affordable, boosting demand. Since the rate cut, Tesla's stock has climbed nearly 12%.
Wall Street's delivery expectations for the third quarter have also contributed to the stock's strength. Analysts project Tesla will deliver around 460,000 cars, a 6% increase year-over-year, with substantial numbers in China. Deutsche Bank's Edison Yu expects deliveries to meet or exceed this estimate and maintains a Buy rating with a $295 price target.
Anticipation for Tesla's Robotaxi event, where the company is expected to unveil a robotaxi and discuss its self-driving taxi service, has also supported the stock. Analysts remain cautiously optimistic but emphasize Tesla still has much to prove in fully autonomous vehicles.
Technical Perspective
The weekly chart illustrates that the price has reached near an acceptable resistance level, creating a mixed signal that the next candle can be either red or green, depending on the market context. According to the current candlestick pattern, a green candle is possible.
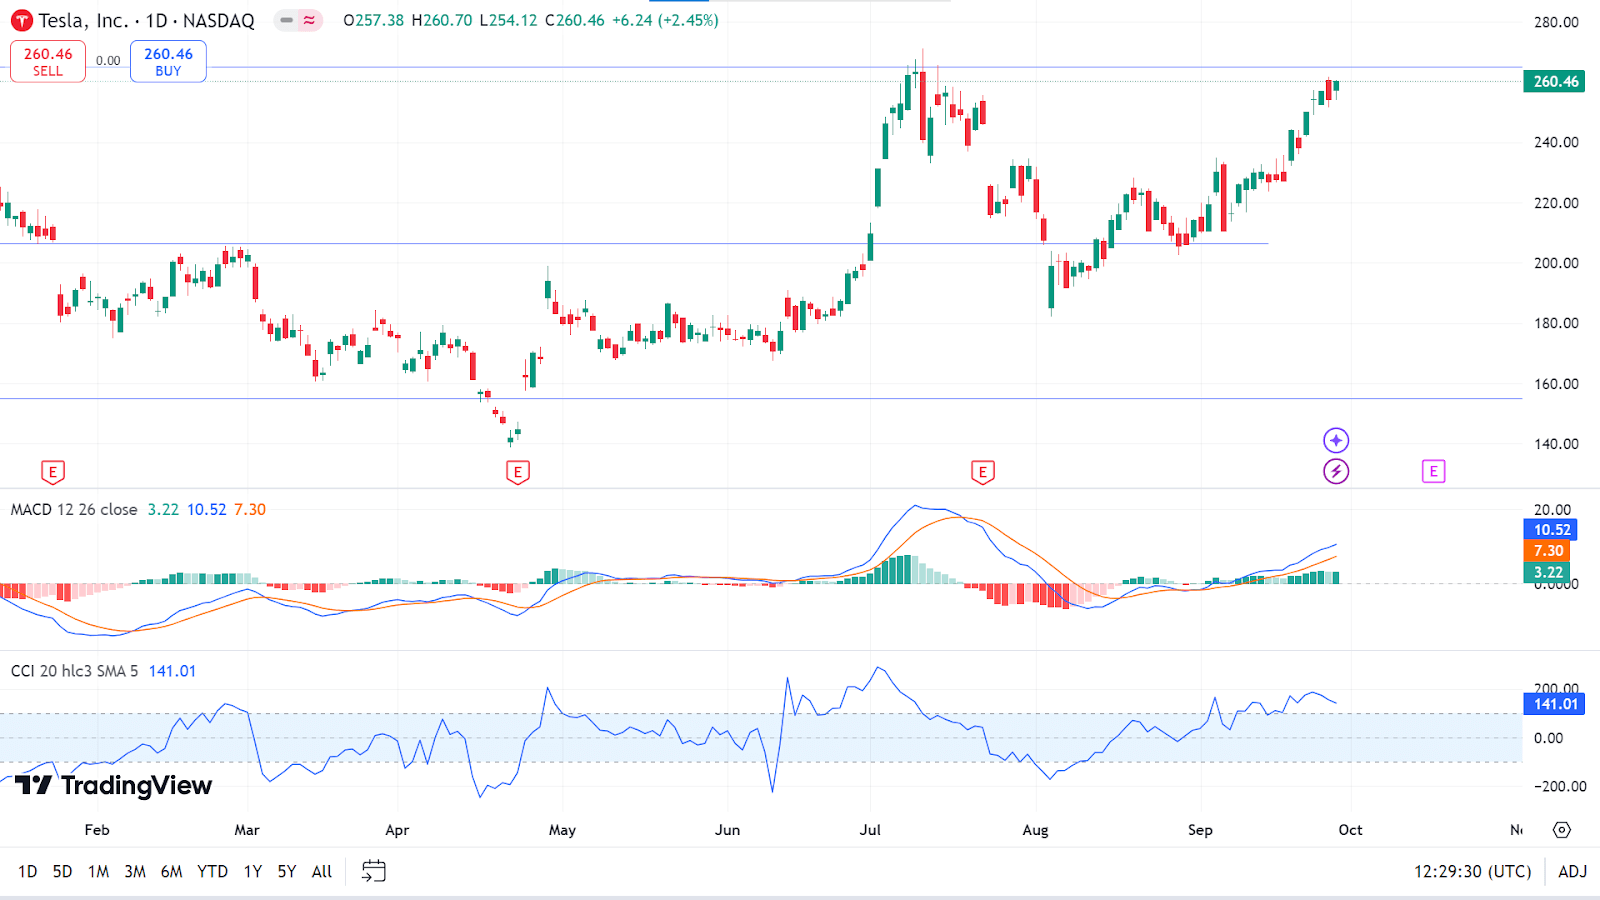
The MACD indicator window shows current bullish pressure toward the previous resistance of 265.13, whereas a breakout can trigger the price toward the next resistance near 299.29.
In the meantime, the CCI indicator signals differently through the signal line edging downward, indicating possible retracement from the resistance of the current range as the signal line slopes downward. If the dynamic signal line reaches below the upper line of the indicator window, the stock price can drive the price toward the nearest support near 228.46, followed by the next support near 206.45.
Nvidia Stock (NVDA)
Fundamental Perspective
While broader U.S. markets continue to set new highs, Nvidia (NVDA) stock remains below the record levels reached in June, when its market cap briefly exceeded $3 trillion. Although Nvidia has rebounded from its August dip and regained its $3 trillion valuation, those June highs remain out of reach.
Despite this, analysts remain highly bullish on NVDA. Since May 2023, Nvidia's exceptional performance has repeatedly prompted sell-side analysts to raise their price targets. After the company's solid fiscal Q2 earnings, several brokerages further increased their targets, a trend that has become routine for the chipmaker under CEO Jensen Huang.
Of the 40 analysts covering Nvidia, 35 rate the stock as a “Strong Buy,” while 2 label it a “Moderate Buy.” Only 3 analysts recommend holding NVDA. The average target price for Nvidia is $149.47, suggesting an upside of more than 20% from recent levels. Rosenblatt's most optimistic target projects a potential increase of 61% to $200.
As Nvidia enters the year's final quarter, its stock's movement will largely depend on continued earnings strength, robust demand in the semiconductor sector, and the broader market dynamics that have shaped its exceptional run.
Technical Perspective
The weekly chart reveals the price reaches just below the previous peak, and the bullish pressure may lose power as the last candle ended green but with an upper wick, indicating the next one might be red.
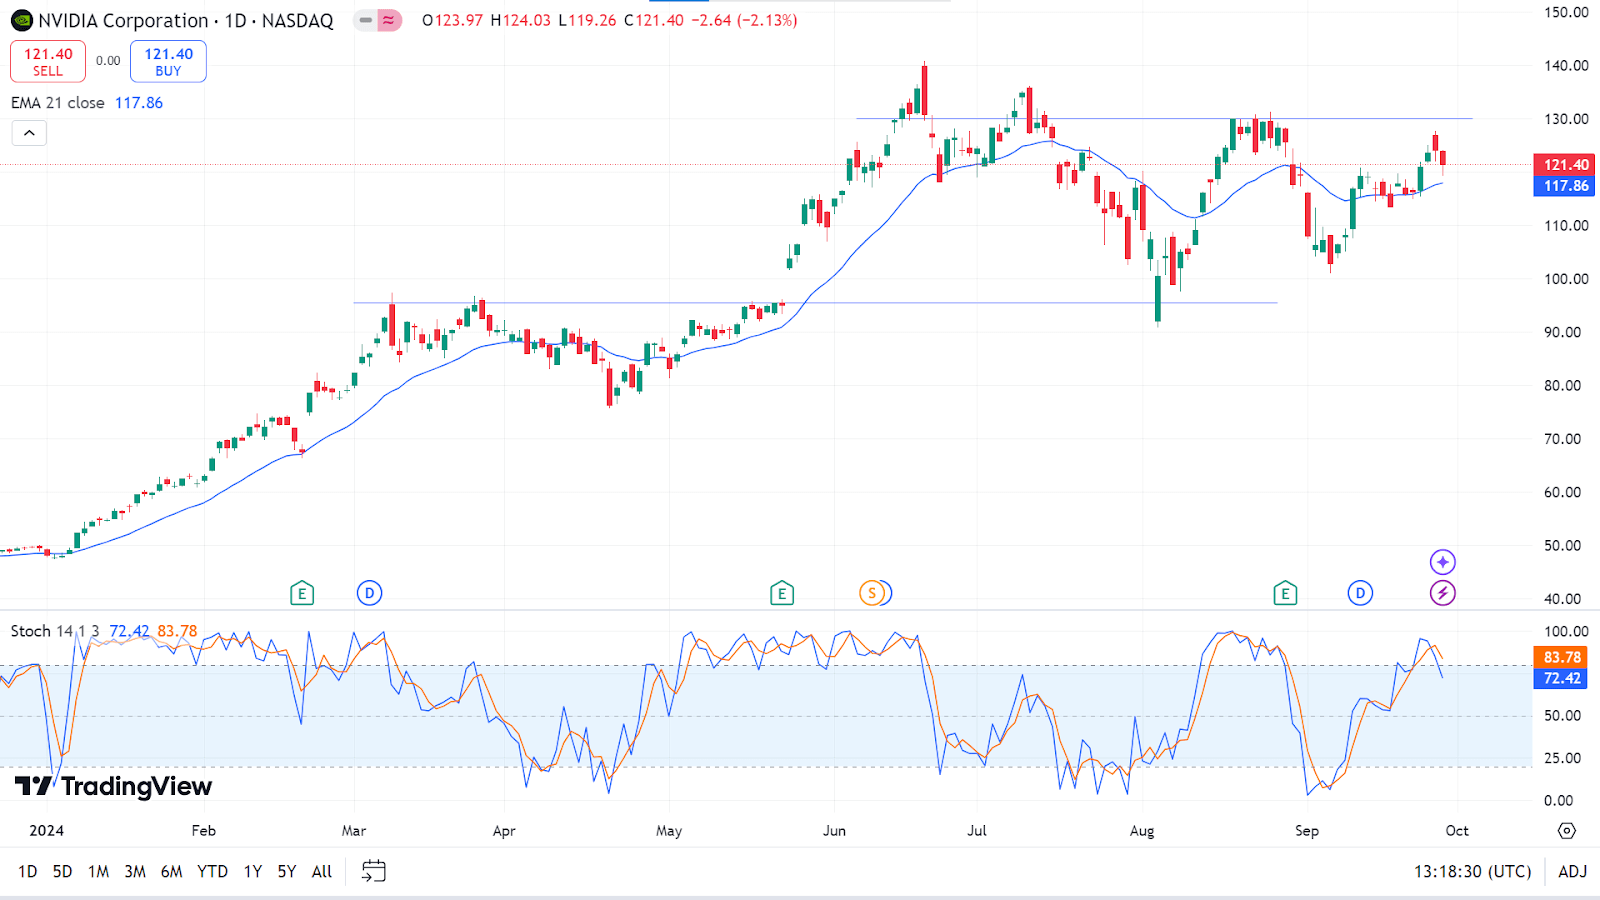
The price is moving above the EMA 21 line, reflecting the current bullish trend, while the Stochastic indicator window suggests fresh bearish pressure with the dynamic signal lines heading downward. According to the EMA 21 reading, the price may hit the previous resistance of the range near 130.06. In comparison, a breakout can trigger the price to the next resistance near 140.44 or above.
However, as the Stochastic reading suggests, fresh bearish pressure can develop if the dynamic signal lines of the indicator window continue to drop toward the midline of the indicator window. The price can then decline toward the primary support near 109.32, followed by the next possible support near 101.38.
WTI Crude Oil (USOUSD)
Fundamental Perspective
Crude oil is seeing a rebound on Friday, recovering from significant losses earlier in the week. However, the commodity remains on track to close the week in the red. The decline has been influenced by reports that Saudi Arabia, the world's leading oil exporter, may abandon its $100 per barrel target and is considering increasing production. This shift in strategy has led to market adjustments in anticipation of higher supply.
Meanwhile, the US Dollar Index (DXY) is holding steady ahead of the release of the Personal Consumption Expenditures (PCE) Price Index, the Federal Reserve's preferred measure of inflation. The data will provide further insight into the size of the expected interest rate cut in November, with market volatility likely if the PCE figures surpass expectations.
Currently, West Texas Intermediate (WTI) is trading at $67.43, while Brent crude stands at $71.06.
In other developments, Houthi rebels claim to have launched a missile toward Tel Aviv and are targeting ships in the Red Sea. Oil demand in Asia is expected to rise following stimulus measures from the People's Bank of China, while fuel shortages are anticipated in Florida as Hurricane Helene approaches.
Technical Perspective
The candlestick pattern confirms the price may resume a downtrend and leaves sellers optimistic for the next week.
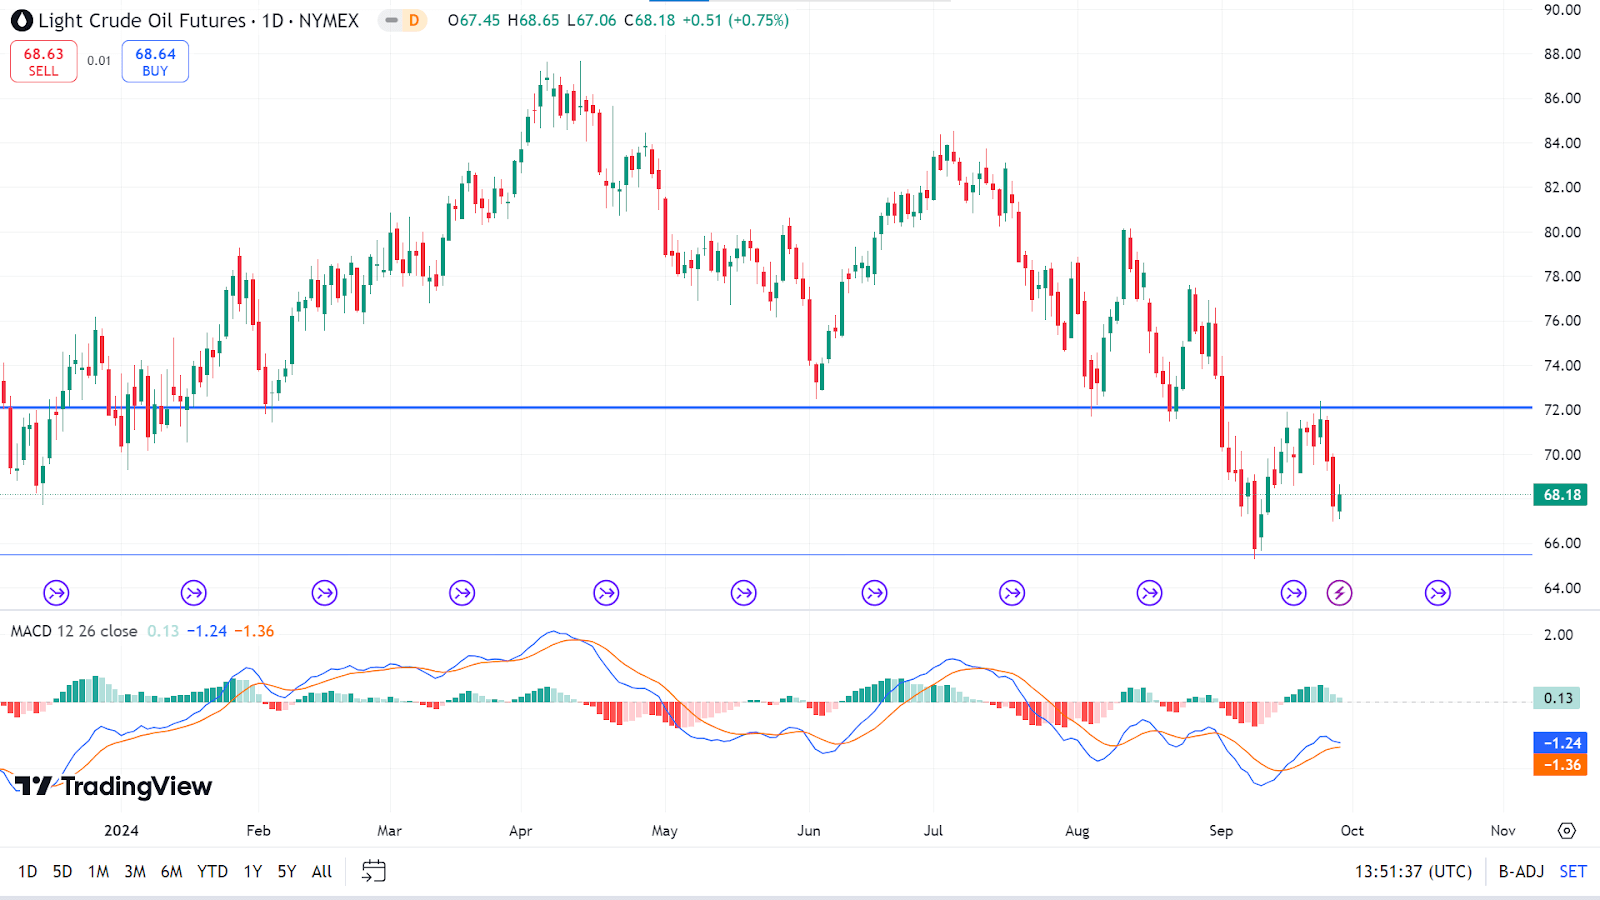
The MACD indicator confirms a bullish trend, although the fading of the green histogram bars reflects that bulls may lose power. If the MACD reading remains bullish, the price can regain the previous resistance, 72.09, followed by the next possible resistance near 77.52.
Meanwhile, if the MACD signal lines edge downward and red histogram bars appear, the price will continue to decline toward the support of 65.47. A breakout may drive the price toward the next possible support near 63.69.


