S&P500 (SPX500)
This week's market performance for the SPX500 (S&P500) is expected to be highly volatile, primarily influenced by upcoming Q2 earnings reports and the PCE Prices report on Friday. The recent surge in the Cboe Volatility Index (VIX) indicates heightened market uncertainty due to overbought technicals, a global IT outage, and political instability.
The tech sector, which experienced significant sell-offs recently, will be in the spotlight with major earnings from companies like GOOG, TSLA, and IBM. Despite some analysts' downgrades and soft guidance from several tech firms last quarter, the near-term oversold condition of tech stocks could lead to snap-back rallies, especially if earnings beat expectations.
Economic data releases, including Existing and New Home Sales, Durable Goods Orders, and Q2 GDP, will also be crucial. Any positive surprises here could buoy market sentiment. However, the PCE Prices report on Friday will be particularly critical as it provides insights into inflation trends and the Fed's potential rate decisions.
The Russell 2000's recent outperformance suggests a rotation into small-caps, which could persist unless mega-cap tech companies deliver strong earnings and raise guidance. If tech giants meet or exceed expectations, it might revive the tech trade and stabilize the SPX500. Overall, expect a volatile week with cautious optimism, especially towards the tech sector.
Source: tradingview.com
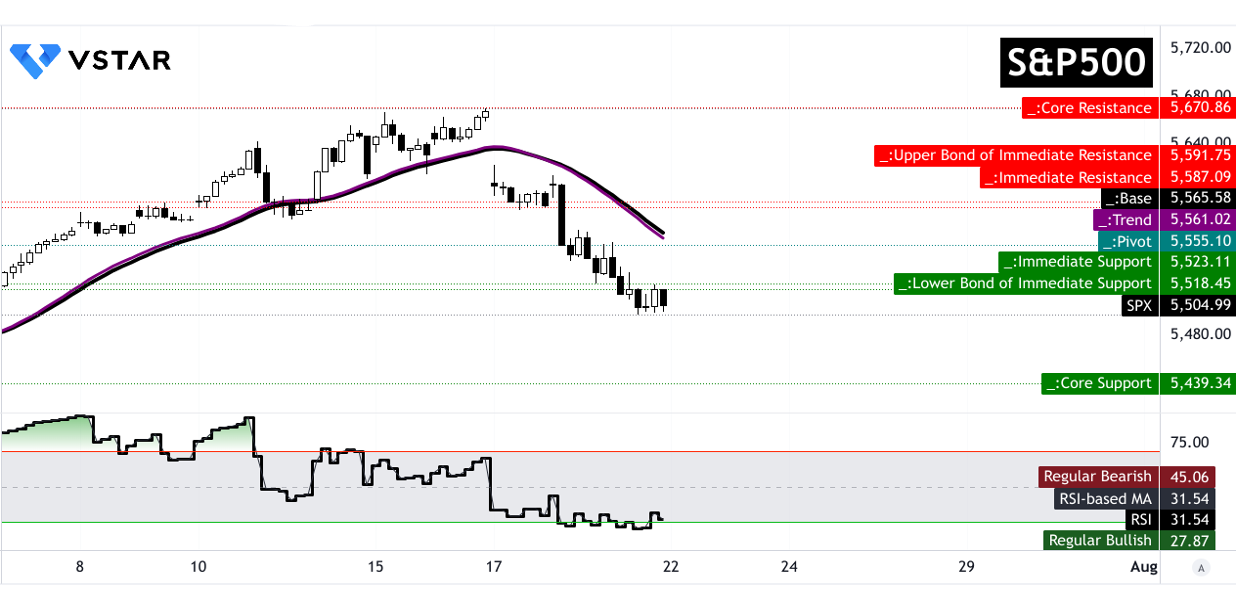
The SPX500 (S&P 500) exhibits a downward price trend with a current value of $5,504.99, below both the trendline ($5,561.02) and baseline ($5,565.58) levels. The average price target for the end of the week is $5,555.00, based on momentum changes over Fibonacci levels. Optimistically, the target could reach $5,670.00, while pessimistically, it could drop to $5,440.00. Key resistance levels are at $5,518.45 and $5,591.75, with core support at $5,439.34. The RSI of 31.54 suggests the market is oversold but moving sideways. Expect volatility with potential snap-back rallies, particularly influenced by upcoming earnings and the PCE Prices report.
Nasdaq 100 (NAS100)
This week, the Nasdaq-100 (NAS100) is likely to face significant pressure due to a convergence of negative factors. Analysts, including Albert Edwards of Societe Generale, are increasingly concerned that the Nasdaq could be poised for a sharp downturn reminiscent of the dot-com bubble burst. The market is currently experiencing a shift from mega-tech stocks—such as the "Magnificent Seven" (Microsoft, Apple, Google, Amazon, Nvidia, Meta, and Tesla)—to smaller-cap stocks, which could exacerbate volatility in the tech sector.
The primary concern stems from deteriorating earnings growth expectations. The Nasdaq's strong performance has been fueled by high expectations for tech earnings, driven by the AI hype. However, forward-looking EPS growth estimates are significantly outpacing actual earnings growth. This discrepancy suggests that the market may have overvalued tech stocks, setting the stage for potential corrections if these earnings expectations are not met.
Moreover, technical indicators are bearish, with the Nasdaq-100 breaking below a key bullish trend line and slipping below the $20K level. This technical weakness, combined with the risk of stricter regulations and rising political risks affecting the tech sector, further increases the likelihood of market turmoil in the near term. As a result, investors should brace for heightened volatility and potential declines in the Nasdaq-100 this week.
Source: tradingview.com
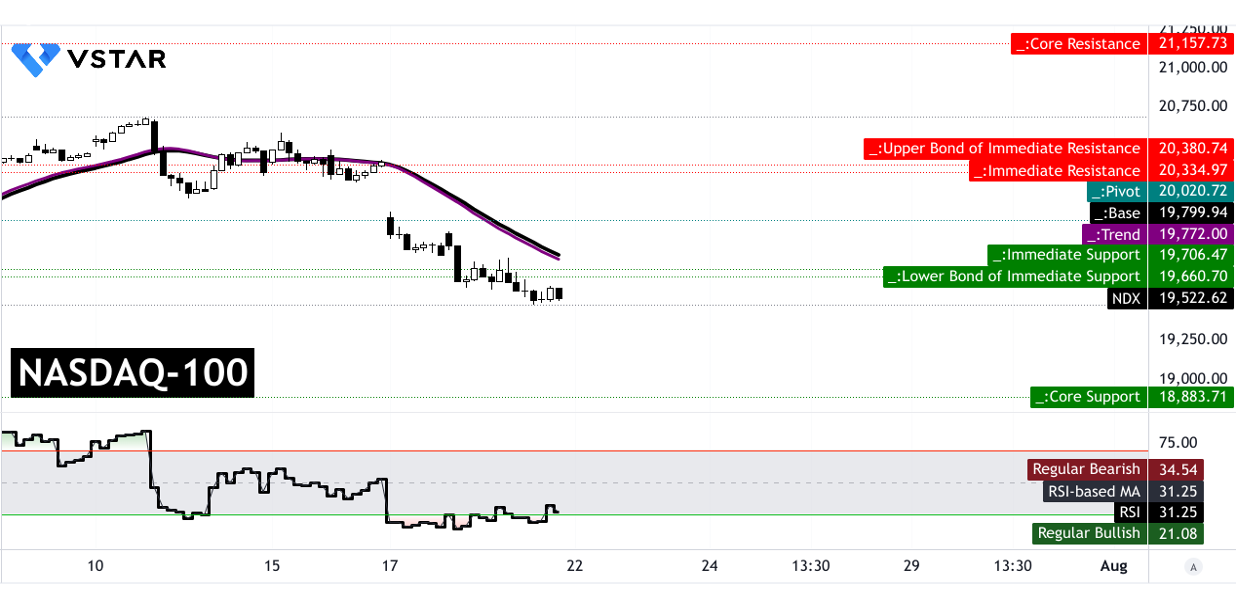
This week, the Nasdaq-100 (NAS100) technical outlook is cautious. The current price is below the modified exponential moving average trendline ($19,772) and baseline ($19,799), indicating a downward trend. The average price target is $20,020, based on hourly momentum and Fibonacci levels, suggesting a potential recovery if momentum shifts. However, the pessimistic target of $8,883 highlights severe downside risks. Resistance levels are set at $19,706 and $20,380, with core support at $18,883. The RSI at 31.25 is bearish but shows bullish divergence, indicating possible oversold conditions with recovery potential.
Tesla Stock (TSLA)
This week, Tesla's market price is likely to experience volatility driven by its Q2 earnings release and ongoing product dynamics. Despite a notable 33% share price increase, Tesla's Q2 data revealed a concerning 14% drop in car production and a 5% decline in unit sales, which could temper investor optimism. Analysts are anticipating a significant rebound in earnings per share from $0.37 to $0.62, which may provide short-term support for the stock.
However, cash flow remains a critical issue. With Q1 cash flow at its lowest since 2020, any negative surprises in this metric could weigh heavily on the stock. Tesla's substantial $21.5 billion cash reserve mitigates short-term concerns, but investors will seek evidence of improvement to affirm profitability and balance sheet health.
The Cybertruck's performance, with strong initial sales but high pricing and unconventional design, introduces uncertainty. While it has outpaced competitors in specific markets, long-term demand sustainability remains questionable. Mixed reviews and high costs could influence future sales and, consequently, Tesla's stock performance. Overall, this week's price movement will be closely tied to earnings results, cash flow metrics, and investor sentiment on Cybertruck's market viability.
Source: tradingview.com
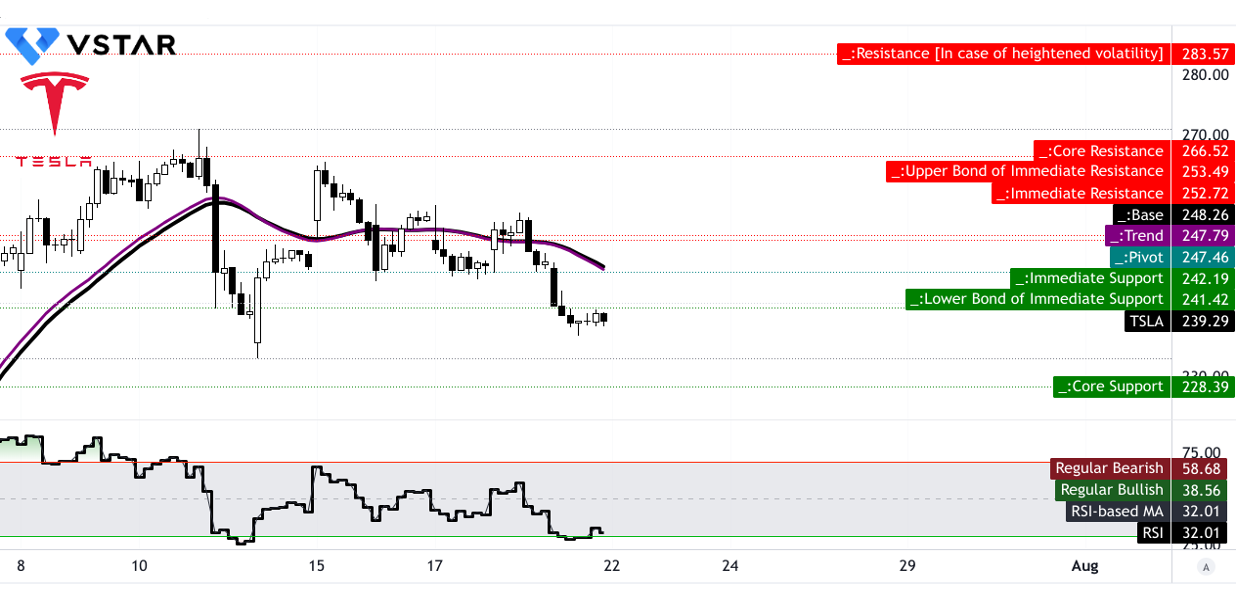
This week, Tesla's technical outlook shows a downward price direction with the current price at $239.29, below both the trendline ($247.79) and baseline ($248.26). The average price target is $253.00, influenced by momentum changes and Fibonacci levels, suggesting some potential for recovery. The optimistic target of $284.00 reflects strong upward momentum, while the pessimistic target of $228.00 indicates potential downside risks. Resistance is at $242.19, with a pivot at $247.46 and core resistance at $266.52. The RSI at 32.01, below the bullish threshold, indicates oversold conditions, though no clear bullish or bearish divergence is present.
Nvidia Stock (NVDA)
This week, Nvidia's (NVDA) market price is likely to be positively impacted by the announcement of Japan's upgraded AI supercomputer, ABCI 3.0, which will integrate thousands of NVIDIA H200 GPUs. This development underscores Nvidia's critical role in advancing global AI infrastructure, boosting its stock as investors anticipate heightened demand for its GPUs and related technologies.
The deployment of NVIDIA H200 GPUs, which offer substantial improvements in memory capacity and energy efficiency, will enhance Japan's AI research capabilities and establish Nvidia as a pivotal player in the next generation of AI technology. This high-profile project, backed by substantial investments from Japan's METI, signals strong future revenue opportunities for Nvidia through increased GPU sales and potential collaborations in AI research and development.
Moreover, Nvidia's involvement in such a significant national initiative aligns with its strategy to dominate the AI sector, likely leading to positive sentiment among investors. The stock could see increased buying interest, driven by expectations of amplified growth in Nvidia's AI-related revenue streams and broader market leadership. This anticipation could lead to a notable rise in Nvidia's stock price over the week.
Source: tradingview.com
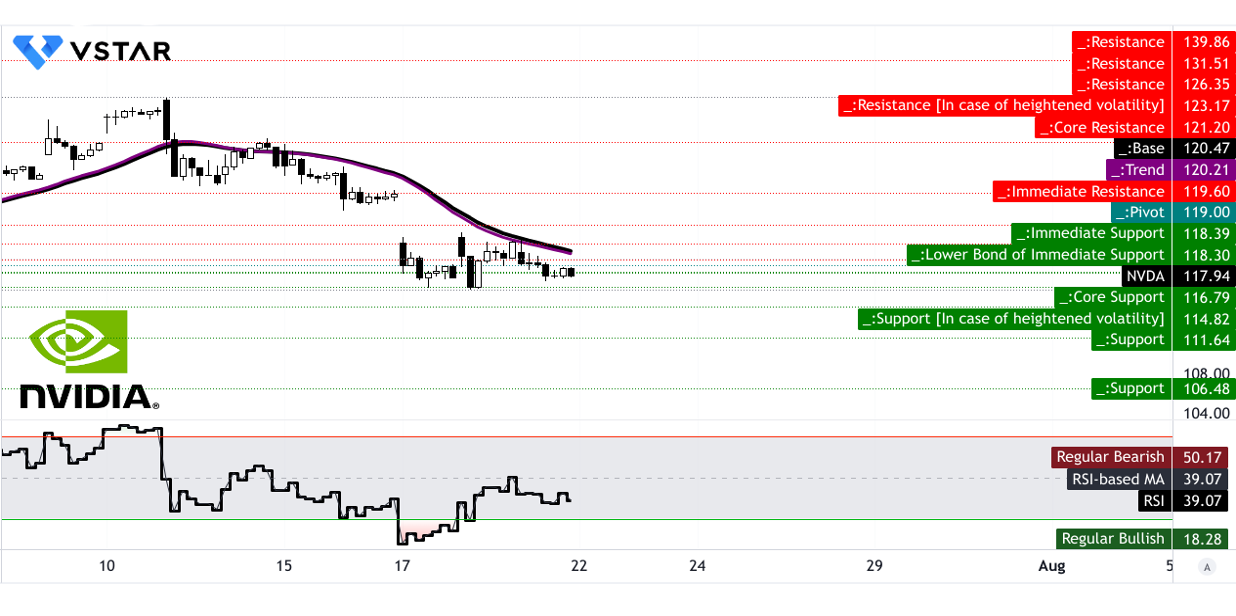
This week, Nvidia's (NVDA) technical outlook suggests a mixed scenario. The current price is $117.94, with a sideways trend relative to the trendline ($120.21) and baseline ($120.47). The average price target is $131.00, driven by momentum and Fibonacci levels, while the optimistic target is $140.00 and the pessimistic is $107.00. Key resistance levels are $119.60, $121.20, and $131.51, with support at $111.64 and $116.79. The RSI at 39.07 indicates bearish momentum but lacks divergence signals. Overall, expect potential volatility with resistance and support levels dictating price movement, and RSI suggesting cautious bearish sentiment.
Google Stock (GOOG)
This week, Alphabet's (GOOG) market price is likely to experience significant volatility surrounding its Q2 earnings report, set to be announced after the close on Tuesday. Analysts are forecasting strong results, with a 27% increase in earnings per share (EPS) and a 12% rise in revenue, driven by sustained revenue growth and past performance where Alphabet has exceeded expectations in 5 of the last 8 quarters. However, the stock's recent 45% gain, outperforming the S&P 500, may already be factoring in these anticipated results, creating potential for a "buy the rumor, sell the news" scenario.
Given the substantial number of upward revisions for both EPS (34 up vs. 1 down) and revenue (28 up vs. 2 down), expectations are high. If Alphabet's actual results fall short of these elevated expectations, the stock could face downward pressure. Conversely, if results exceed expectations, particularly in light of its lagging position in generative AI compared to competitors like OpenAI, a strong beat could drive further gains. The overall market reaction will hinge on whether Alphabet's performance can continue its momentum amidst intensifying competitive challenges.
Source: tradingview.com
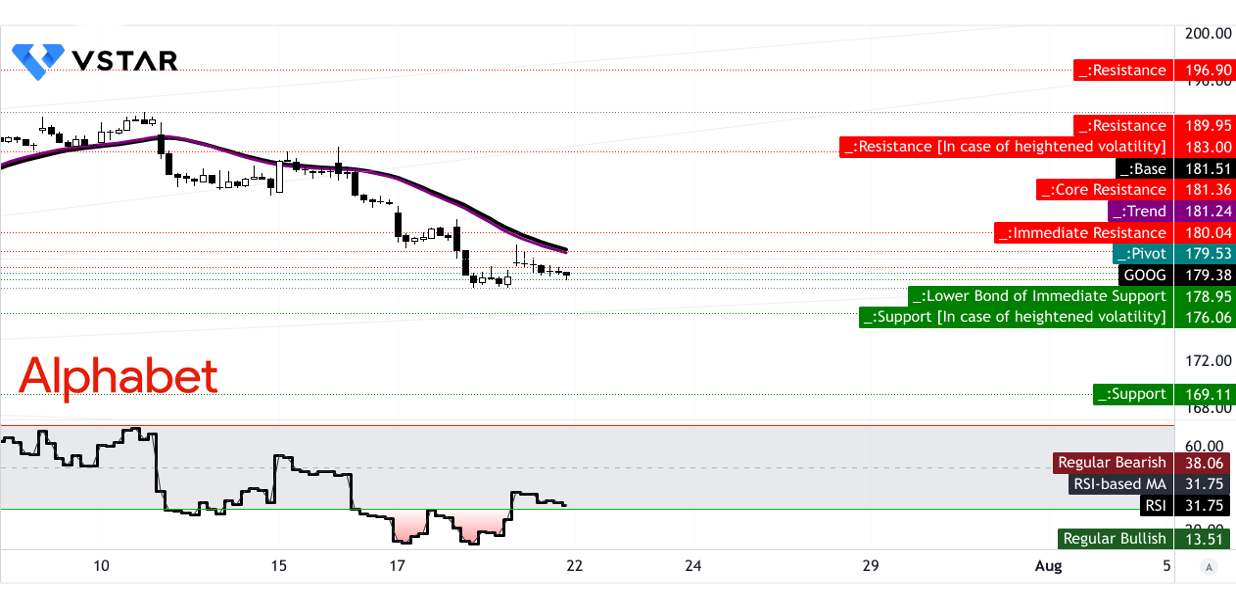
For Alphabet (GOOG) this week, the technical outlook suggests potential volatility. Currently, the stock price is at $179.38, below key trendline and baseline levels of $181.24 and $181.51 respectively, indicating a downward direction. Resistance is at $180, with higher volatility possibly pushing it to $183. Support levels are at $178.95 and $176.06, should downward pressure intensify. The RSI at 31.75, though below the bullish threshold of 38.06, shows a sideways trend with bullish divergence, suggesting potential for a reversal if buying momentum increases. Average price targets for the week range from $169 to $197, reflecting significant potential price movement.
Gold (XAUUSD)
This week, gold prices are expected to continue trending upwards due to a combination of factors influencing the market. The immediate boost for gold comes from political uncertainty following President Joe Biden's withdrawal from the 2024 presidential race, which has led to a weakening dollar and an increase in demand for safe-haven assets. This shift has resulted in gold edging up, with spot prices recently hovering around $2,402.61 per ounce and futures reaching $2,403.30.
The street is anticipating further volatility, as the likelihood of a rate cut by the Federal Reserve remains high. Markets are already pricing in a 97% chance of a rate cut in September, which traditionally boosts gold prices by reducing the opportunity cost of holding non-yielding assets like bullion. Additionally, the upcoming U.S. Personal Consumption Expenditures (PCE) data on Friday will be critical. A weaker-than-expected PCE report could reinforce expectations of monetary easing, further supporting gold prices.
Furthermore, the potential for a more confrontational U.S.-China relationship under a future Trump presidency adds to the geopolitical risk premium, making gold a more attractive hedge. Therefore, gold prices could potentially reach new highs, with geopolitical tensions and economic uncertainties driving investor demand.
Source: tradingview.com
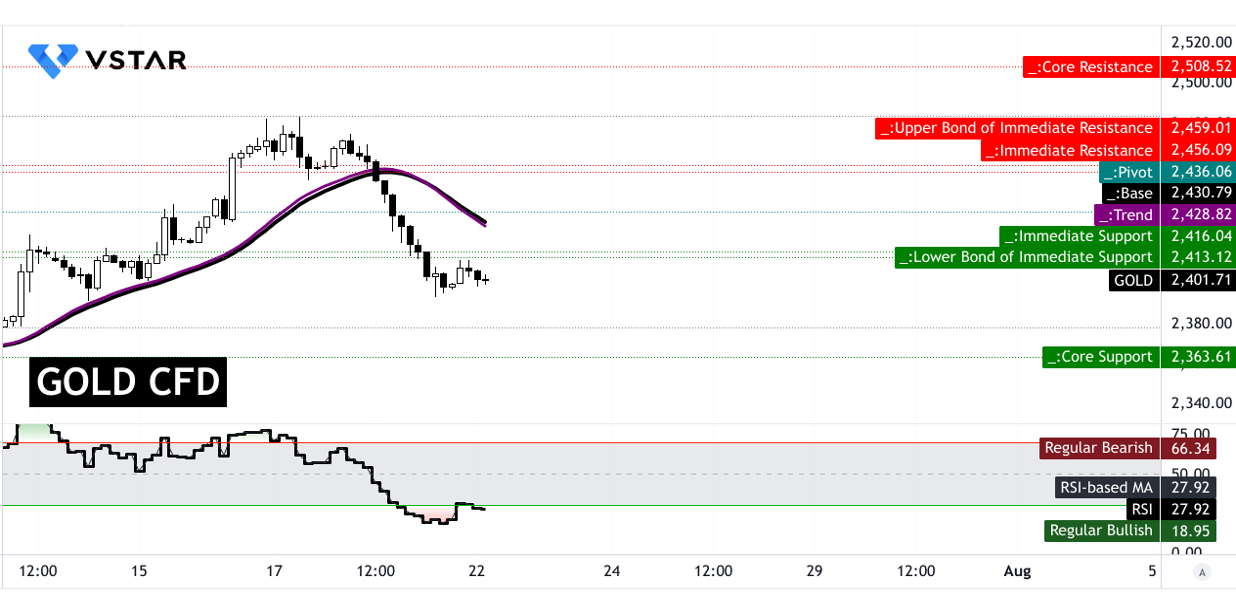
This week, gold's technical outlook suggests a potential upward correction within a generally downward trend. The price is currently below key moving averages, with a trendline at $2,428.82 and a baseline at $2,430.80, indicating short-term resistance. The average price target is $2,436.00, influenced by momentum and Fibonacci levels, while optimistic and pessimistic targets are $2,459.00 and $2,363.00, respectively. Resistance is at $2,416.04 and $2,456.09, with core support at $2,363.61. The RSI is low at 27.92, signaling potential for a bullish divergence, which may support a price rebound within the broader downtrend.
US Crude Oil (USOUSD)
This week, the market price of US Crude Oil will likely experience fluctuations due to several converging factors:
- Economic Data from China: The weaker-than-expected economic data from China suggests a potential decrease in global oil demand, which may put downward pressure on oil prices. Investors will be watching for any signs of worsening economic conditions in China that could exacerbate this trend.
- Federal Reserve's Policy Meeting: Market focus will shift to the Federal Reserve's meeting on July 30/31. If the Fed signals a potential start to monetary policy easing, with interest rate cuts expected in September, it could impact oil prices indirectly by affecting the strength of the US dollar. A weaker dollar often leads to higher oil prices, but any surprise in the Fed's decision could create volatility.
- Hurricane Beryl: The recent impact of Hurricane Beryl on the Texas Gulf Coast, a key energy hub, could cause short-term disruptions in oil supply. Market participants will be monitoring the EIA's updates on infrastructure damage and supply chain impacts, which could lead to price spikes if significant disruptions are reported.
- OPEC+ Production Cuts: OPEC+'s commitment to maintain production cuts until at least September will support oil prices by constraining supply. However, any unexpected developments regarding compliance or further cuts could impact prices.
Source: tradingview.com
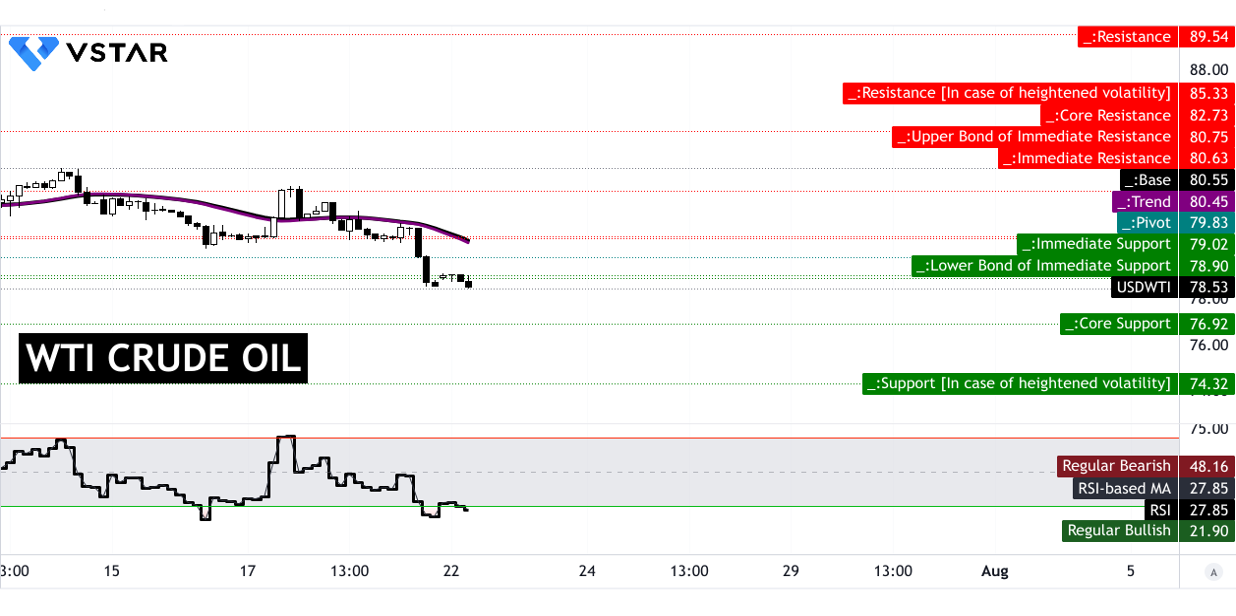
This week, the technical outlook for US Crude Oil indicates a generally downward trend. Currently priced at $78.60, the oil market faces primary resistance at $79.04 and a key pivot point at $79.83. Given the RSI of 27.85, which is in the oversold territory, the market shows potential for a bullish divergence despite a bearish trend. The average price target is projected at $80.75, with an optimistic target of $85.30 and a pessimistic target of $74.35, reflecting the volatility. Key support levels to watch are $76.92 and $74.32, with resistance potentially capping gains at $82.73.
EURUSD
This week, the EUR/USD exchange rate is poised for volatility driven by key economic data and central bank expectations. The ECB's decision to hold rates steady, coupled with President Lagarde's ambiguous hints about a potential rate cut in September, has created uncertainty around the euro. This uncertainty was evident last week, as the euro dropped after the ECB's meeting due to a lack of clear future guidance.
On the other hand, the Federal Reserve's positive outlook on inflation control, as indicated by Powell, bolsters the dollar, particularly as investors anticipate a rate cut in September. Despite strong US June sales data and an expanding GDP report, which slightly exceeded forecasts but was weaker than previous periods, market focus will shift to next week's US data releases. Specifically, the upcoming GDP and durable goods reports will be crucial. If these reports suggest continued economic weakening, it could reinforce expectations of a Fed rate cut, potentially leading to a weaker dollar and a stronger euro.
In summary, if US data points to further economic slowdown, the EUR/USD pair might see upward pressure on the euro. Conversely, robust data could strengthen the dollar, leading to a drop in the EUR/USD rate.
Source: tradingview.com
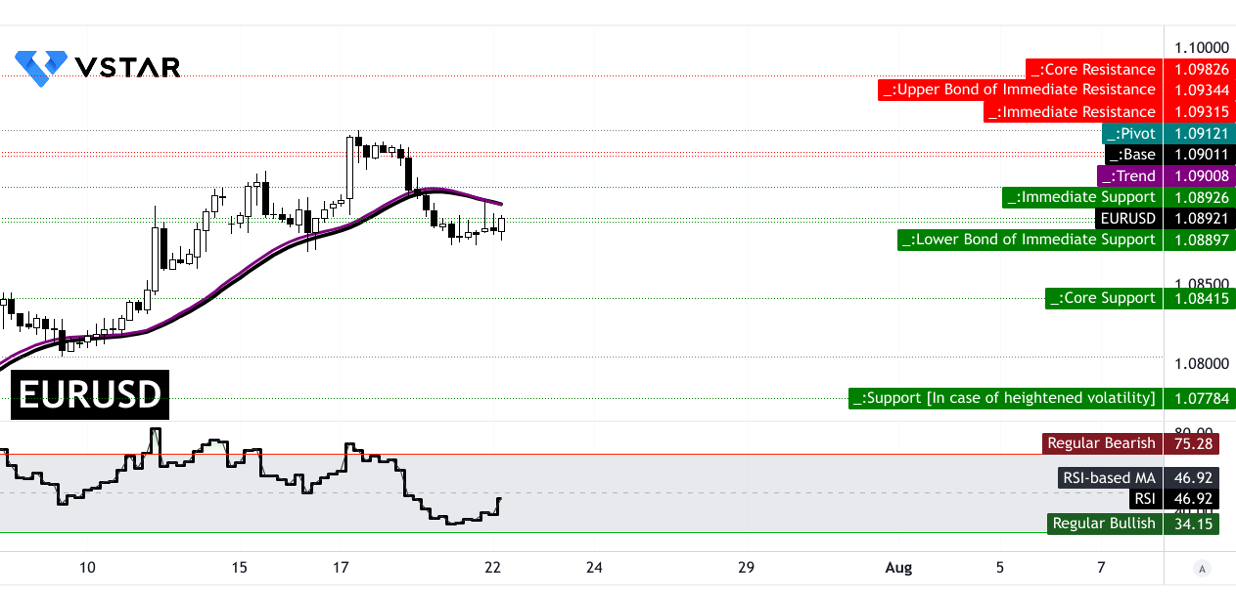
For the EUR/USD this week, the technical outlook suggests a sideways trend around $1.0894. The modified exponential moving averages (EMA) indicate a near-term equilibrium at $1.0900 (trendline) and $1.0901 (baseline), suggesting limited movement in either direction. The average price target is $1.0912, reflecting slight upward momentum and Fibonacci projections. However, with the RSI at 45.92 and trending up, there's a bullish divergence indicating potential upward pressure. Optimistically, the pair could reach $1.0982 if momentum continues, while a pessimistic scenario could see a decline to $1.0778, guided by the current swing and support levels.
Bitcoin (BTCUSD)
This week, Bitcoin's market price is likely to be heavily influenced by several key factors:
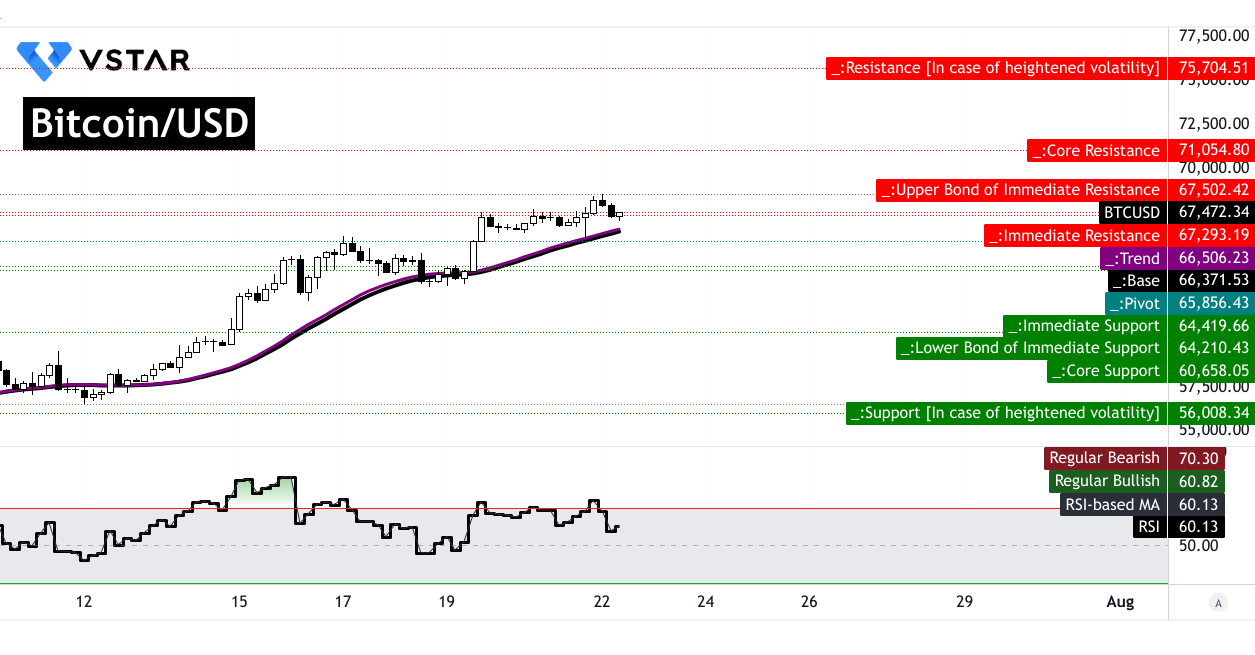
Donald Trump's Speech: Trump's anticipated announcement at the Nashville Bitcoin conference could act as a significant catalyst. If he endorses a larger role for BTC in the U.S. financial system, it might lead to a parabolic price increase. The market is already showing signs of heightened volatility, as indicated by the spike in the "butterfly index" and increased activity in out-of-the-money options. This suggests traders are preparing for substantial price swings.
Election and Economic Data: Biden's withdrawal from the 2024 presidential race has shifted sentiment towards a potentially crypto-friendly administration, which has positively impacted Bitcoin's price, briefly pushing it above $68,000. Additionally, upcoming U.S. economic data, including GDP growth, core PCE prices, and retail sales, will influence Federal Reserve rate cut expectations and overall demand for risk assets like Bitcoin.
Options Market Dynamics: The rise in the butterfly index reflects anticipation for extreme market movements, influenced by potential regulatory changes and new financial products like spot ether ETFs. This heightened volatility expectation can drive speculative trading and further amplify Bitcoin's price fluctuations.
Source: tradingview.com
This week, Bitcoin (BTC) is showing an upward trend, with the current price at $67,472, above the trendline ($67,506) and baseline ($67,371) moving averages. The average price target by week's end is $71,055, influenced by momentum and Fibonacci levels, with an optimistic target of $75,705 and a pessimistic target of $60,658. Key support levels are at $67,293 and $64,420, while core resistance is at $71,054. The RSI is at 60.13, just below the bullish threshold of 60.82, indicating moderate bullish momentum but no significant divergences. The RSI trend is down, suggesting potential caution.
Ethereum (ETHUSD)
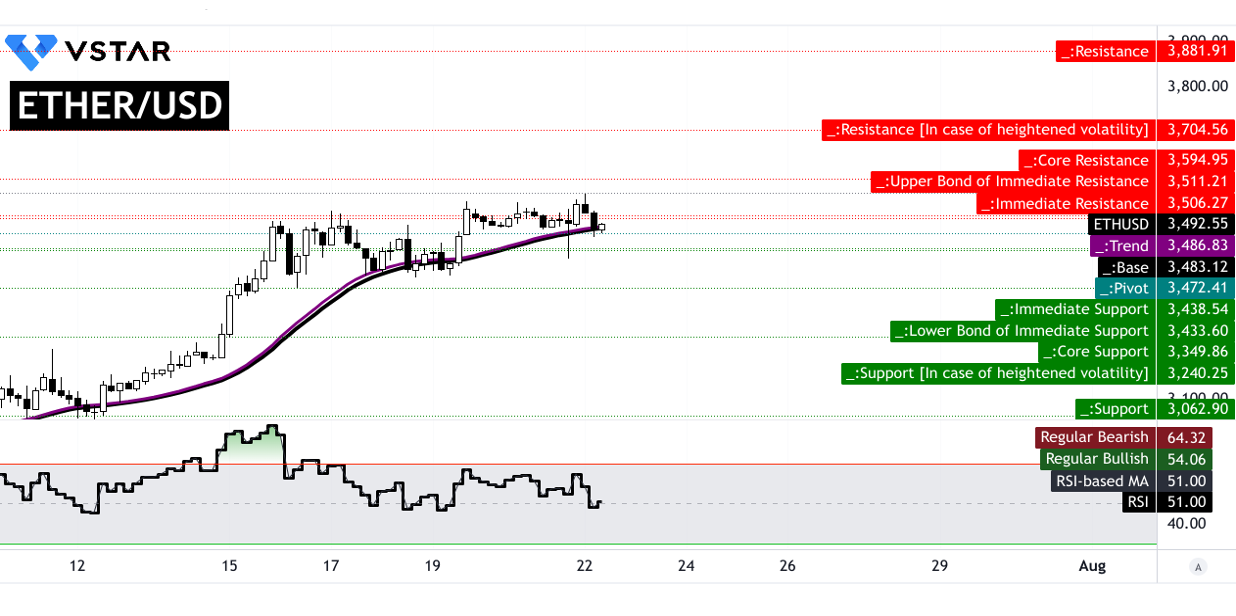
This week, Ethereum (ETH) may have significant price movement due to several factors. The anticipated launch of Ether spot ETFs in the U.S. on July 23 is expected to be a major catalyst, potentially driving ETH prices above $5,000. The initial phase may see some volatility as funds flow out of the Grayscale Ethereum Trust (ETHE) to transition into these new ETFs. However, the long-term outlook remains bullish with a projected $15 billion in net inflows over the next 18 months.
Source: tradingview.com
The market may experience choppy conditions initially, influenced by the current outflows from ETHE. Despite this, the introduction of these ETFs is likely to have a more substantial impact on ETH prices compared to previous ETF launches for Bitcoin (BTC). The structural factors, including a zero short-term inflation rate for ETH and significantly staked ETH that is not available for sale, contribute to a potentially stronger market response.
Additionally, recent movements in meme coins like Popcat and Mog, driven by their association with Solana and Ethereum, indicate a broader bullish sentiment. These developments could amplify the upward pressure on ETH, as speculative trading and increased transactional volumes on Ethereum contribute to its price surge.
This week, Ethereum (ETH) is showing a sideways price trend around $3,492, with key technical levels providing guidance. The current price is near the trendline ($3,486) and baseline ($3,483). The average price target is projected at $3,595, based on momentum and Fibonacci levels. Optimistically, ETH could reach $3,882, reflecting strong upward momentum, while pessimistically, it might drop to $3,440. Resistance is at $3,511, with core resistance at $3,595, while support is at $3,433, with core support at $3,350. The RSI at 51 indicates neutral sentiment, with no significant bullish or bearish divergence.


