EURUSD
Fundamental Perspective
The EURUSD pair surged past the 1.0800 mark, trading around 1.0820 after hitting a three-week high of 1.0841. This movement was driven by a weakened US Dollar, influenced by various factors, while Euro buyers remained cautiously optimistic. The US Bureau of Economic Analysis reported a steady monthly PCE Price Index and a 2.6% annual increase for May, suggesting no inflation acceleration. Fed Chairman Jerome Powell's unexpectedly dovish remarks at the ECB's Forum on Central Banking hinted at a possible September rate cut, further undermining the Dollar.
Employment data exacerbated the Dollar's decline. The ADP report showed the private sector added fewer jobs than anticipated, and Initial Jobless Claims rose slightly. Although Nonfarm Payrolls exceeded expectations with 206K new jobs, unemployment climbed to 4.1%, and wage growth decelerated. Additionally, disappointing ISM Services and Manufacturing PMI figures, both showing contraction, added to the Dollar's weakness.
In contrast, the Eurozone presented mixed economic data. Retail Sales saw a minor increase, and PMIs were revised upward, yet Germany's HICP inflation eased. German growth indicators, such as Factory Orders and Industrial Production, declined. Markets now await Powell's upcoming testimony and US inflation reports to determine future trends, keeping a close watch on potential market shifts.
EURUSD Forecast Technical Perspective
The last weekly candle closed in solid green, reflecting intense bullish pressure on the asset price, which indicates that the next candle might be another green one.
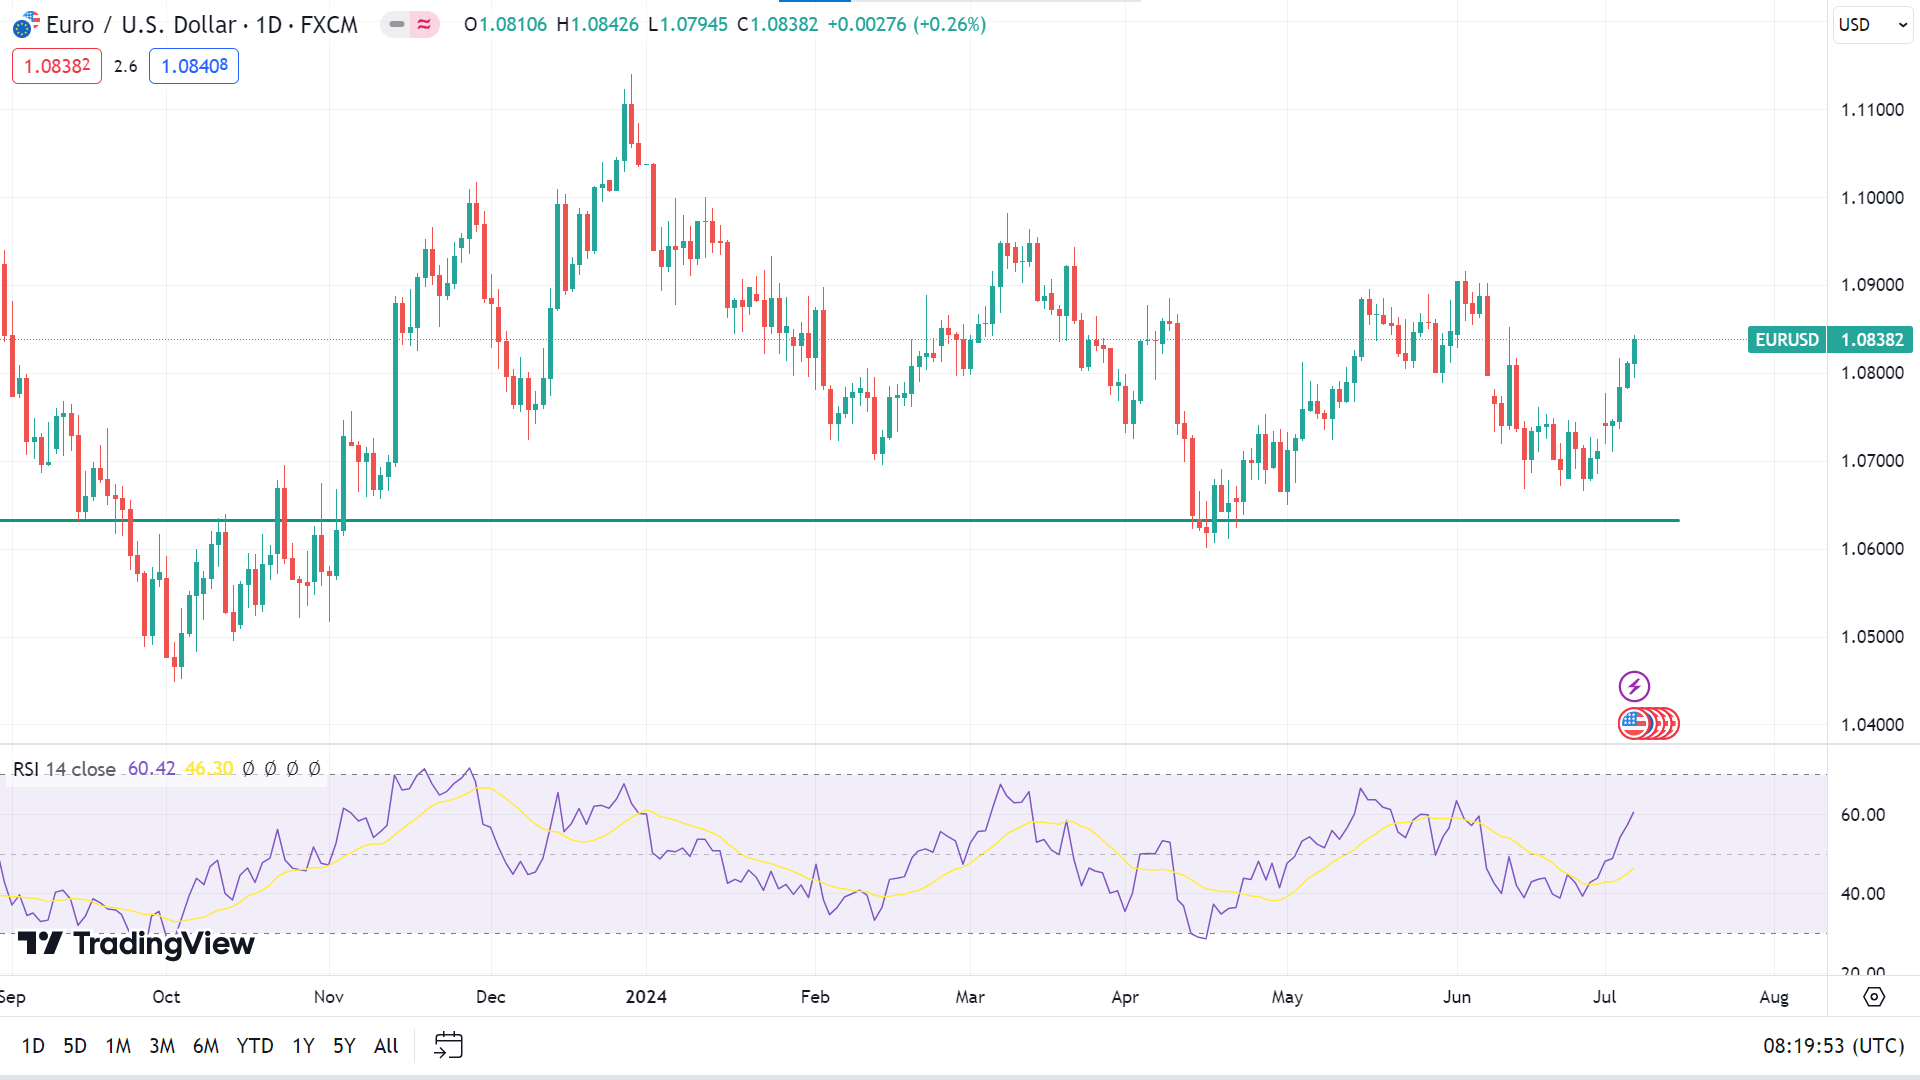
The RSI signal line is moving upward on the daily chart, reflecting the current bullish pressure on the asset price. This indicates that the price may regain the peak of 1.0918, followed by the next resistance near 1.1014.
Meanwhile, on the negative side, if the RSI signal line starts sloping toward the midline of the indicator window, the price can decline to the nearest support of 1.07284, followed by the next support near 1.0604.
GBPJPY
Fundamental Perspective
The Pound Sterling maintained its strength throughout the week, anticipating a decisive victory for the opposition Labour Party. Early Friday, the vote count confirmed Labour’s sweeping win, securing more than the 326 seats needed for a working majority in the 650-seat House of Commons. Outgoing Prime Minister Rishi Sunak conceded defeat and congratulated Labour leader Keir Starmer. In his victory speech, Prime Minister-elect Starmer proclaimed, “Today we start the next chapter — begin the work of change, the mission of national renewal, and start to rebuild our country.”
Despite the significant election outcome, the Pound Sterling showed little immediate reaction. It will take time for markets to fully assess the implications of a Labour victory on the Bank of England’s interest rate outlook and the performance of the domestic currency. The cautious market stance reflects the complexity of economic policies that the new government might implement and their potential impact on the UK economy.
Meanwhile, the GBPJPY faces potential volatility due to possible interventions by the Japanese Ministry of Finance. A report from RBC, highlighted by Bloomberg, suggests an alternative scenario: if the Bank of Japan raises interest rates while reducing or ending its bond-buying program, markets could face a double hawkish shock. This situation likely causes a strong JPY rally, rising yields, and a significant GBPJPY pair drop.
GBPJPY Forecast Technical Perspective
On the weekly chart, the last candle finished solid green, posting four consecutive gaining weeks, leaving optimism for buyers that the next candle might be another green one.
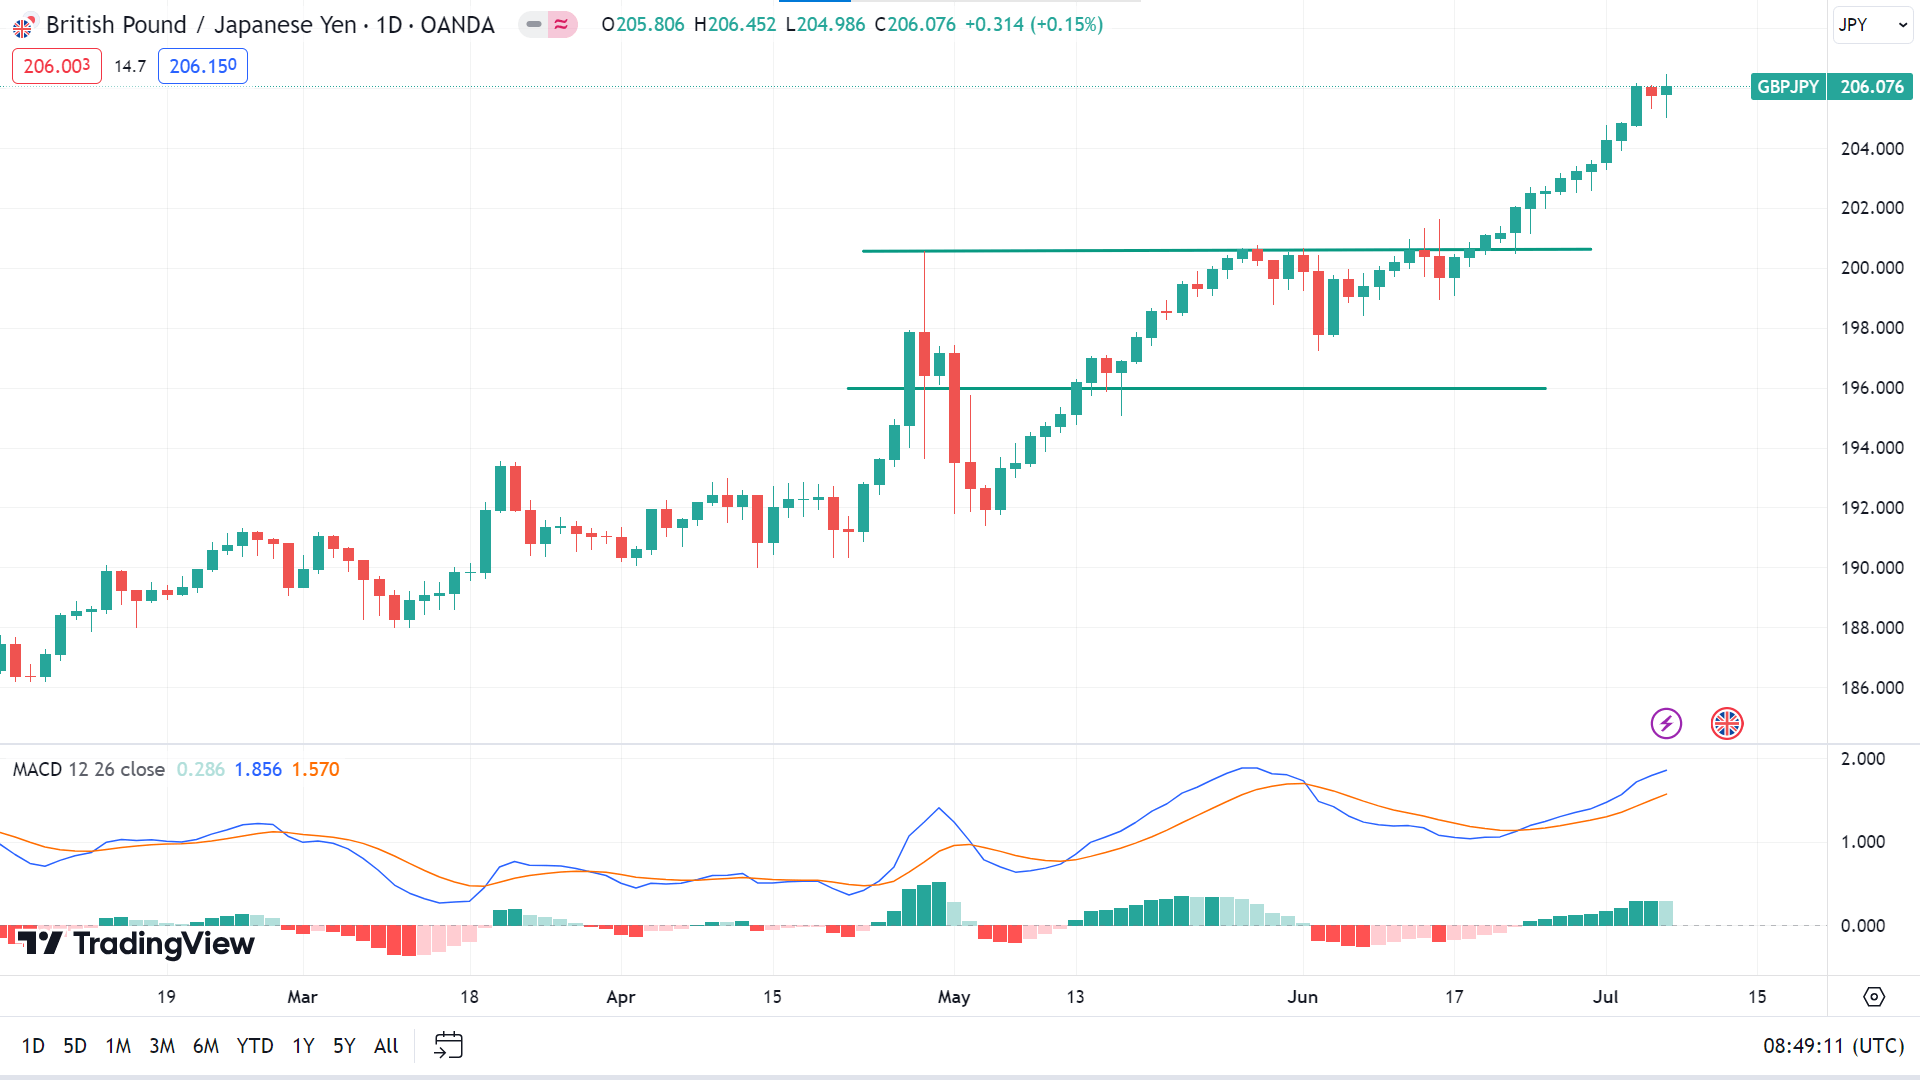
In the daily chart, the MACD indicator window shows ongoing bullish pressure as the signal lines move upward, and the histogram bars are green above the midline. So, the price may head to the primary resistance of 207.80, followed by the next resistance near 214.19.
On the other hand, fading and smaller histogram bars on the MACD window still give hope that the price may retrace to the nearest support of 201.77. Meanwhile, the next possible support level is near 198.97.
NASDAQ 100 (NAS100)
Fundamental Perspective
All three major Wall Street indexes are set for weekly gains, driven by high-momentum technology stocks that led the S&P 500 and Nasdaq to substantial first-half gains. With second-quarter earnings on the horizon, it remains to be seen if the rally will extend beyond mega cap stocks and whether these companies' earnings can justify their steep valuations.
The Labor Department reported a rise in non-farm payrolls by 206,000 jobs in June, exceeding the expected 190,000. However, May's figures were revised down to 218,000 from 272,000. This softer reading strengthened the case for a Federal Reserve rate cut in September, following ADP Employment and weekly jobless claims reports indicating an easing labor market. Consequently, the likelihood of a 25-basis point rate cut in September rose to 72% from 66%, according to CME Group's FedWatch tool.
Earlier in the week, data revealed a decline in services sector activity to a four-year low and an unexpected slump in factory orders, suggesting the U.S. economy is losing steam, which prompted market participants to increase their bets on multiple rate cuts this year. The anticipation of these cuts helped the S&P 500 and Nasdaq achieve record highs during Wednesday's holiday-shortened trading session. Trading volumes have remained light throughout the week, and the market is closing for Thursday's Independence Day.
Key fundamental releases for this week are JPMorgan & Chase (JPM), Pepsico (PEP), Citi Group (CITI), Wells Fargo & Company (WFC), and Delta Airlines (DAL).
Technical Perspective
The last candle on the weekly chart ended solid green, posting four consecutive gaining weeks, reflecting strong possibilities that the next candle might be another green one.
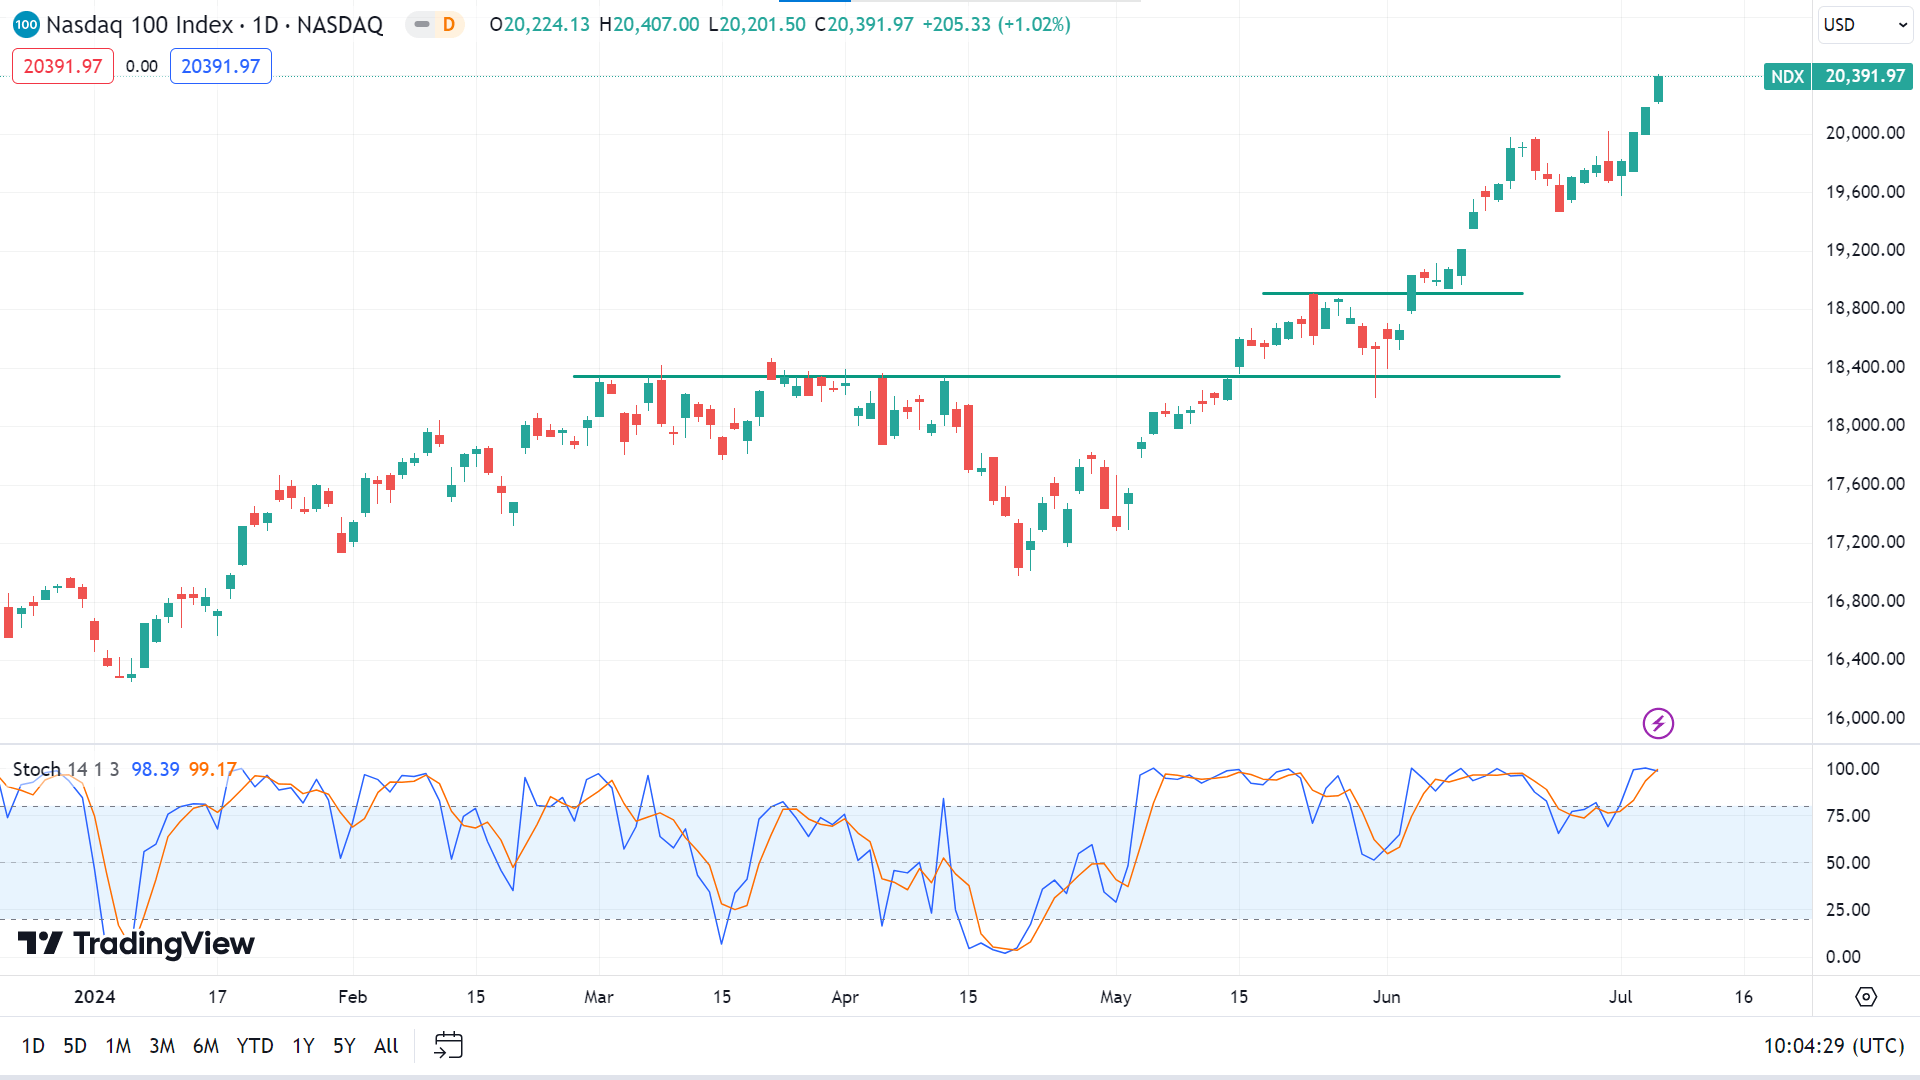
The price is moving on an uptrend on the daily chart, as the Stochastic indicator window shows buyers' domination through dynamic signal lines floating at the overbought level. This indicates the price may hit the nearest resistance of 20,989.53, whereas the next resistance is near 22,614.67.
However, any pause in the current uptrend may cause the price to decline toward the primary support of $19,979.93, followed by the next support near 18,743.58.
S&P 500 (SPX500)
Fundamental Perspective
The Standard & Poor's 500 index commenced the latter half of 2024 with a robust 2% weekly advance, closing at a record high of 5,567.19. This rapid rally unfolded over just four sessions due to the market closure on Independence Day, highlighting strong performance across key sectors such as communication services, technology, and consumer discretionary.
Last Friday, the Labor Department reported that nonfarm payrolls increased by 206,000 jobs in June, surpassing expectations, though revisions for May and April reduced overall job gains by 111,000. The unemployment rate increased to 4.1% from May's 4%, slightly exceeding forecasts. These figures have prompted speculation that the Federal Reserve may consider interest rate cuts later in the year to bolster economic stability.
Key sector performances included Paramount Global's communication services shares climbing 14%, buoyed by reports of negotiations to sell its Black Entertainment Television network. Apple led the technology sector with a 7.5% gain following optimistic analyst reports on its AI integration strategy. In comparison, Tesla surged 27% in consumer discretionary on strong second-quarter delivery figures, signaling optimism about the electric vehicle maker's prospects.
Technical Perspective
On the weekly chart, the last candle closed solid green after a doji, reflecting solid bullish pressure on the asset price, which indicates that the upcoming candle might be another green one.
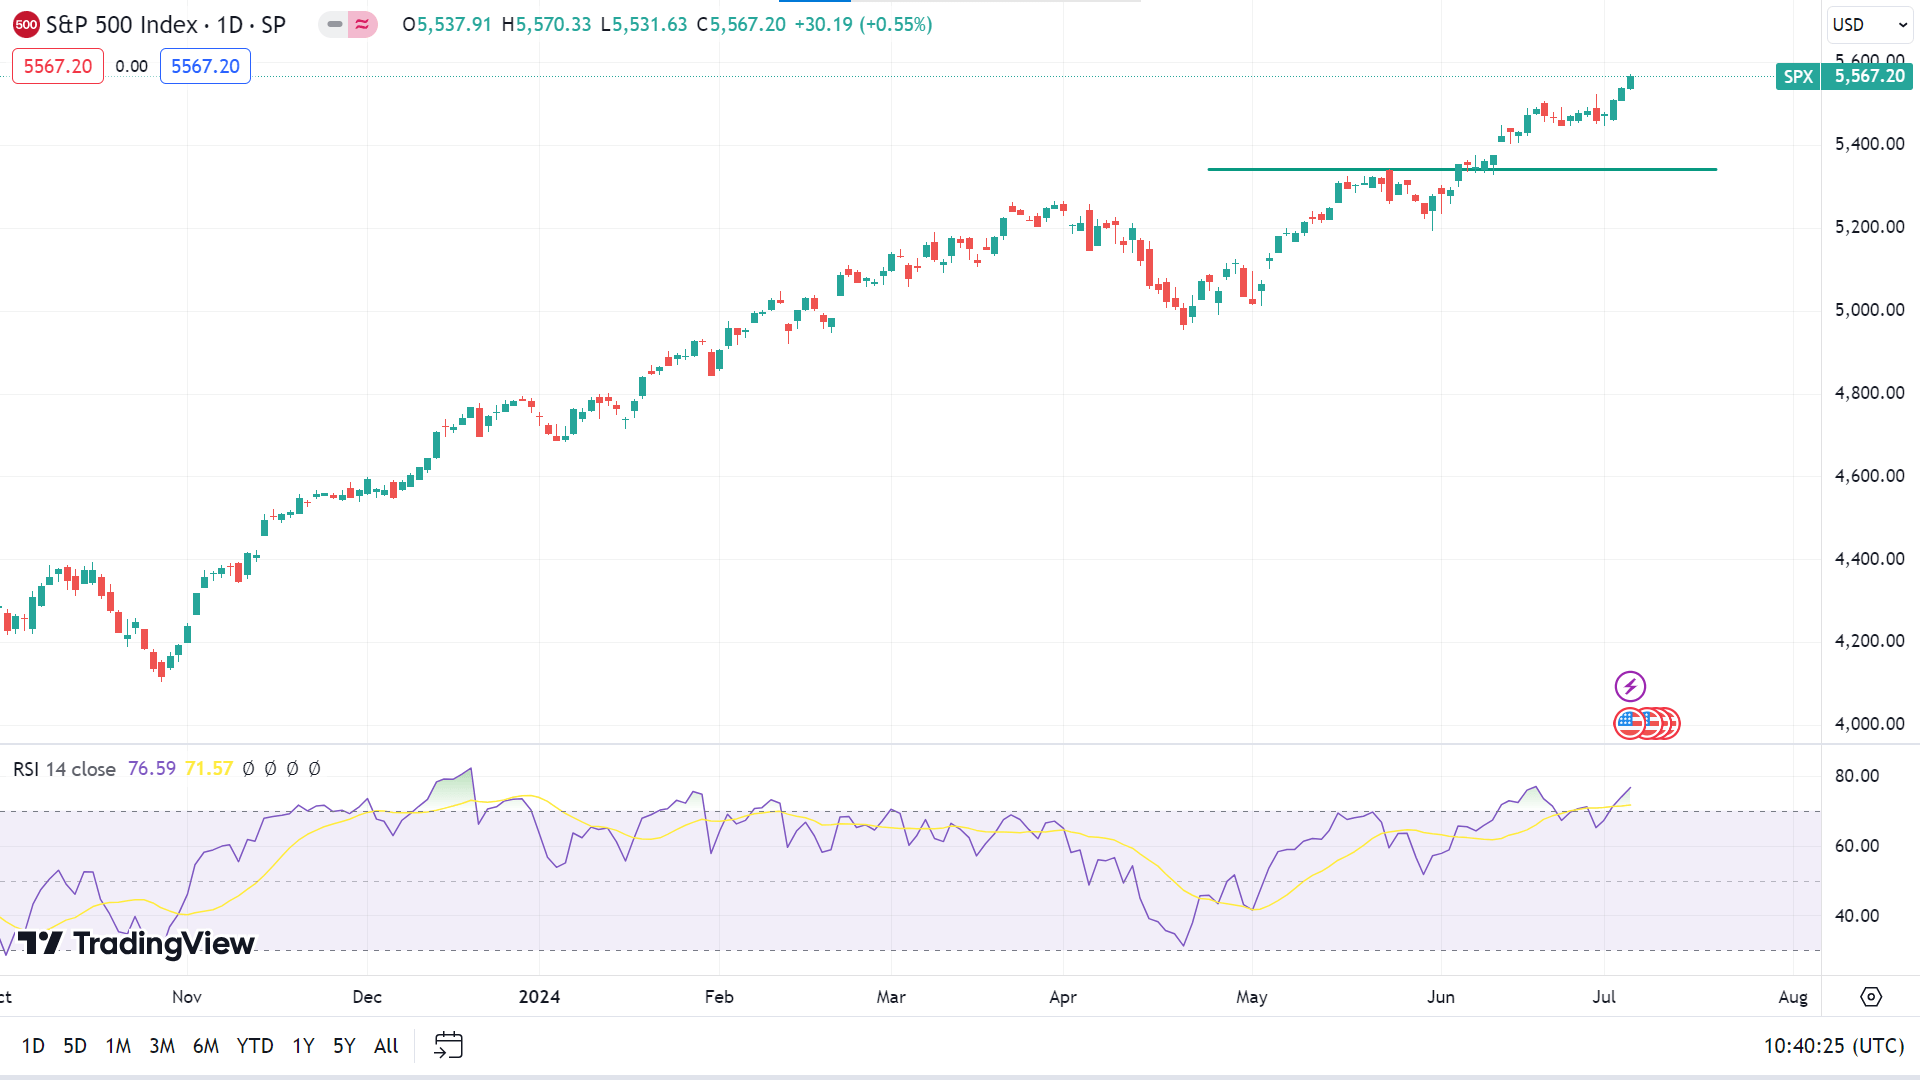
On the daily chart, the RSI indicator readings remain neutral as the signal line of the indicator window floats just below the overbought level. This indicates that the price may hit the primary resistance of 5584.95, followed by the next resistance near 5695.47.
Meanwhile, on the downside, with the RSI signal line sloping downward, any retracement can trigger the price to decline on the primary support of 5478.23, whereas the following support level is near 5386.13.
Gold (XAUUSD)
Fundamental Perspective
Gold and silver futures closed at their highest levels since May on Friday, boosted by subdued U.S. economic data that weighed on the dollar and heightened expectations of a Federal Reserve interest rate cut. Despite positive nonfarm payrolls (NFP) figures for June, downward revisions to April and May data suggested the economy added 111,000 fewer jobs than previously reported. Additionally, the unemployment rate ticked up slightly in June, surpassing expectations.
Further, U.S. Bureau of Labor Statistics (BLS) data showed that Average Hourly Earnings (AHE) remained unchanged month over month and declined year over year.
Beyond economic indicators, geopolitical developments influenced the trajectory of precious metals. Israeli Prime Minister Benjamin Netanyahu's delegation continued negotiations on hostages, emphasizing that the conflict would persist until Israel achieved its objectives. In response, a Hamas leader indicated readiness for negotiations pending a positive Israeli response, as reported by CNN. These geopolitical tensions added to the market sentiment favoring safe-haven assets like gold amid global uncertainties.
Gold Price Prediction Technical Perspective
The last weekly candle finished in solid green, suggesting intense bullish pressure on the asset price, leaving buyers optimistic for next week.
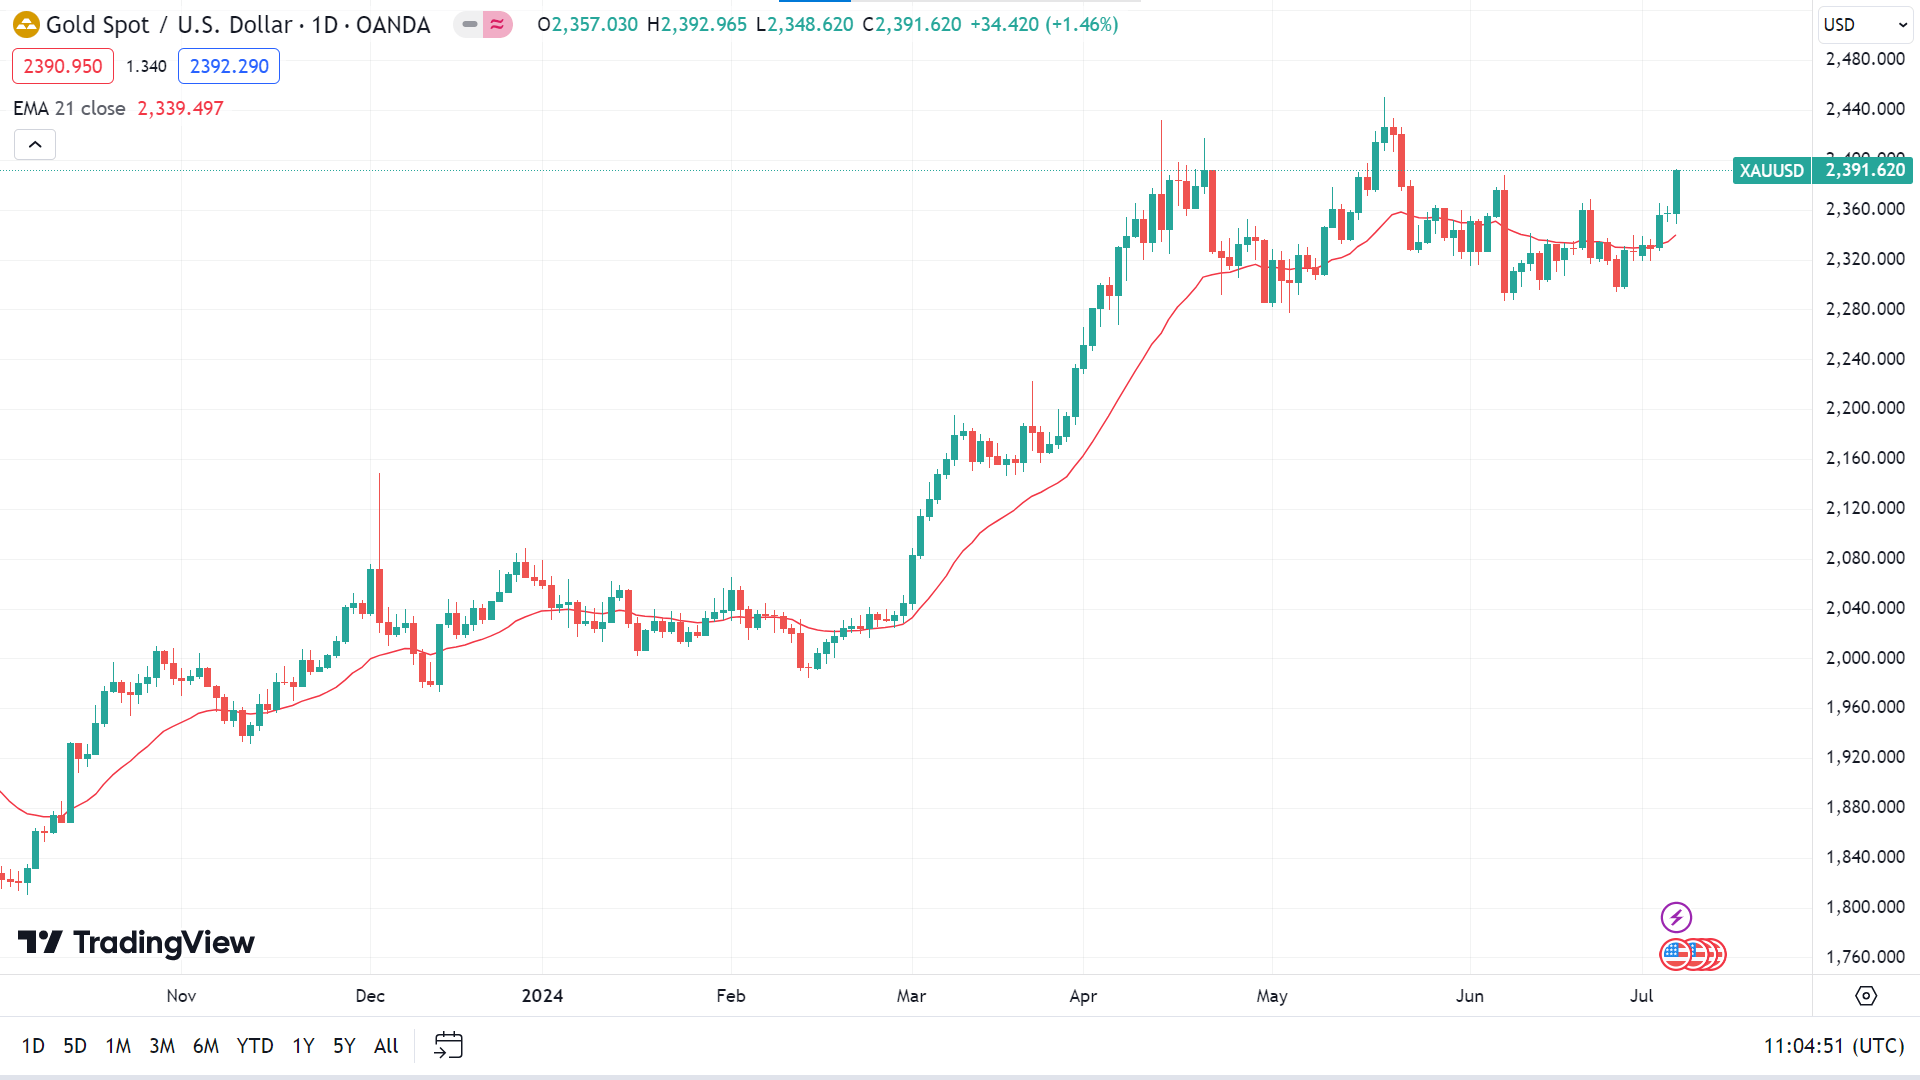
On the daily chart, the price floats above the EMA 21 line, suggesting bullish pressure and indicating it may head to regain the ATH of 2450.12 or above.
Meanwhile, if the price exceeds the EMA 21 line on the downside, it can decline to the primary support of 2300.76, followed by the next support near 2271.38.
Bitcoin (BTCUSD)
Fundamental Perspective
Bitcoin has recently shown surprising resilience, rebounding from a low of $53,898 to above $56,000, registering a 1.6% increase in the past few hours. This recovery was spurred by the latest US nonfarm payrolls (NFP) report, which indicated a rise in the unemployment rate. The news sparked renewed buying activity, temporarily easing bearish pressures.
However, analysts caution that this upward movement may not signal a sustained trend, with the potential for further declines lingering.
Amidst the volatile market backdrop, opinions among financial experts vary. Samson Mow, a prominent figure in the cryptocurrency realm, argues that Bitcoin's current pricing reflects artificial manipulation. He labels these abrupt price movements as "artificial price suppression," attributing them to significant Bitcoin transfers orchestrated by governmental entities during reduced market liquidity.
Mow's assertion suggests external influences distort Bitcoin's natural price discovery mechanisms, highlighting the complex interplay between market dynamics and external factors in the cryptocurrency landscape.
Bitcoin Price Prediction Technical Perspective
The last weekly candle of BTCUSD closed red, posting four consecutive losing weeks and signaling the next one might be another red one.
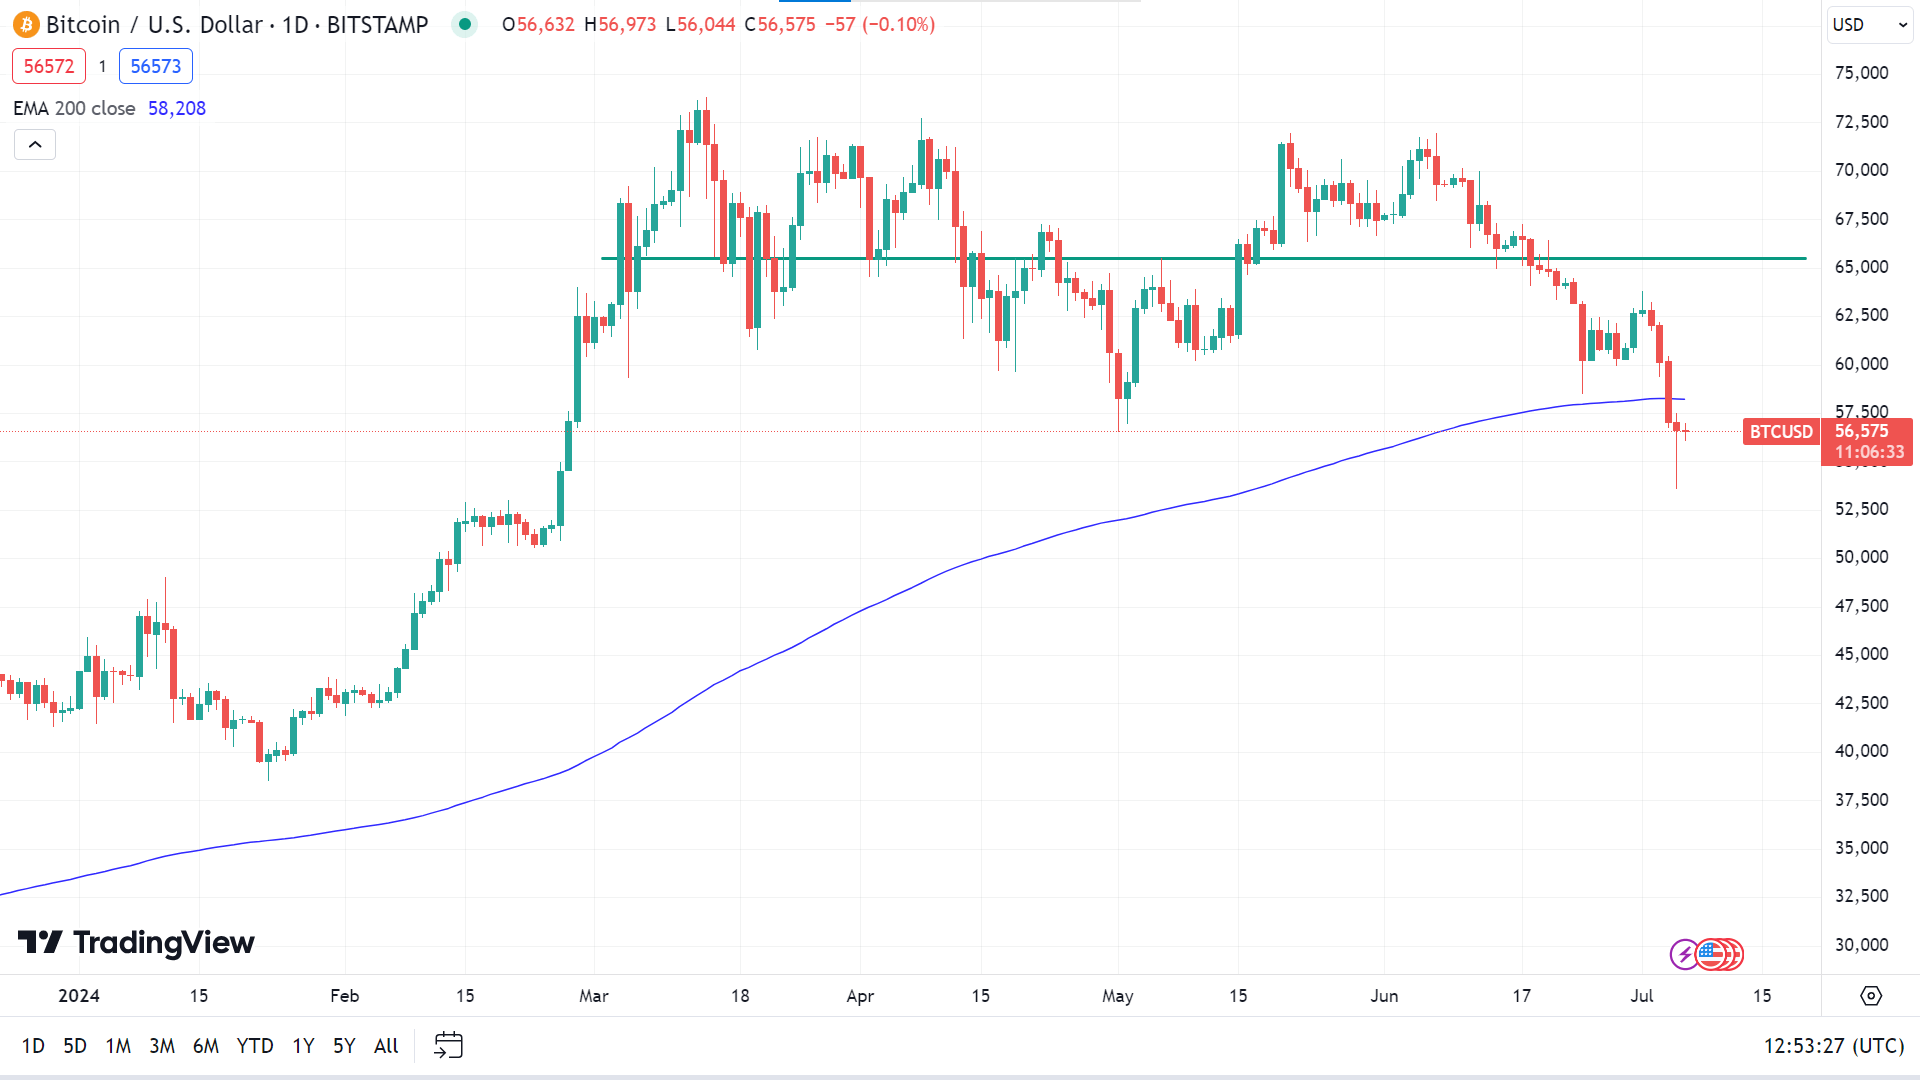
On the daily chart, the price reaches below the EMA 200 line, displaying sellers' domination on the asset price. If the price continues to float the EMA 200 line, it can get the primary support of 53,550, followed by the next support of 50,867.
Meanwhile, if the price exceeds the EMA 200 line on the upside, it may reach the nearest resistance of 62,905, followed by the next resistance near 65,500.
Ethereum (ETHUSD)
Fundamental Perspective
Greek Live recently spotlighted the increasing volatility in the cryptocurrency market, particularly with the impending expiration of numerous Bitcoin and Ethereum options. The report noted that 18,000 BTC options and 164,000 Ethereum options are nearing expiration, representing notional values of $1 billion and $470 million, respectively.
This scenario is particularly significant due to the skewed Put-Call Ratios and defined Maxpain points, which suggest potential price pivots at $61,500 for Bitcoin and $3,350 for Ethereum. The onset of July brought notable market downturns, with major cryptocurrencies hitting new monthly lows. The end of the quarterly cycle has triggered heightened market volatility, offering a strategic window for institutional players to establish positions.
Amid this bearish sentiment, the implied volatility of put options for Bitcoin and Ethereum has markedly increased, reflecting growing trader caution. Additionally, Greek Live reported that with forthcoming news on Ethereum ETFs and the attractive pricing of end-of-month call options, investors have a strategic opportunity to capitalize on the current market conditions.
Ethereum Price Prediction Technical Perspective
After a bit of pause, the last weekly candle closed as a solid red one, following four consecutive losing weeks, which reflects bear domination at the asset price and the possibility that the next candle will be another red one.
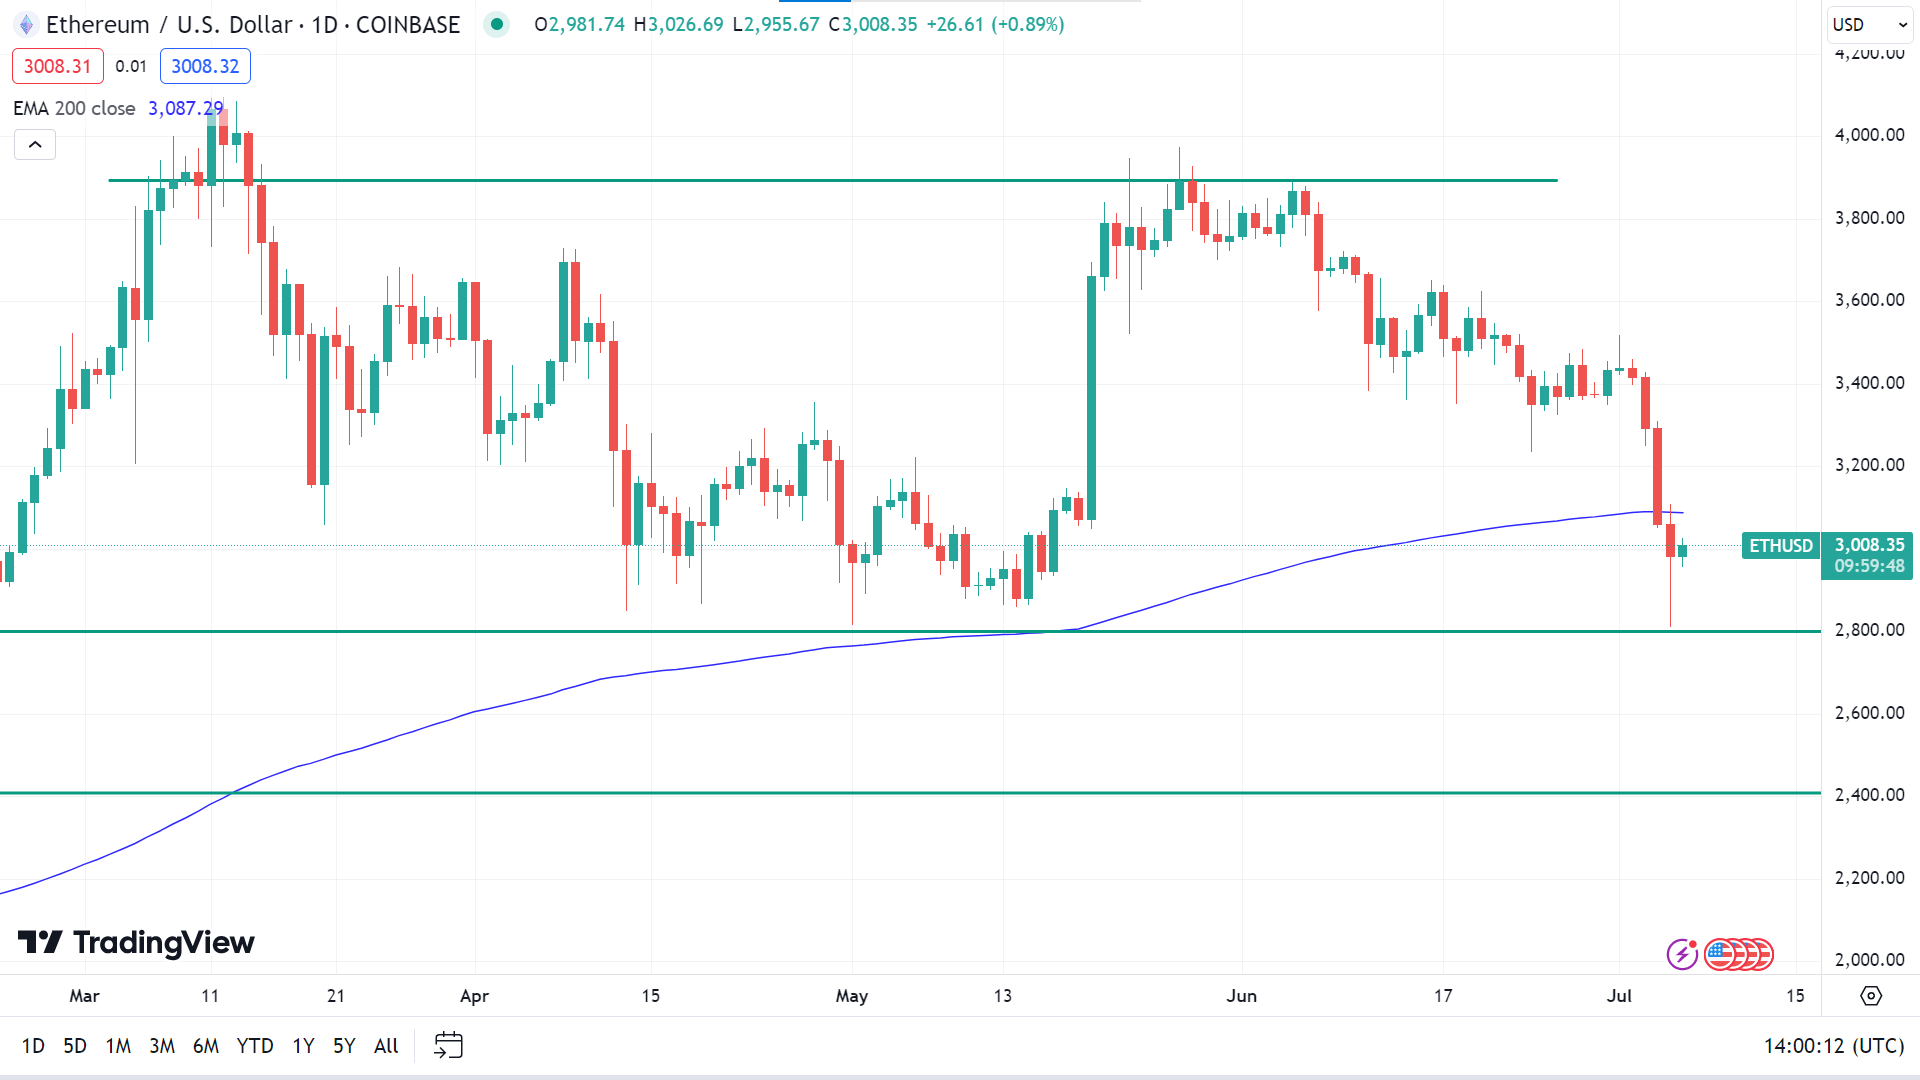
When writing, the price is floating below the EMA 200 line on the daily chart, indicating the price may head toward the primary support of 2809.41, followed by the next support near 2412.40.
Meanwhile, if the price bounces above the EMA 200 line, it will indicate that the price may head to the primary resistance of 3372.01, and any breakout can trigger the next resistance near 3799.01.
Tesla Stock (TSLA)
Fundamental Perspective
With approximately 3.2 billion shares outstanding, Tesla's market capitalization has rebounded to $802 billion, up from its 2024 low of $453 billion when the stock dipped to $142.05 on April 22.
Wedbush Securities analyst Dan Ives is notably optimistic about Tesla's prospects, setting a $300 target for its shares, indicating a potential 22% upside. Ives highlights the importance of Tesla's upcoming robotaxi-focused event on August 8, viewing it as a crucial milestone in the company's self-driving ambitions. He believes investors have yet to fully appreciate Tesla's pivotal role in the AI-driven autonomous future.
Ives emphasizes that Wall Street needs to recognize Tesla as the most undervalued AI opportunity in the market. The forthcoming Robotaxi Day is expected to pave the way for full self-driving capabilities and an autonomous future.
Additionally, analysts at TPH predict rising consensus estimates for Tesla's quarterly earnings, driven by higher delivery and energy-storage projections. Tesla is set to report its second-quarter results on July 23, with analysts forecasting adjusted earnings of 60 cents per share on $24 billion in sales, compared to 91 cents per share on $24.9 billion in sales in the same quarter of 2023.
TPH analysts, however, anticipate 75 cents per share, expecting higher energy-storage volumes to enhance Tesla's profitability significantly. They project 2024 deliveries at 1.74 million vehicles, slightly below the broader market expectation of around 2 million.
Tesla Stock Forecast Technical Perspective
The last weekly candle closed as a long, solid green, recovering from previous losses of the current year, leaving optimism that the next candle might be another green one.
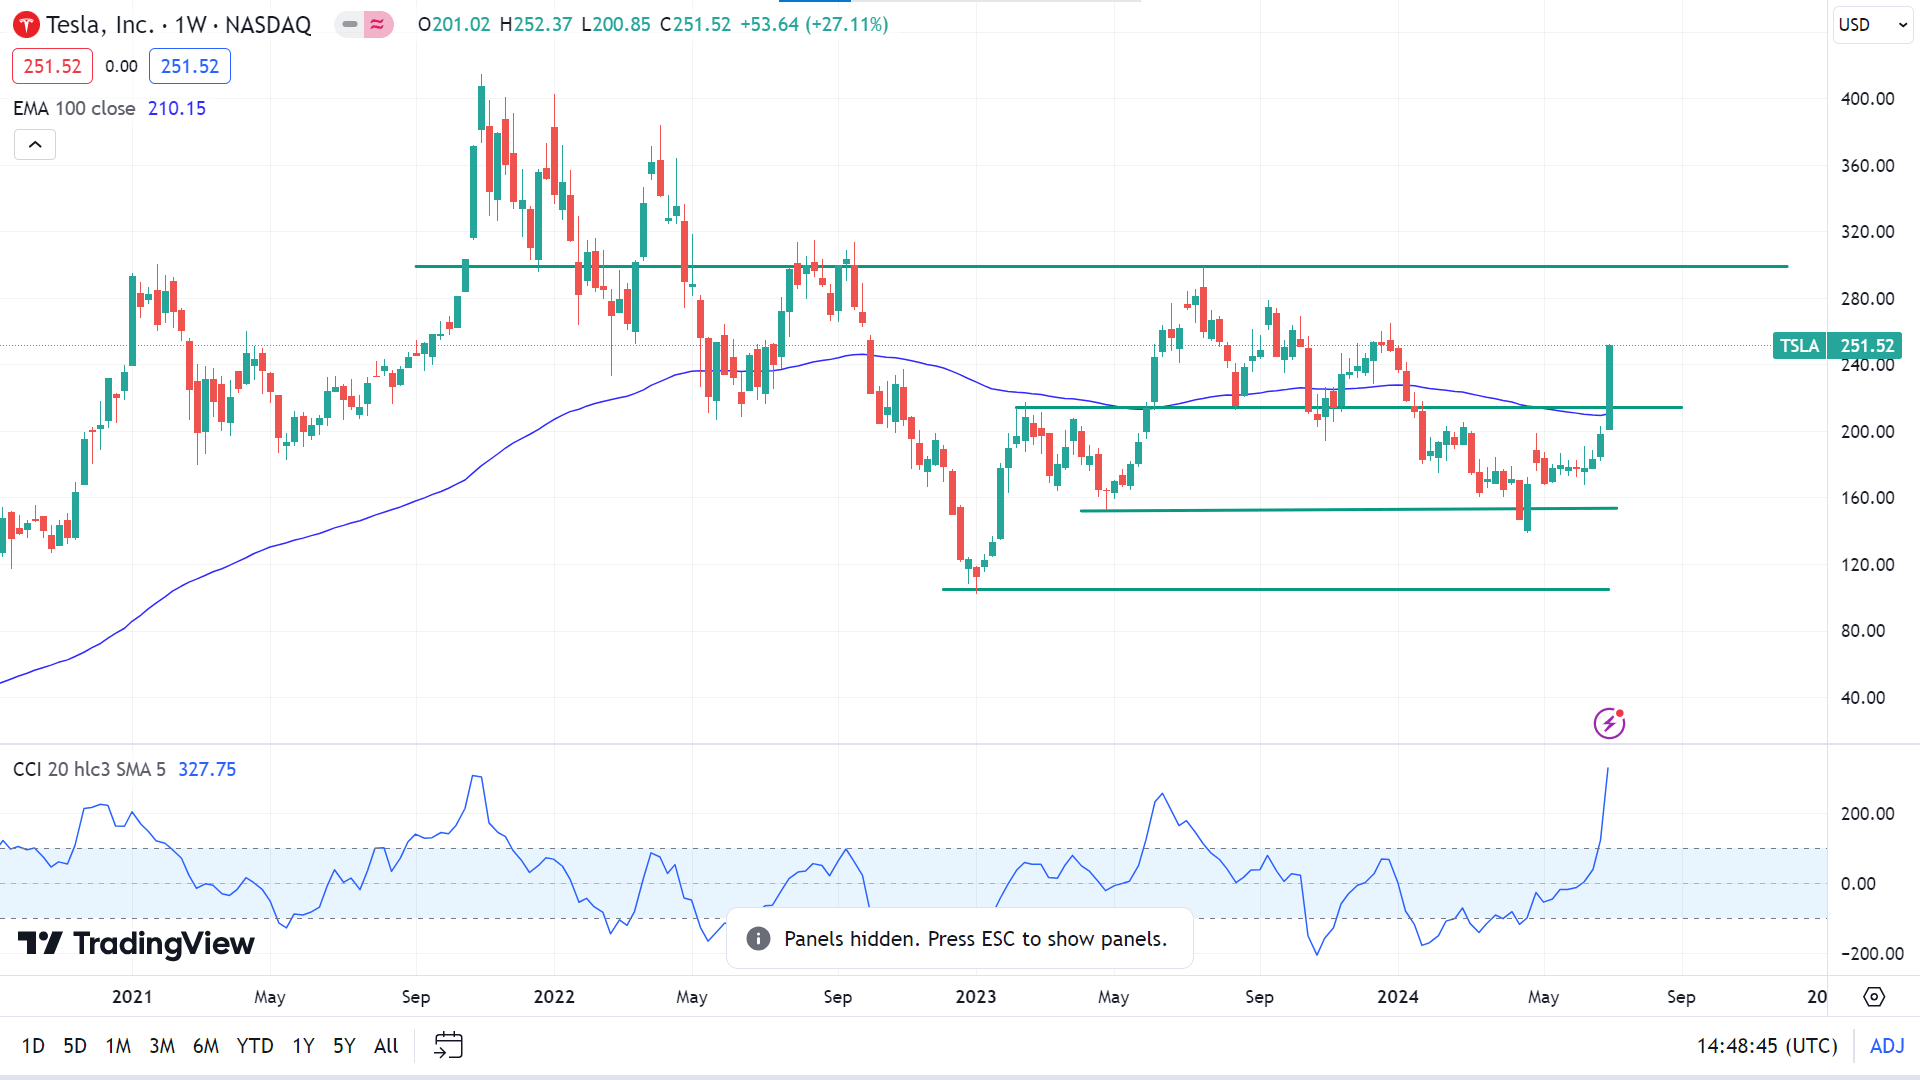
On the daily chart, the price exceeds the EMA 100 line, reflecting solid bullish pressure, whereas the CCI indicator signal line heads downward, dimming hope for sellers shortly. According to the EMA 100 line, the TSLA stock price may head to regain the nearest peak of 278.98, and any breakout can trigger the next resistance near 313.80.
Meanwhile, the CCI indicator suggests a retracement of the current bullish trend. On the downside, the nearest support is near 214.54, followed by the next support near 201.01.
Nvidia Stock (NVDA)
Fundamental Perspective
In recent months, the fundamentals driving the AI boom have only strengthened. In May, Nvidia reported a remarkable 262% increase in sales for its fiscal first quarter and a 461% surge in earnings compared to the previous year. Given the forecasted 37% sales growth, Nvidia's valuation, about 35 times the 2025 consensus earnings, seems justified.
The industry outlook for Nvidia continues to improve. A recent JP Morgan survey of 166 CIOs, responsible for $123 billion in annual enterprise tech spending, suggests that generative AI hardware spending could grow by over 40% annually over the next three years, increasing from 5% of IT budgets this year to 14.5% by 2027. Piper Sandler's report indicated that nearly half of enterprises have moved from AI testing to implementation in the past year.
Despite the frequent discussions about AI doomsday scenarios, most spending is focused on enhancing company efficiency. Nvidia's processors are pivotal in extracting insights from vast unstructured data. Companies are transitioning from traditional information retrieval models to generative AI approaches for on-demand insights, an essential shift in today's competitive landscape.
Investors might still need to be more accurate about Nvidia's potential. Philippe Laffont of Coatue Management highlighted at a Bloomberg investing event that trillions of dollars invested in CPU infrastructure will eventually need replacement with GPU-focused equipment, indicating significant future spending. Coatue has heavily invested in Nvidia, with its latest filings showing a stake worth $1.25 billion as of March 31.
Nvidia Stock Forecast Technical Perspective
The last weekly candle closed green with a small body after a doji candle confirmed buyer activity, leaving room for buyers in the upcoming week.
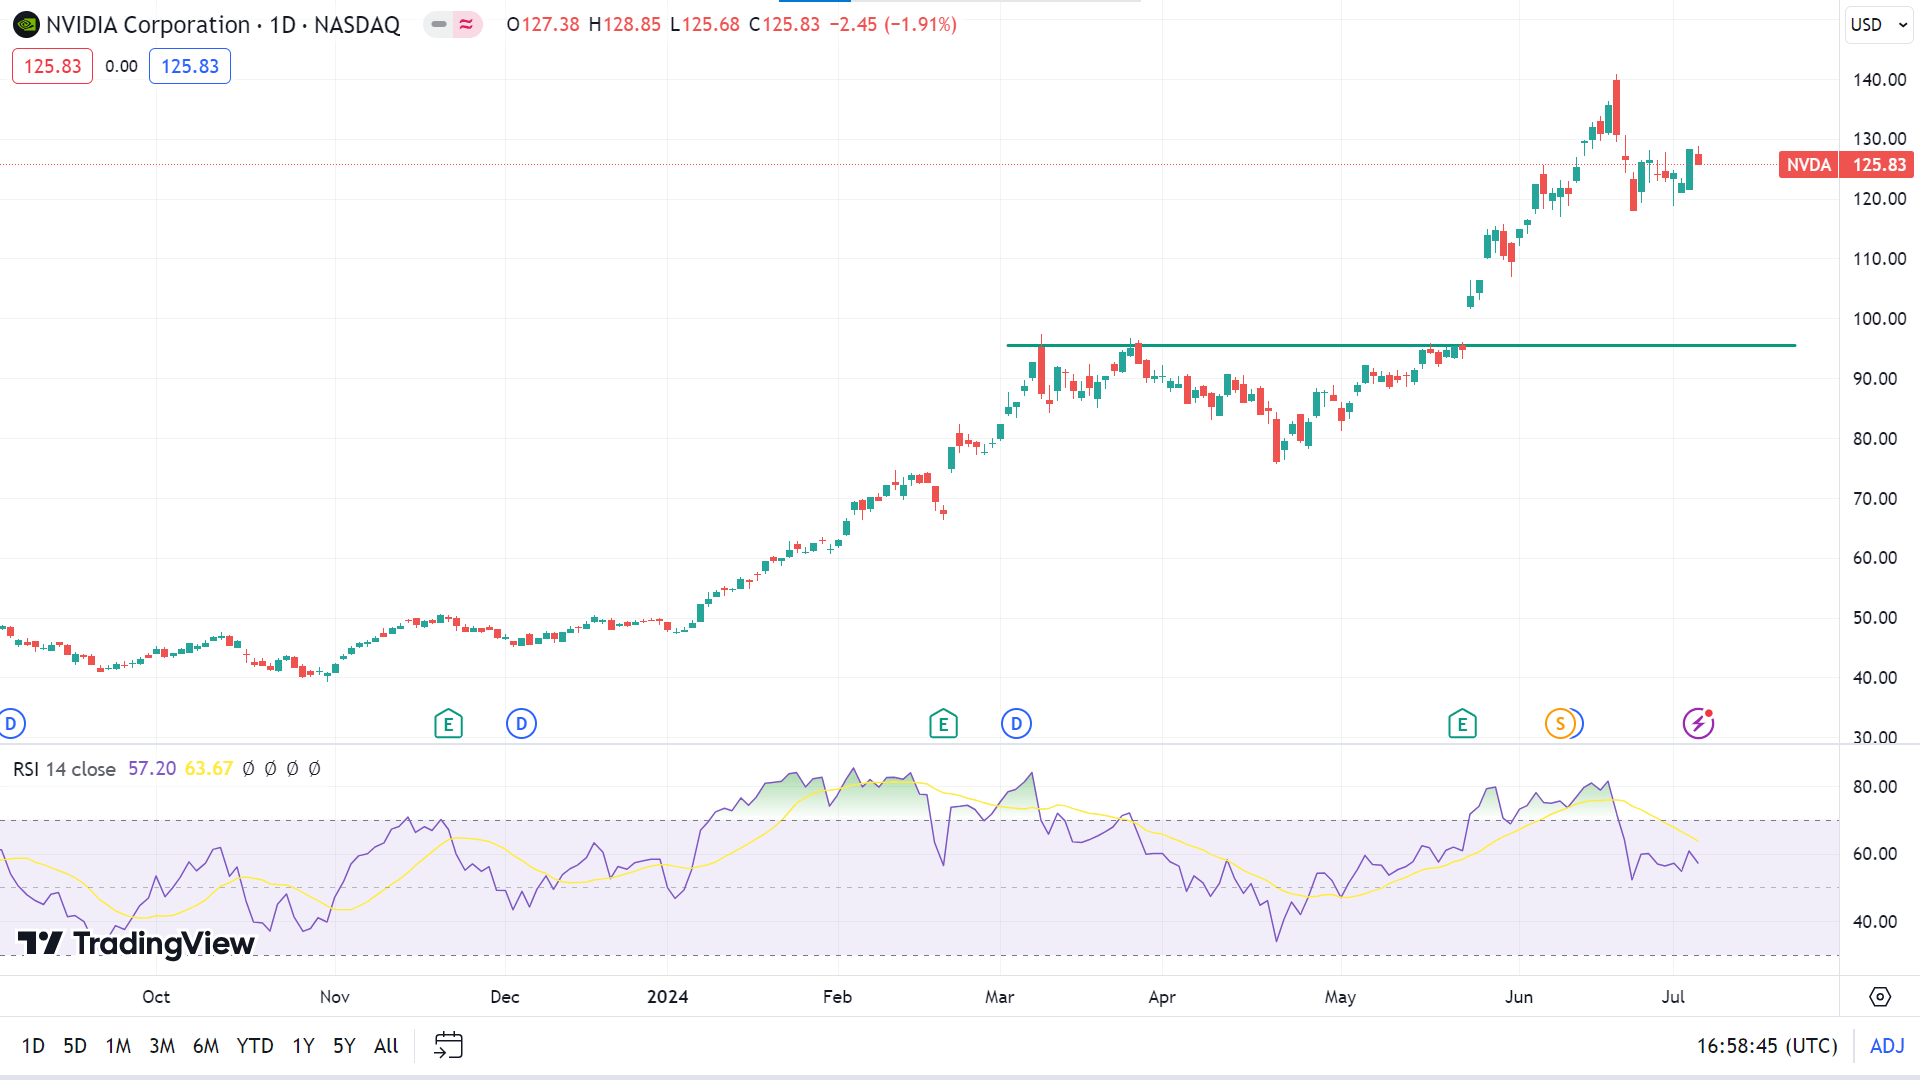
On the daily chart, the RSI indicator readings remain neutral, with the signal line moving above the midline, which suggests the price can still regain the peak of 140.76, whereas the next possible resistance is near 143.21.
Meanwhile, if the RSI signal line starts edging below the midline, it will indicate the NVDA stock price may decline to the primary support of 118.04, followed by the next support near 111.89.
WTI Crude Oil (USOUSD)
Fundamental Perspective
West Texas Intermediate (WTI) oil prices are currently around $83.50 per barrel. Recent data indicating OPEC's increased production for the second consecutive month in June suggests a potential easing of tight oil markets, exerting downward pressure on prices.
Geopolitically, Israeli Prime Minister Benjamin Netanyahu informed US President Joe Biden about resuming stalled negotiations on a hostage release deal with Hamas. An Israeli negotiator highlighted a revised proposal from Hamas, suggesting a genuine chance of reaching an agreement. This development could reduce supply threats from the Middle East, further influencing oil prices.
Strong summer demand expectations have significantly boosted oil demand in the United States. According to the American Automobile Association (AAA), travel is projected to be 5.2% higher than in 2023, with car travel alone increasing by 4.8%.
Additionally, weaker US economic data has fueled speculation that the Federal Reserve might lower borrowing costs in 2024. Reduced borrowing costs stimulate economic growth in the US, potentially increasing oil demand and supporting crude oil prices.
Oil Prices Forecast Technical Perspective
On the weekly chart, the last candle closed green, posting four consecutive weeks of growth, indicating that the next one might also be another green one.
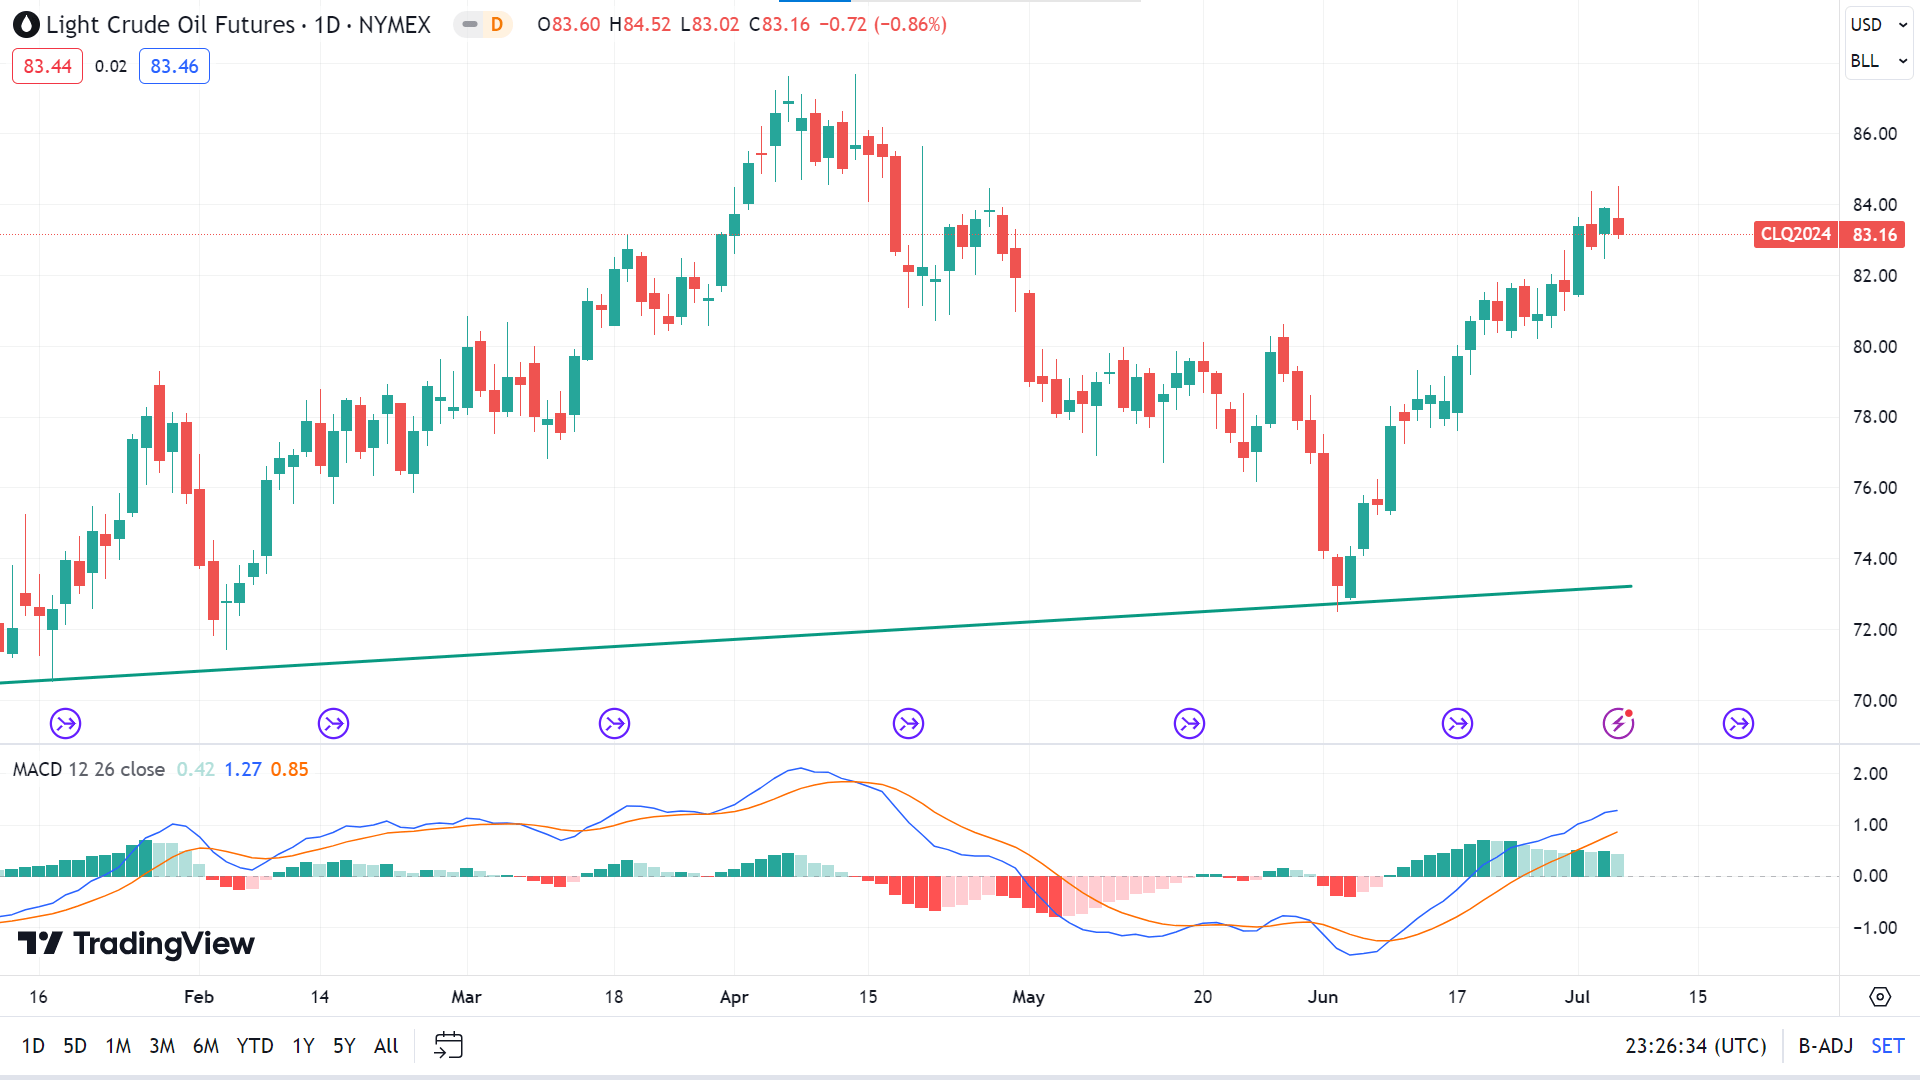
The MACD indicator window suggests the price remains on a bullish trend currently on the daily chart, as the signal lines edge upside, surpassing the midline of the indicator window and green histogram bars above the midline. So, the price may reach the nearest resistance of 85.24, followed by the next resistance near 89.15.
Meanwhile, the MACD histogram color is fading, dimming hope for sellers. So, on the downside, the primary support is near 80.03, followed by the next support near 75.19.


