EURUSD
Fundamental Perspective
As the trading week draws to a close, the EUR/USD currency pair finds itself in a relatively stable position, hovering around the 1.0660 level, which traders have frequently visited.
The US Purchasing Manager Index (PMI) data exhibited some deviation from expectations, leading to a modest retracement in the value of the US Dollar (USD) during Friday's trading session. However, these losses remained contained within intraday boundaries.
Meanwhile, European PMI figures, released earlier on Friday, showed the Euro (EUR) experiencing a slight pullback following an unexpected decline. Notably, the manufacturing component of the PMI came in at 43.4, falling short of the projected 44.0. On the other side of the Atlantic, the US Manufacturing PMI exceeded expectations, registering a figure of 48.9 for September, up from 47.9 in August. However, the Services PMI component retreated to 50.2, disappointing market expectations, which had anticipated an increase to 50.6.
Technical Perspective
Source: tradingview.com
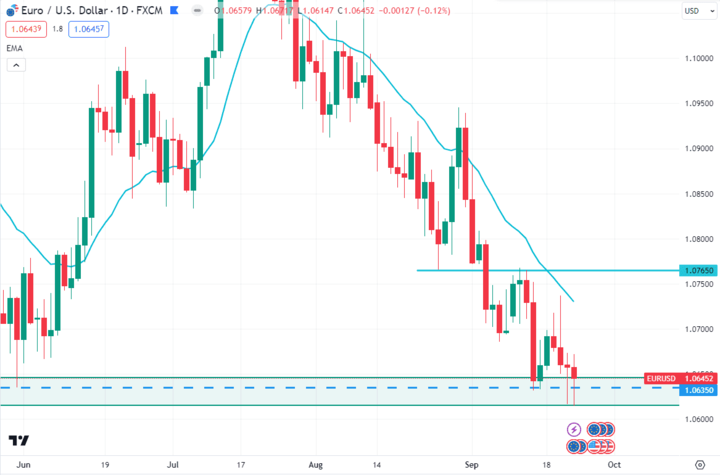
EURUSD is currently trading around the 1.0645 price area. After an impulsive bearish momentum, the price found support around the 1.0635 area, which is June 2023’s low. As per the current price action context, if the price can have an impulsive daily bullish candle close above the 1.0635 support level, the EURUSD price may retrace upward towards the 1.0765 event area before continuing further downside in the coming days.
GBPJPY
Fundamental Perspective
The Bank of Japan (BoJ) has chosen to retain its primary policy rate, upholding the existing negative rate regime at -0.1%. The BoJ remains committed to its robust and accommodative monetary policy measures, with a firm resolve to sustain Japanese inflation above the 2% threshold.
Presently, Japanese inflation hovers near the upper bound of policymakers' target range. However, it is widely anticipated that Japanese inflation will undergo a significant decline in the forthcoming months. Consequently, the BoJ does not feel compelled to hastily reverse its negative rate policy. The central bank is inclined to maintain this stance until they are confident that inflation will consistently surpass their minimum target.
Technical Perspective
Source: tradingview.com
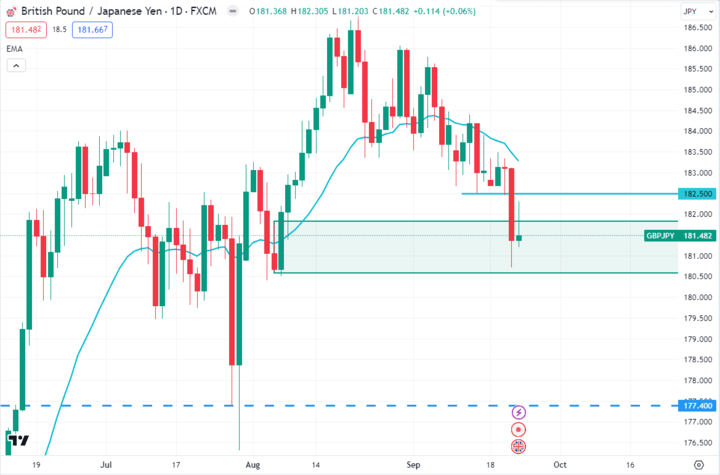
GBPJPY is currently residing in the demand zone, which is around 180.60 - 181.80 area. After breaking below the 182.50 support level, the bears pushed the price down but failed to continue below the demand zone last week. As per the current situation, the price may retrace higher towards the 182.500 event area, then if we find any impulsive daily bearish candle close, we can target the 177.40 support level in the days ahead.
NAS100
Fundamental Perspective
The NAS100 index is poised for a week. Recent data reveals that the tech-heavy index has been riding high on strong corporate earnings and robust economic data. However, concerns over rising interest rates and global supply chain disruptions could introduce a degree of uncertainty.
Investors should closely monitor key support and resistance levels, with $16,000 acting as a critical threshold. Positive developments in trade talks or central bank decisions may provide upward momentum, while adverse news regarding inflation or geopolitical tensions could trigger pullbacks. The NAS100's performance in the upcoming week hinges on a delicate balance of economic indicators and external factors, making it essential for traders to stay nimble and adapt to swiftly changing market conditions.
Technical Perspective
Source: tradingview.com
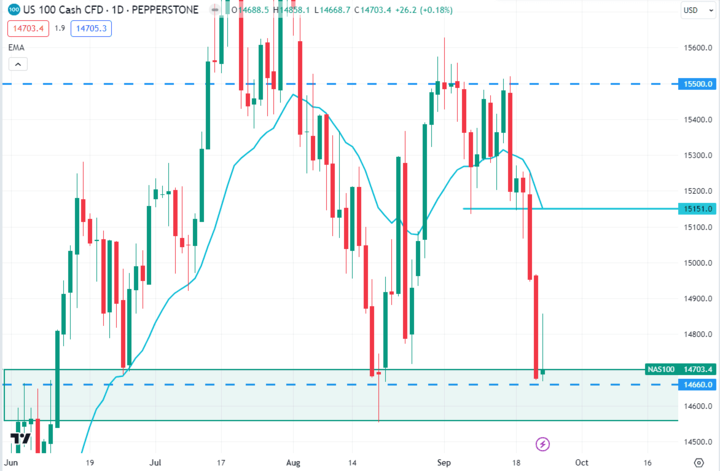
NAS100 is currently trading around $14703.0 price area. After a strong bearish move last week, the price found support around the $14660.0 event area. As per the current price action, if the price can have an impulsive daily bullish candle close above the $14660.0 support area, NAS100 may retrace upward toward the $15151.0 area in the coming days.
SP500 (SPX500)
Fundamental Perspective
The S&P 500 index enters the week with a backdrop of mixed signals. Recent economic data has shown resilient job growth and corporate earnings, bolstering investor confidence. However, concerns about potential interest rate hikes and inflation linger, which could temper market enthusiasm.
Key levels to watch include the $4,500 support and $4,600 resistance. Favorable developments on the monetary policy front or positive trade news may propel the index higher, while any surprises related to inflation or global geopolitical events could induce short-term pullbacks.
The SP500's performance in the upcoming week will be influenced by a delicate interplay of economic factors and external events. Traders should remain vigilant and adaptable in navigating this dynamic market landscape.
Technical Perspective
Source: tradingview.com
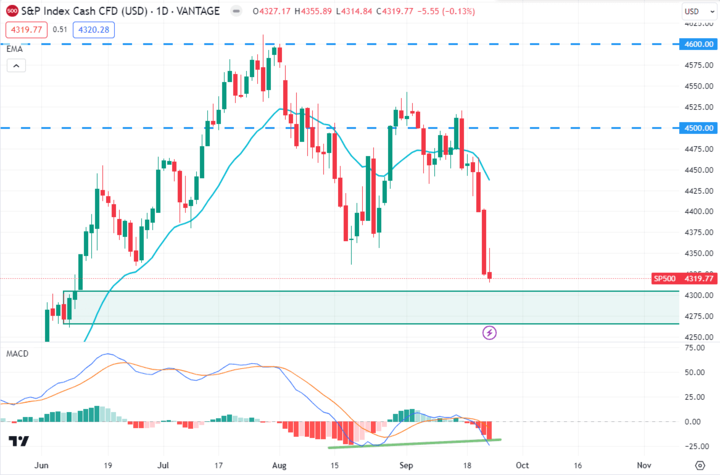
SP500 is currently trading around the $4320.00 price area and may continue further downward towards the $4305.00 - $4265.00 demand zone. So, if the price continues further downside towards the $4305.00 - $4265.00 demand zone, and bounces with the D1 bullish candle close, SP500 bulls may regain momentum and push the price higher towards $4500.00 price area again in the days ahead.
HK50
Fundamental Perspective
The Hong Kong Hang Seng Index (HK50) faces a pivotal week from September 25th to September 29th, 2023, amid a backdrop of both optimism and uncertainty. Recent data reflects a resilient Hong Kong economy, with robust trade figures and recovering retail sales. However, political tensions and concerns over global supply chain disruptions linger as potential headwinds.
Critical levels to monitor are 27,500 as support and 28,000 as resistance. Positive developments in the Hong Kong-China relationship or progress on international trade agreements may fuel upward momentum. Conversely, any escalation of geopolitical tensions or unforeseen economic challenges could trigger market volatility.
The HK50's performance in the upcoming week will be shaped by a delicate balance of economic indicators and geopolitical factors, necessitating a cautious and adaptable approach for traders and investors.
Technical Perspective
Source: tradingview.com
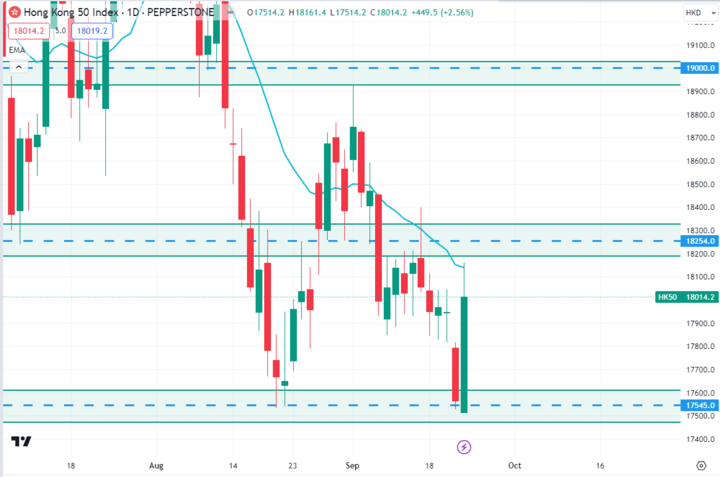
The HK50 price bounced from the $17545.0 psychological event level and is currently trading around the $18014.0 price area. As per the current price action, the price may recover higher towards the $18254.0 resistance area. So, if the price recovers higher towards the $18254.0 event area and rejects with an impulsive daily bearish candle, the bears may push the price down toward the $17454.0 area again in the days ahead.
Bitcoin (BTC)
Fundamental Perspective
Bitcoin (BTC) is poised for an intriguing week. Recent trends indicate growing institutional adoption and a continued shift towards digital assets as an inflation hedge. However, regulatory developments are a significant wild card, with governments worldwide exploring policies that could impact the cryptocurrency market.
Key price levels to observe include $45,000 as support and $50,000 as resistance. Positive news regarding regulatory clarity or a surge in institutional investment could drive BTC higher. Conversely, any adverse regulatory actions or unforeseen market shocks may lead to short-term setbacks.
BTC's performance in the upcoming week may be influenced by a blend of institutional interest and regulatory dynamics, requiring investors to stay vigilant and agile in navigating this evolving landscape.
Technical Perspective
Source: tradingview.com
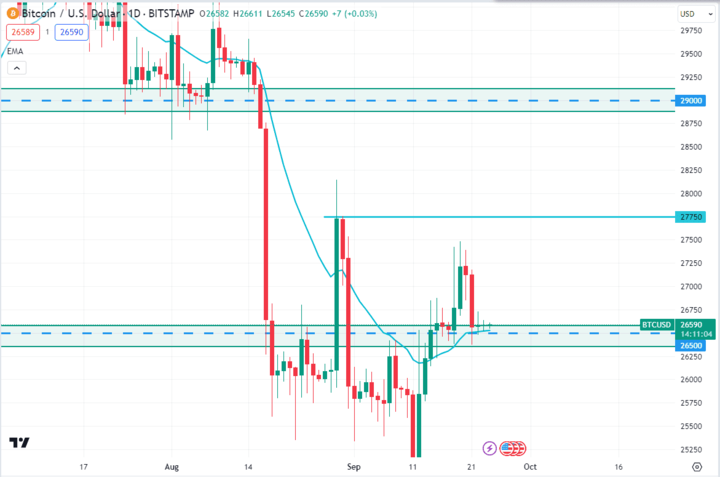
BTC is currently residing around the $26,597 price area. After breaking above the $26,500 resistance level, the price retraced back to the dynamic level of 20 EMA. As per the current price action context, if the price can have an impulsive daily bullish candle close above the dynamic level of 20 EMA, the bulls may continue its bullish momentum toward $27,750 as a first target. The second target will be the $29,000 price area if the price can break above the $27,750 price level in the coming days.
Ethereum (ETH)
Fundamental Perspective
Ethereum's performance in the upcoming week will be influenced by its evolving ecosystem and technical developments, necessitating a cautious and informed approach for traders and investors. Ethereum (ETH) enters the week with a mixture of promise and caution. Recent developments showcase the growing utilization of Ethereum's blockchain for decentralized applications and smart contracts, bolstering its long-term potential. However, scalability concerns and potential network upgrades loom on the horizon, introducing an element of uncertainty.
Key price levels to watch include $3,000 as crucial support and $3,500 as resistance. Positive news regarding Ethereum's network upgrades or increased adoption of DeFi and NFTs may push ETH higher. Conversely, scalability challenges or market volatility could lead to short-term price fluctuations.
Technical Perspective
Source: tradingview.com
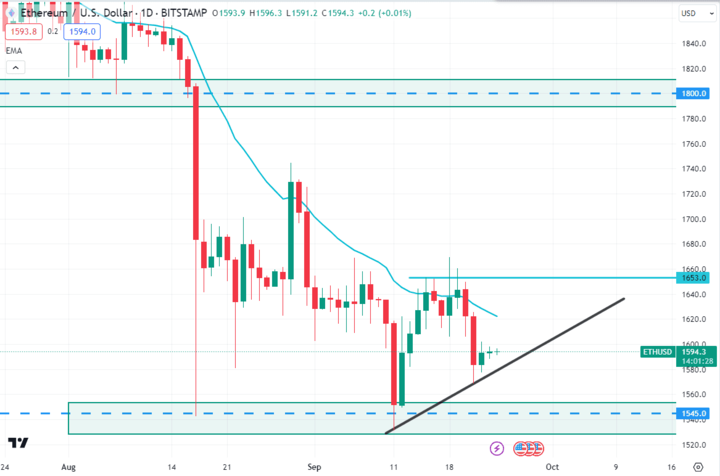
ETH is currently residing around the $1594.0 price area. Last week, bears pushed the price down after rejecting the dynamic level of the 20 EMA, but failed to continue below the $1580.0 price area. As per the current situation, if the bulls push the price further higher and have a daily bullish candle close above the $1656.0 price level, ETH may continue its bullish momentum towards the $1800.0 psychological price area in the coming days.
Tesla Stock (TSLA)
Fundamental Perspective
Tesla (TSLA) faces a pivotal week marked by a complex landscape. Recent data underscores Tesla's leadership in electric vehicles and its expansion into new markets. However, supply chain bottlenecks and rising material costs pose challenges for the automaker.
Tesla's performance in the upcoming week will be shaped by its ability to navigate operational hurdles and capitalize on its innovation. Investors should stay vigilant and adaptable in this dynamic market.
Technical Perspective
Source: tradingview.com
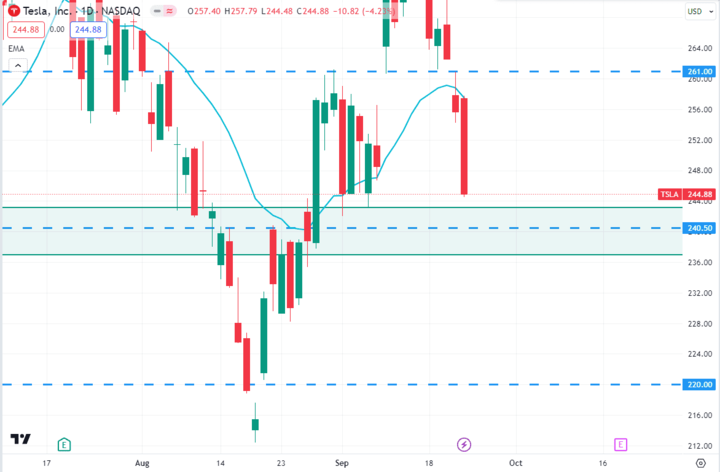
TSLA stock is currently trading at around the $244.88 price area, after breaking below the $261.00 price level. As per the current price action, if the price continues further down toward the $240.50 support level and bounces with an impulsive bullish candle, the bulls may push the price higher toward the $261.00 price area in the days ahead. Conversely, if the price breaks below the $240.50 support level with an impulsive daily bearish candle, the bears may continue further downside toward the $220.00 price area in the coming days.
GOLD (XAUUSD)
Fundamental Perspective
Gold (XAU/USD) may start the week with a backdrop of mixed forces. Recent data reveals the precious metal's appeal as a safe haven amid global economic uncertainties and inflation concerns. However, expectations of potential interest rate hikes remain a significant variable, which could limit gold's upside potential.
Gold's performance in the upcoming week will be influenced by a delicate balance between its safe-haven allure and interest rate dynamics, demanding a cautious approach from traders and investors.
Technical Perspective
Source: tradingview.com
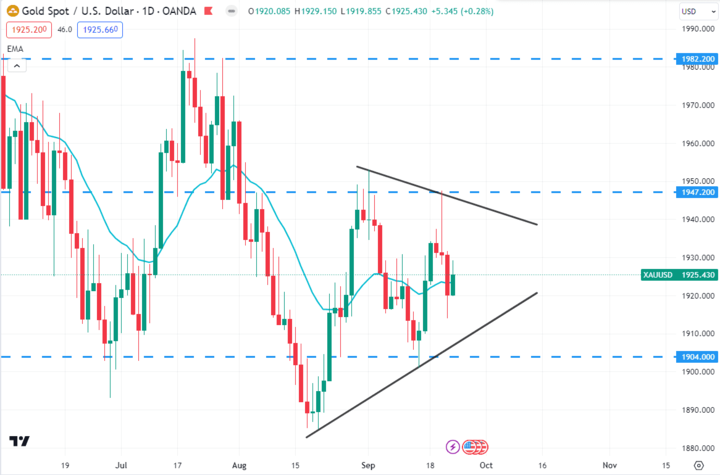
Gold is currently trading at around the $1925.43 price area after rejecting from the $1947.20 event level. The price has formed a triangle pattern on the daily chart and trading following its support and resistance level. As per the current price action, the price may continue toward the triangle pattern’s support. So, if the price bounces from the triangle pattern’s support with an impulsive daily bullish candle, our first target will be the $1947.20 price area. Furthermore, our second target will be the $1982.20 price area, if the price can break above the $1947.20 resistance level, in the coming days.
OIL (WTI)
Fundamental Perspective
Crude oil (WTI) faces a pivotal week from September 25th to September 29th, 2023, marked by a complex interplay of factors. Recent data highlights a tight global oil market due to supply disruptions and geopolitical tensions in key oil-producing regions. However, concerns about slowing economic growth and a transition to renewable energy sources cast shadows over demand.
Critical levels to watch include $70 as support and $75 as resistance. Positive news regarding supply disruptions or geopolitical conflicts may propel oil prices higher. Conversely, indications of robust economic growth or accelerated clean energy adoption could lead to short-term declines. Oil's performance in the upcoming week hinges on a delicate balance between supply constraints and demand uncertainties, demanding vigilance from traders and investors.
Technical Perspective
Source: tradingview.com
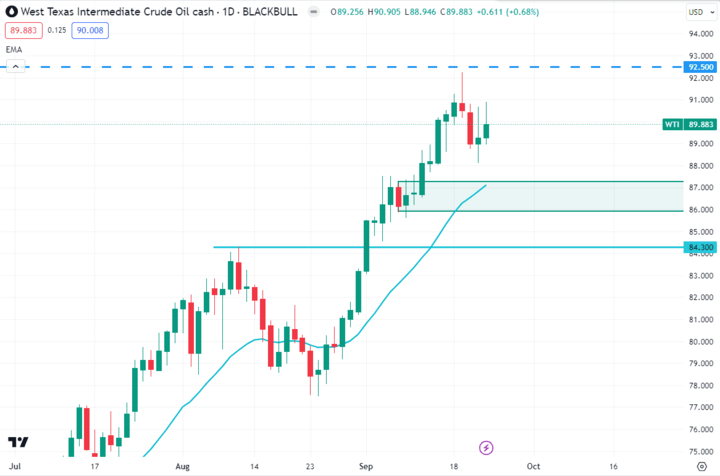
Oil price broke above the $84.30 key level and is currently trading around $89.88 price area. As per the current price action context, the price may retrace down toward the dynamic level of 20 EMA, which is currently residing near the demand zone. So, if the price retraces down towards the dynamic level of 20 EMA and bounces with an impulsive daily bullish candle, the bulls may continue further higher towards the $92.50 psychological price area in the coming days.


