EURUSD
Fundamental Perspective
EURUSD stabilized slightly after plunging to a two-year low of 1.0220 on Thursday. Analysts anticipate further declines toward parity, driven by contrasting monetary policy stances between the Federal Reserve (Fed) and the European Central Bank (ECB).
According to its latest Summary of Economic Projections, the Fed has projected fewer rate cuts for 2025, expecting the federal funds rate to end the year at 3.9%. This outlook, signaling two rate cuts compared to four anticipated in September, contrasts with the ECB's continued commitment to its current pace of monetary easing.
Market participants have also reduced expectations for Fed dovishness. They anticipate that President-elect Donald Trump's policies, including tighter immigration, increased import tariffs, and lower taxes, will stimulate U.S. economic growth and add inflationary pressures.
Although the U.S. Dollar Index (DXY) edged lower on Friday, it remains near its two-year high above 109.00, reflecting the Greenback's strength. Investors will closely monitor U.S. labor market data, which could shape expectations for Fed interest rate decisions. During its January meeting, the central bank is widely expected to maintain rates at 4.25%-4.50%.
Technical Perspective
The solid red candle on the weekly chart after a red doji declares the downtrend remains intact and leaves sellers optimistic for the upcoming week.
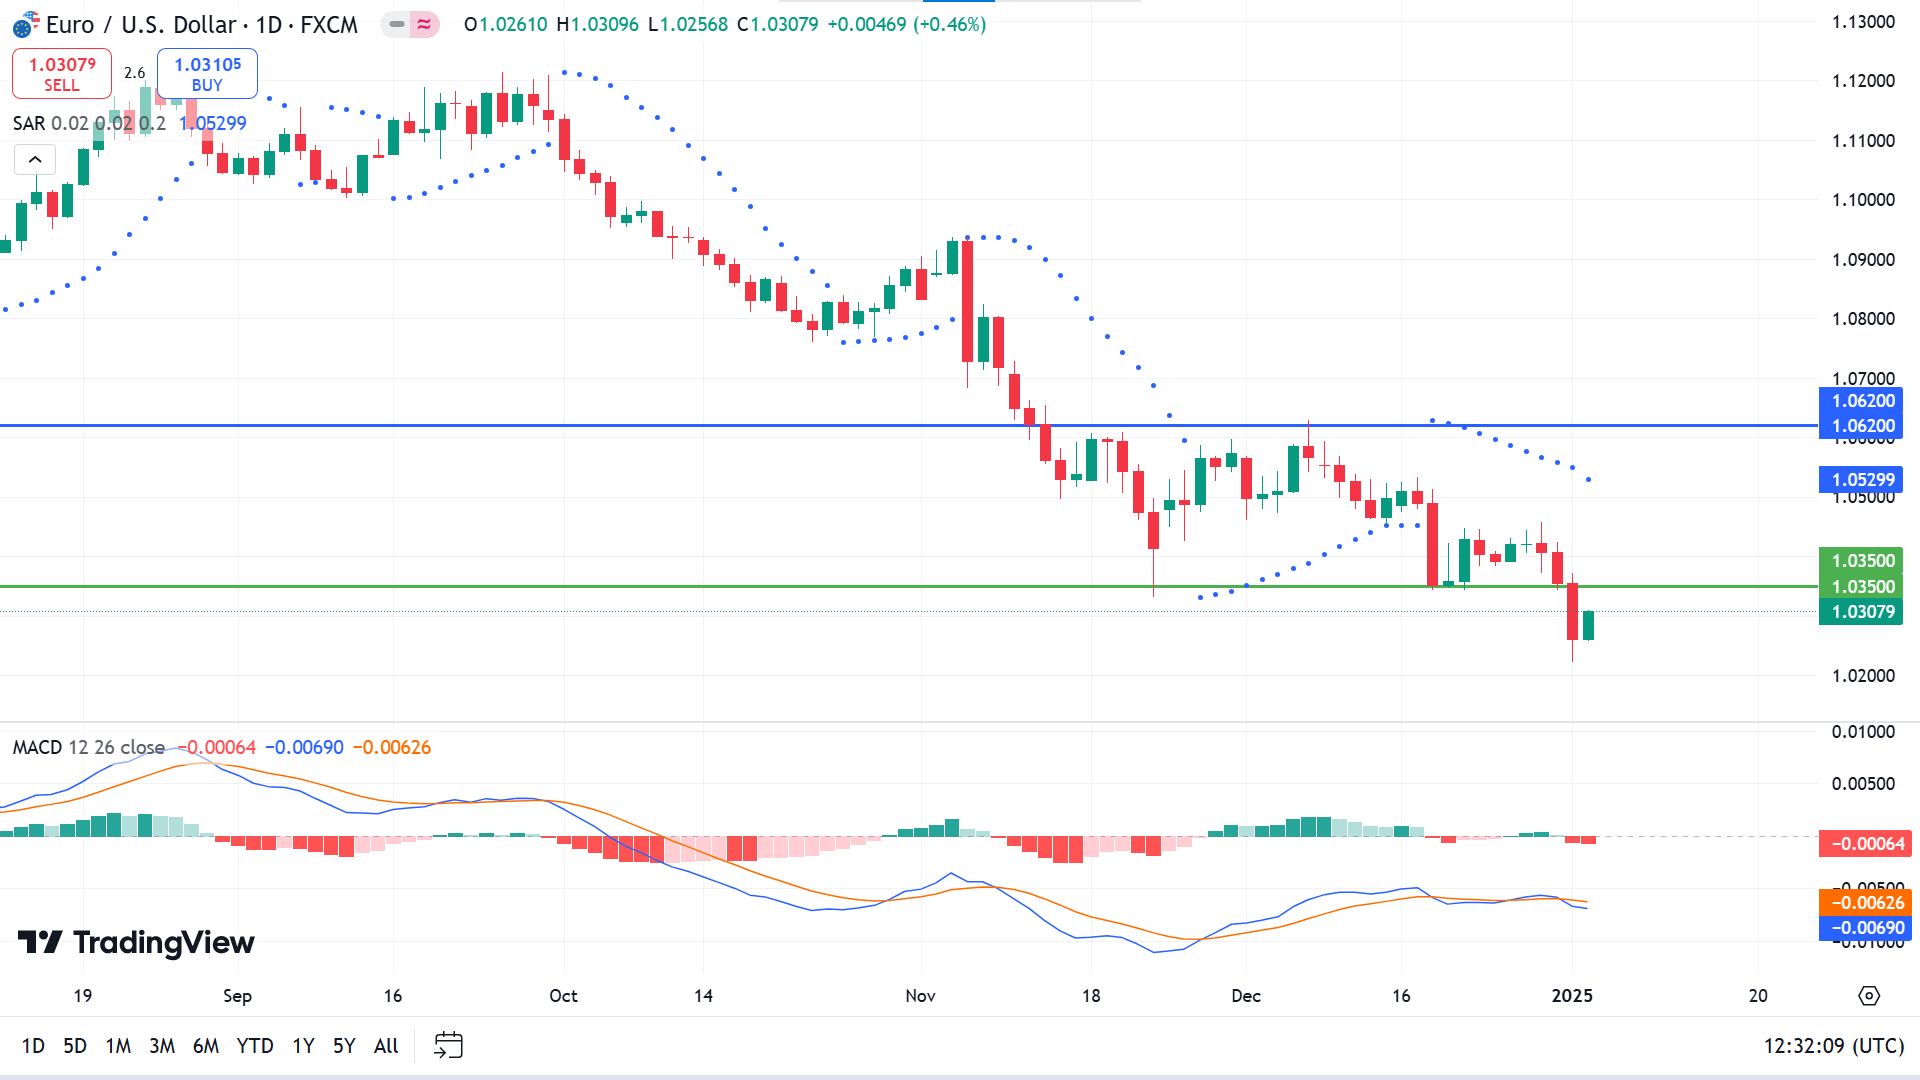
The Parabolic SAR dots above the price candles confirm the current bearish trend on the daily chart. The MACD indicator window confirms the seller's domination through dynamic signal lines, creating a bearish crossover and red histogram bars below the midline of the indicator window.
According to the current scenario, traders might look at the 1.0350 level to open adequate short positions that can drive toward the low of 1.0222, following the next support near 1.0074.
Meanwhile, a solid green daily candle closing above 1.0350 might disappoint sellers and enable short-term buying opportunities toward the primary resistance near 1.0620.
GBPJPY
Fundamental Perspective
The GBPJPY pair dipped to approximately 194.19 level before the weekly close, aided by Japanese authorities' verbal intervention. However, uncertainty surrounding the Bank of Japan's (BoJ) policy trajectory limits the Yen's recovery, with Japanese markets closed for the remainder of the week.
Traders remain alert for potential foreign exchange interventions by Japanese officials to counter Yen depreciation. Finance Minister Katsunobu Kato reiterated his concerns over the weakening Yen last week, signaling readiness to address excessive currency fluctuations.
This week, the BoJ will release its quarterly regional economic report, which is expected to evaluate the spread of wage increases across Japan. This report may offer insights into the BoJ's policy direction ahead of its January 24 meeting.
In contrast, the UK economic calendar for this week is notably light, with only low-impact data releases on the horizon. As a result, British Pound-related market activity is likely to remain subdued, with limited opportunities for significant price movements.
Technical Perspective
The last weekly candle ended as a solid red, failing to surpass the previous peak of 199.81 on the weekly chart, sparking short-term selling opportunities.
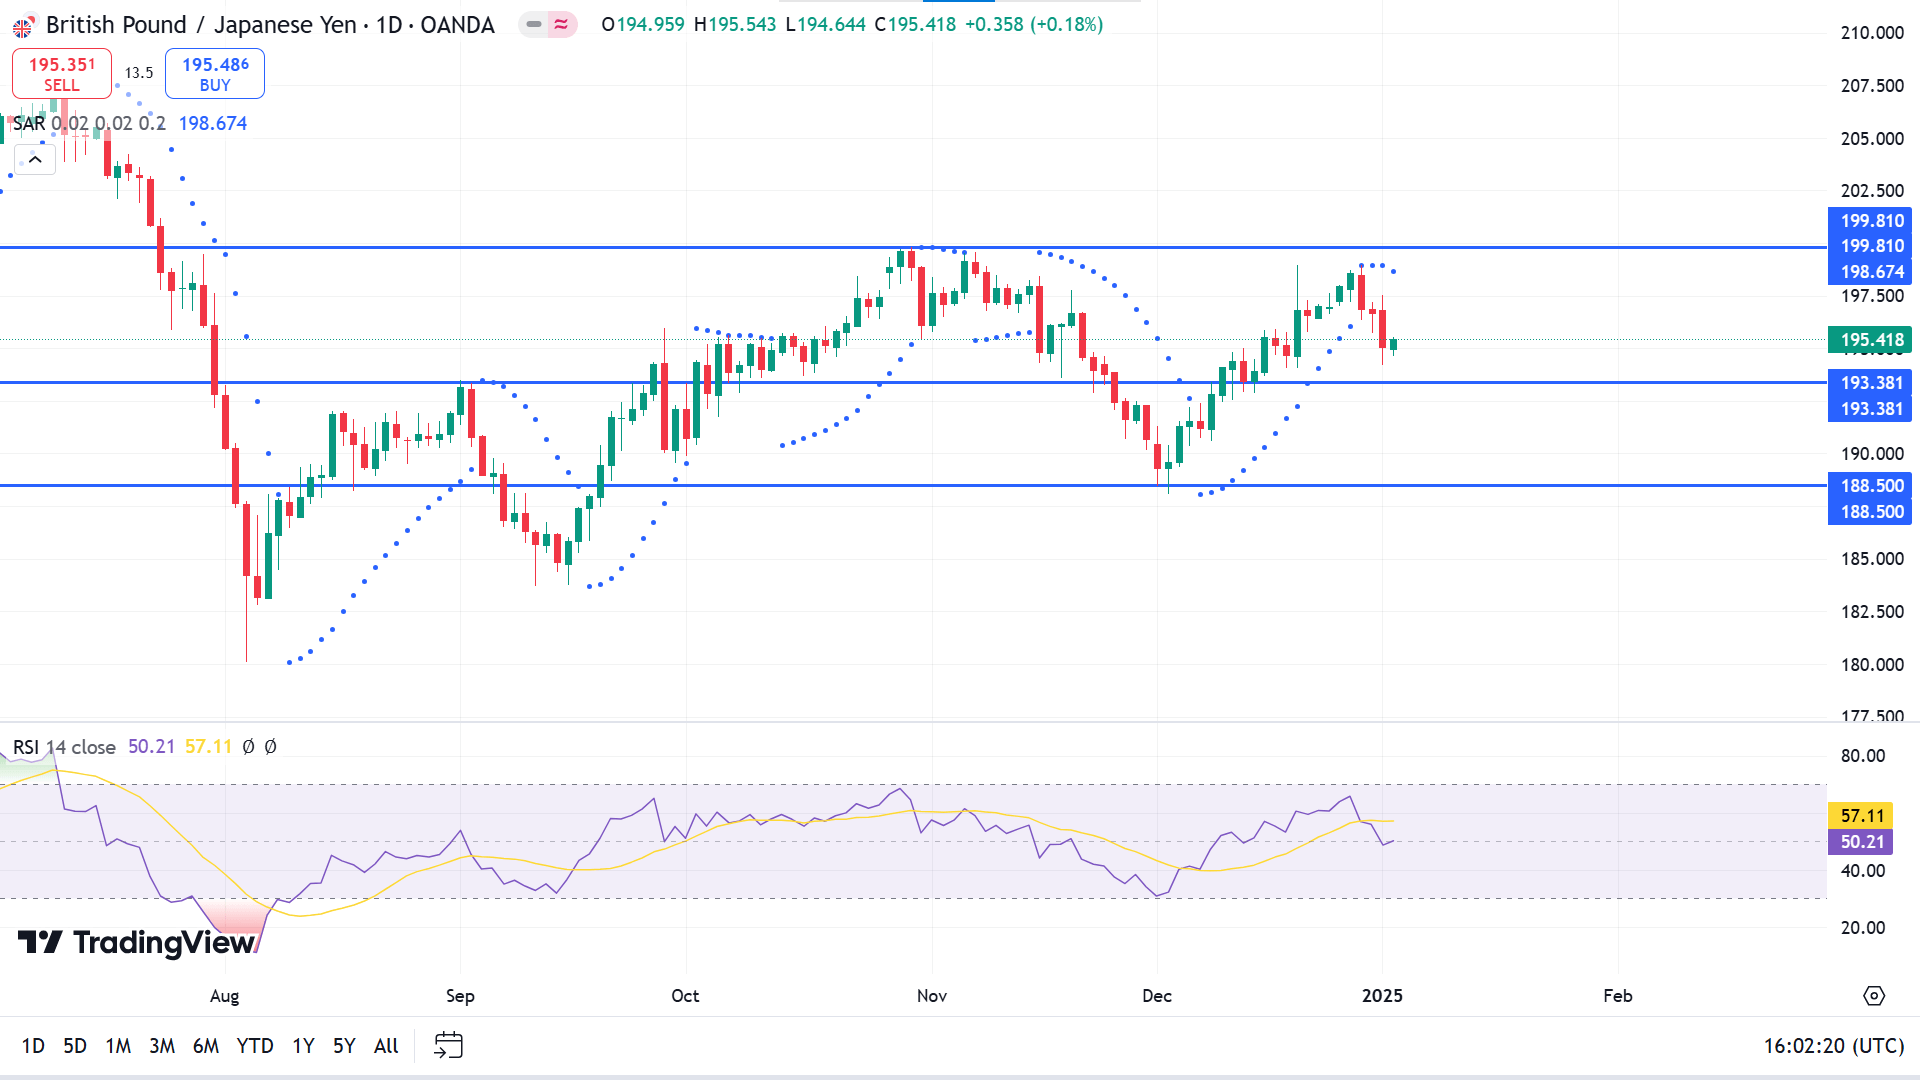
The RSI reading remains neutral as the dynamic line floats near the midline. In the meantime, the Parabolic SAR indicates recent bearish pressure through dots above the price candles.
Based on the indicators reading, the price remains below the historic 196.00 level, reflecting possibilities for reaching the primary support 193.38. A breakout below the primary support may trigger the price toward the following support near 188.50.
Meanwhile, if the price surpasses 196.00, it would invalidate the current bearish signal; besides, it might trigger buyers toward the primary resistance near 199.81.
Nasdaq 100 (NAS100)
Fundamental Perspective
In U.S. markets, equities snapped a five-day losing streak, their longest since April, with the S&P 500 and Nasdaq advancing over 1%. All 11 S&P sectors ended higher, led by consumer discretionary stocks, which rose 2.42%.
The dollar had rallied late last year as markets bet on President-elect Donald Trump's pro-growth policies, which were expected to drive inflation and limit the scope of Federal Reserve rate cuts in 2025 while supporting higher U.S. Treasury yields. The Fed's December policy statement further reduced market expectations for the number and magnitude of rate cuts this year.
For the week, the S&P 500 declined 0.48%, the Nasdaq dropped 0.51%, and the Dow slid 0.6%. The dollar index (DXY), which tracks the greenback against a basket of currencies, slipped 0.29% to 108.90. This followed a temporary recovery after the Institute for Supply Management reported a stronger-than-expected rise in its manufacturing index to 49.3 in December, the highest since March, up from 48.4 in November.
Technical Perspective
The last weekly candle was finished as a green hammer holding the support of 20,691, leaving buyers optimistic for the upcoming weeks.
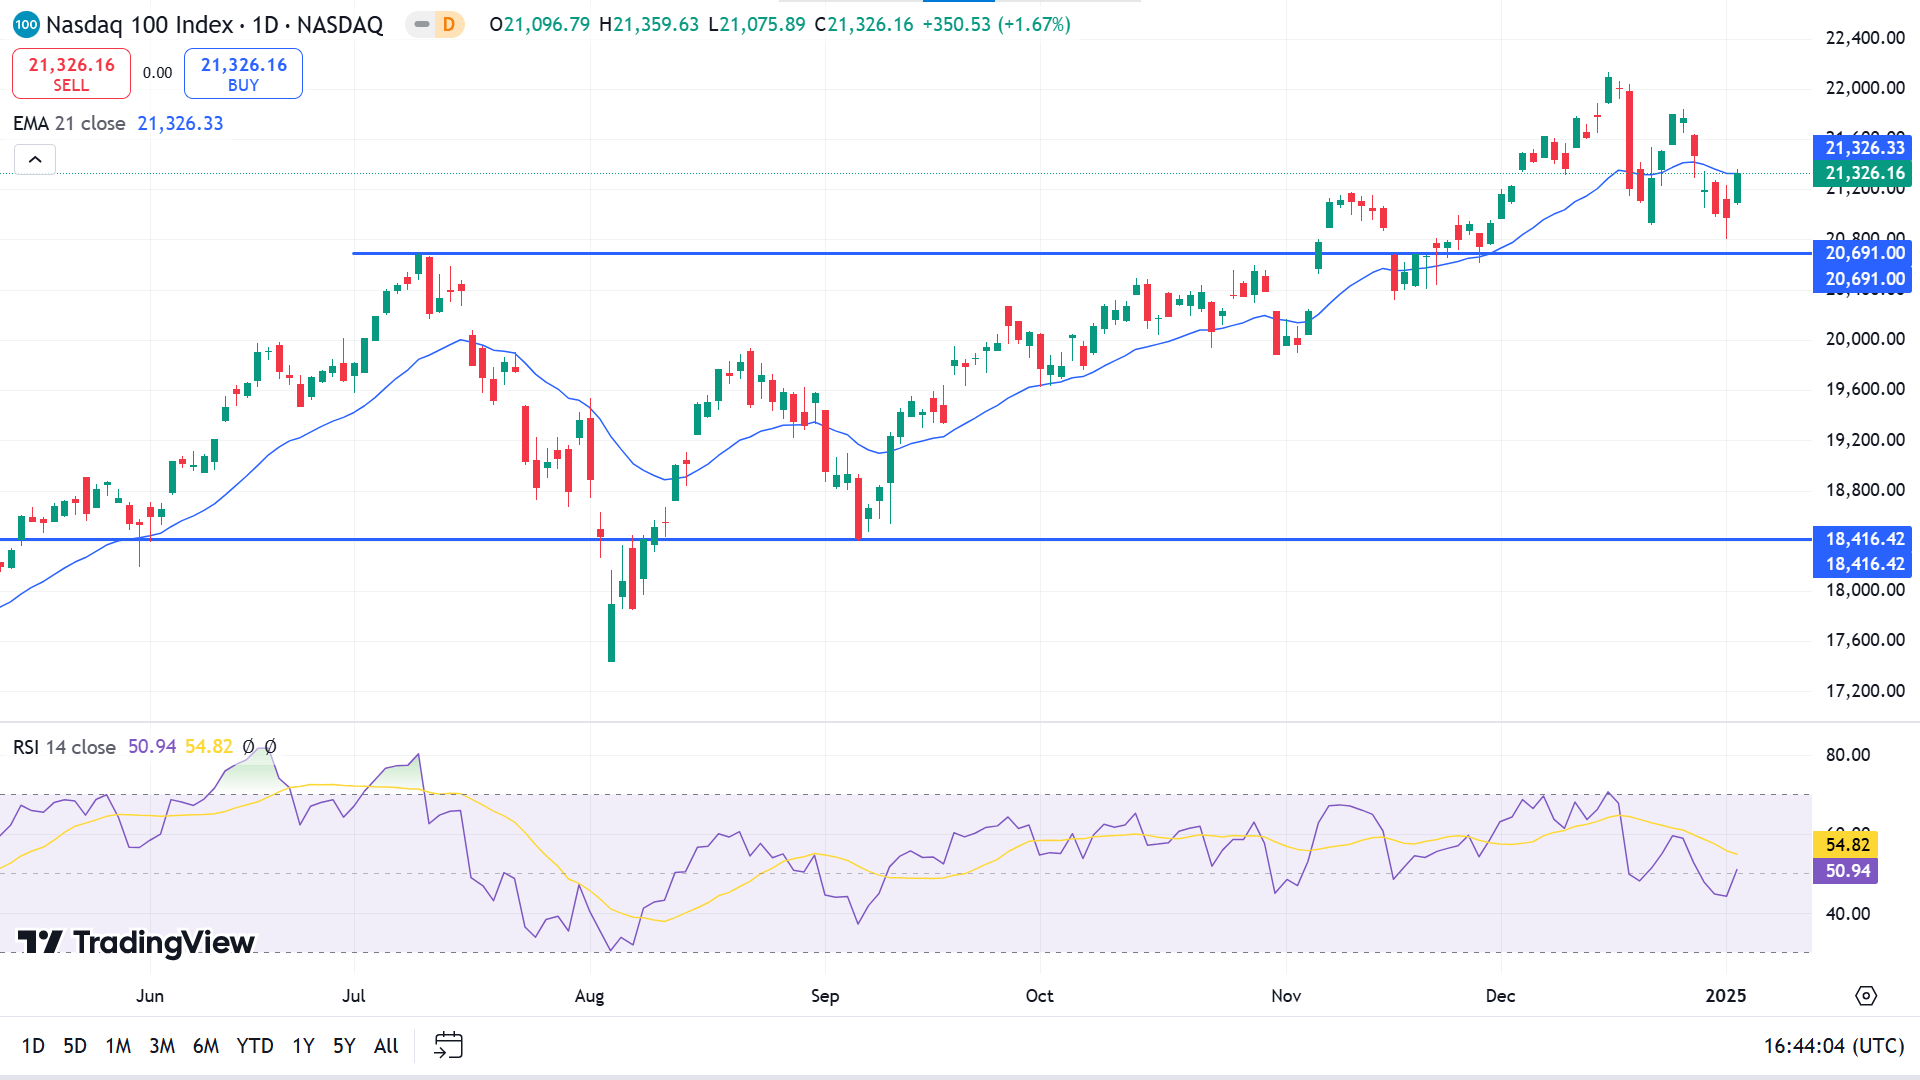
The price regains toward the EMA 21 line after declining below, which reflects buyers' activities on the asset price on the daily chart. The RSI indicator reading remains neutral as the dynamic line floats near the midline of the indicator window, edging upside, showing the overall trend is still bullish.
Based on the current market context, buyers are optimistic above the 20,691.00, which can drive the price toward the ATH of 22,133.22 or beyond.
On the other hand, if the price declines below 20,691.00, it would invalidate the current bullish signal. It might trigger short-term selling opportunities toward primary support of 19,721.52, following the subsequent support of 18416.42.
S&P 500 (SPX500)
Fundamental Perspective
The S&P 500 ended the week with a 0.5% decline, closing Friday at 5,942.47, following a shortened trading week due to the New Year's Day holiday. Despite a substantial 23% gain in 2024, the index slipped 2.5% in December.
Declines in materials and consumer sectors drove this week's losses. Materials declined 2.1%, with PPG Industries dropping 5.1% and Smurfit Westrock lost 3.8%. Consumer discretionary declined 1.5%, impacted by Tesla's 4.9% drop after reporting a year-over-year decrease in 2024 vehicle deliveries and missing Wall Street forecasts. Consumer staples lost 1.4%, as the U.S. Surgeon General's advisory highlighted links between alcohol consumption and cancer risks, calling for warning labels. Shares of Brown-Forman and Molson Coors Beverage fell 6.6% and 4.4%, respectively.
Energy led gainers with a 3.2% increase. Devon Energy rose 8.8% after Wolfe Research upgraded its rating to "outperform." Utilities gained 1.3%, with Vistra shares surging 16% as UBS raised its price target to $174.
This week, key economic reports include December employment data, November factory orders, and preliminary January consumer sentiment, offering critical insights into the economy's trajectory.
Technical Perspective
The last candle ended as a green hammer on the weekly chart, and a lower wick may keep buyers in play for the upcoming weeks.
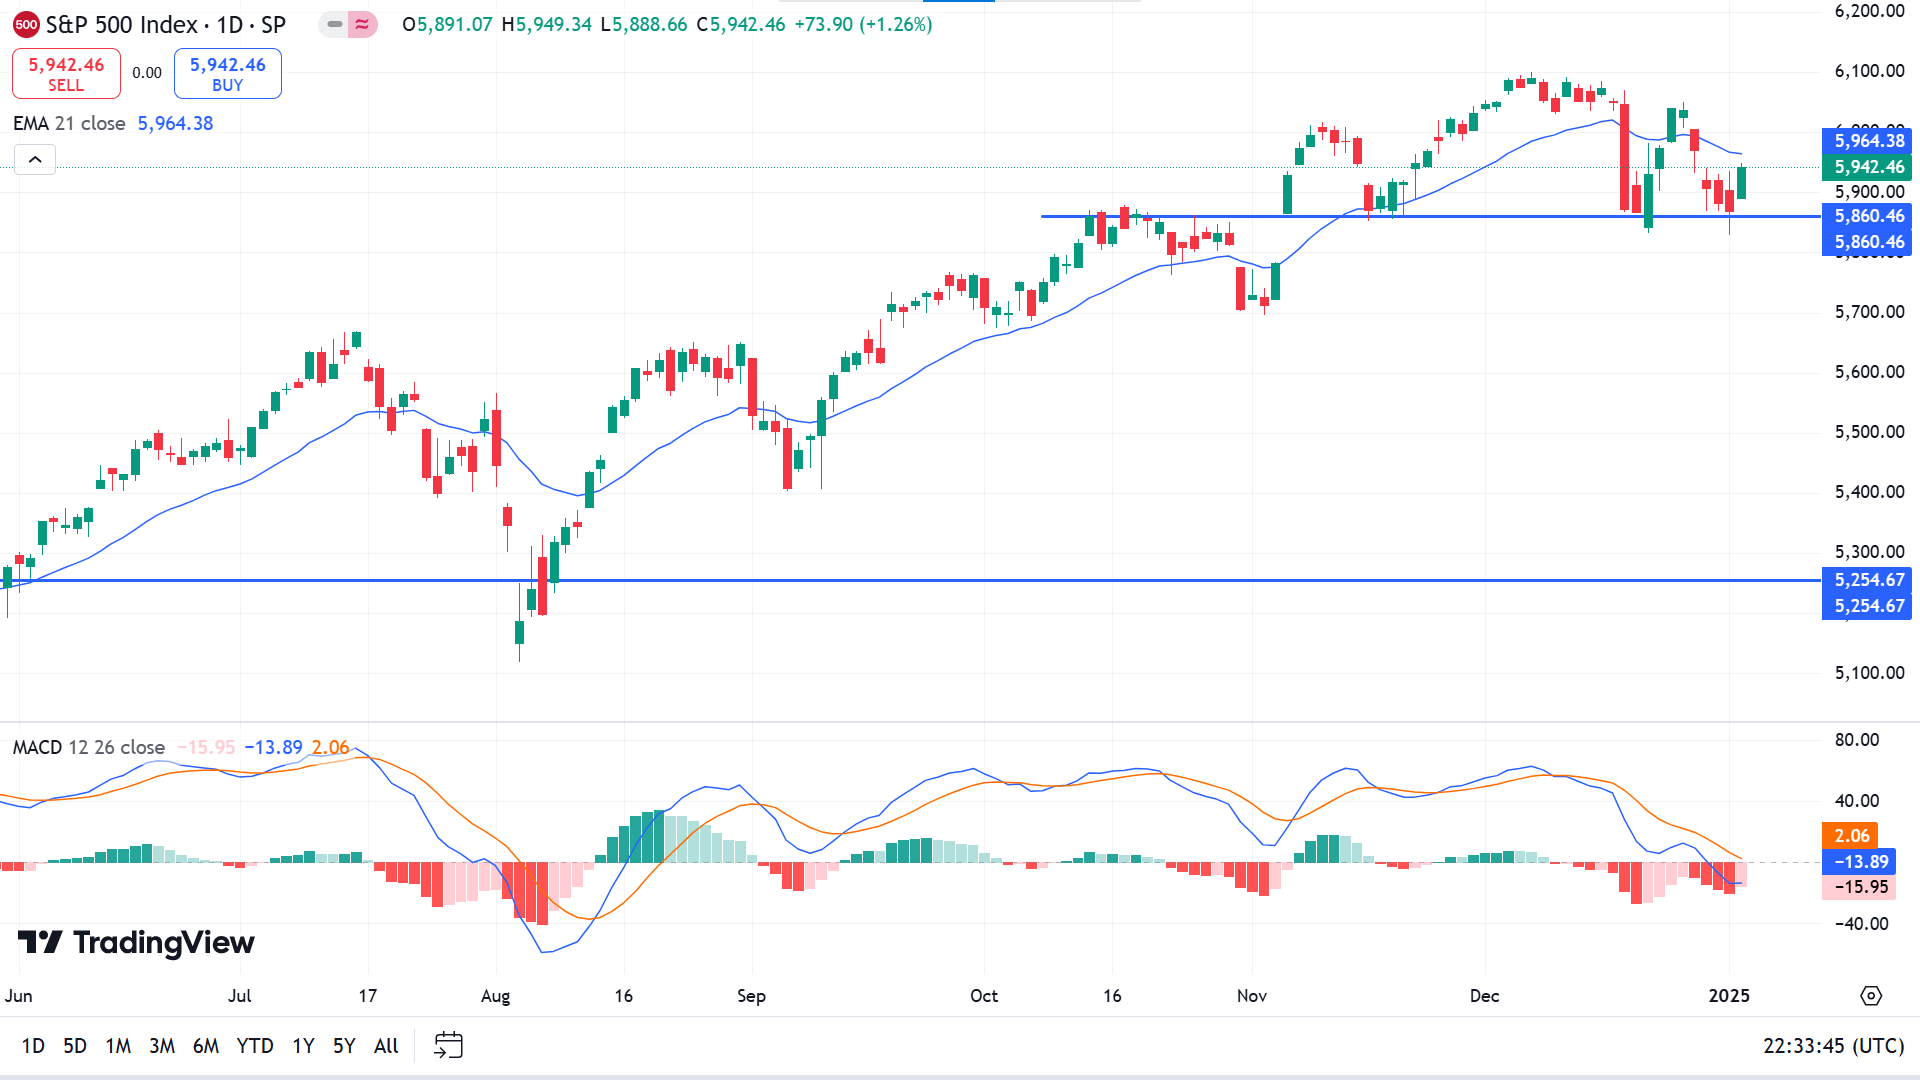
Due to the recent bearish pressure, the price reaches below the EMA 21 line on the daily chart but still holds the previous support of 5,860.46. MACD indicator reading suggests a sell signal through dynamic lines and red histogram bars below the midline of the indicator window. The price may be consolidating above the key support, but the trend remains bullish.
According to this price action, traders might observe 5860.46 as the key level, which can drive the price to the peak of 6,099.97 or beyond.
On the other hand, if the support of 5860.46 fails to hold, it might invalidate the bullish signal and might enable short-term selling opportunities toward the primary support near 5,638.23.
Gold (XAUUSD)
Fundamental Perspective
Gold prices (XAUUSD) surged with over 27% annual gains—its best performance since 2010. The sustained rally stems from strong safe-haven demand fueled by ongoing geopolitical instability, including tensions in the Middle East and the extended Russia-Ukraine conflict.
Reports from Axios suggest U.S. President Joe Biden discussed contingency plans to target Iran's nuclear facilities if significant advancements are made toward weaponization before Donald Trump's January 20 inauguration. These discussions highlight escalating concerns over Tehran's nuclear ambitions during the transitional period.
According to a Financial Times report, the People's Bank of China (PBoC) is expected to implement an interest rate cut at an opportune time this year. Market participants closely watch signs of economic recovery in China and their potential impact on gold demand. On Tuesday, President Xi Jinping reaffirmed his commitment to prioritizing economic growth, promising more proactive policies to stimulate the economy in 2025.
China's National Development and Reform Commission (NDRC) expressed optimism about sustained economic recovery in 2025, emphasizing plans to boost funding through ultra-long treasury bonds to support growth initiatives, with expectations for steady consumption throughout the year.
Technical Perspective
For the fifth week, the precious metal has been moving in a narrow range. A green candle after Doji on the weekly chart reflects buying interest in the asset, although the price has been sideways.
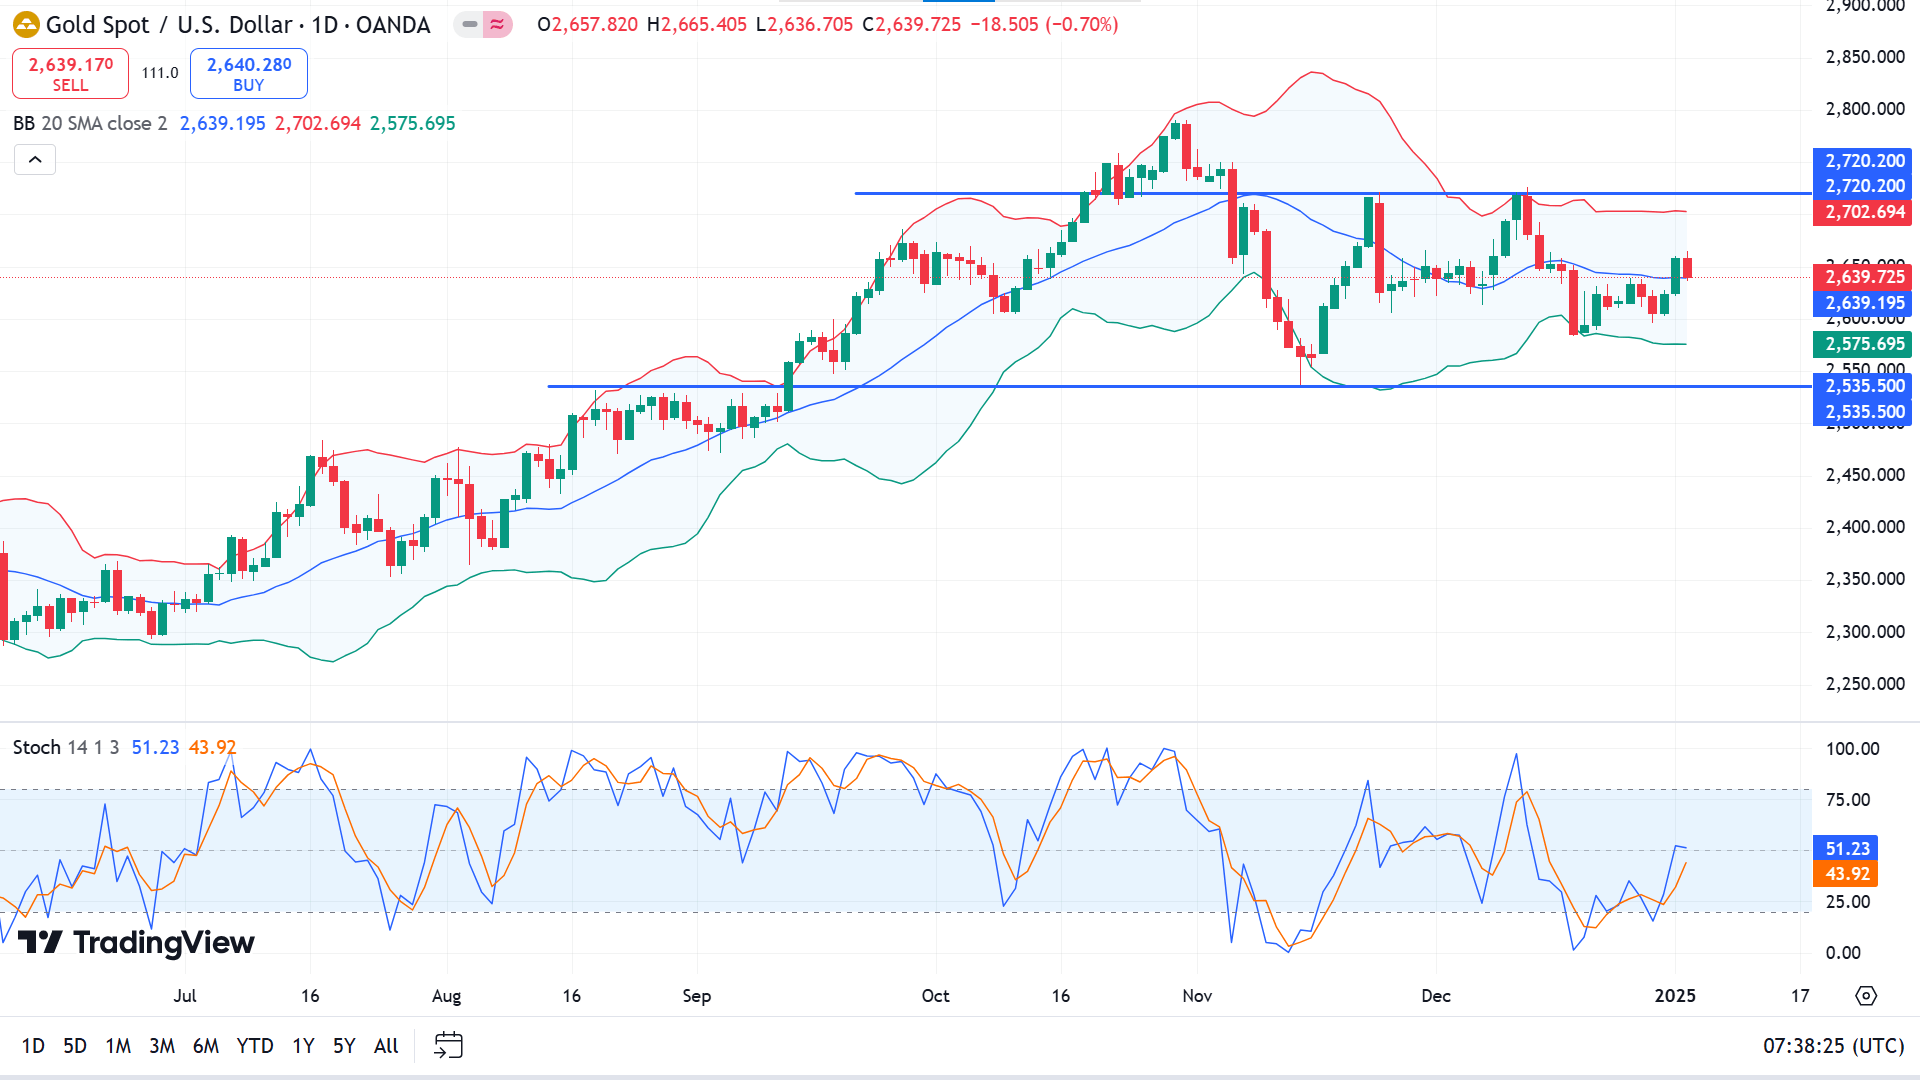
The price is moving sideways on the daily chart, closer to the middle band of the Bollinger bands indicator. The stochastic indicator reading remains neutral, with the dynamic signal line creating a bullish crossover edging upside, indicating recent bulls' domination.
The broader market context suggests that buyers may be seeking to open long positions near the primary support of 2584.23, which can turn the price toward the range top of 2,720.20.
Meanwhile, if the price declines below 2584.23, it would disappoint buyers and may attract short-term sellers toward the primary support near 2535.500.
Bitcoin (BTCUSD)
Fundamental Perspective
Bitcoin started the year with a modest recovery, trading above $96,000, following its record high of $108,353 on December 17, 2024. Historically, January has delivered an average return of 3.35% for Bitcoin, reflecting modest performance trends.
Institutional interest has continued to wane, with Coinglass reporting net outflows of $657.6 million from Bitcoin Spot ETFs by Thursday, adding to last week's $377.6 million outflows. Sustained or intensified outflows could exert additional downward pressure on Bitcoin prices.
Despite this, CryptoQuant's on-chain data suggests the broader bull market remains intact, viewing the current phase as a cooling-off period rather than a cycle peak. However, short-term price action remains uncertain, warranting caution from traders.
The Adjusted SOPR (Spent Output Profit Ratio), smoothed by a 7-day Simple Moving Average (SMA), is above one but trending downward, reflecting decreasing profits. Historically, SOPR levels below one often precede rebounds as selling at a loss triggers recoveries typical of bull markets.
The Miner Position Index (MPI), also analyzed with a 7-day SMA, shows miners are not engaging in significant Bitcoin sales, suggesting large mining firms continue to hold. However, periodic sell-offs for operational costs are likely to persist.
Technical Perspective
BTC posted a solid green candle on the weekly chart after two losing weeks, holding the support and leaving buyers optimistic.
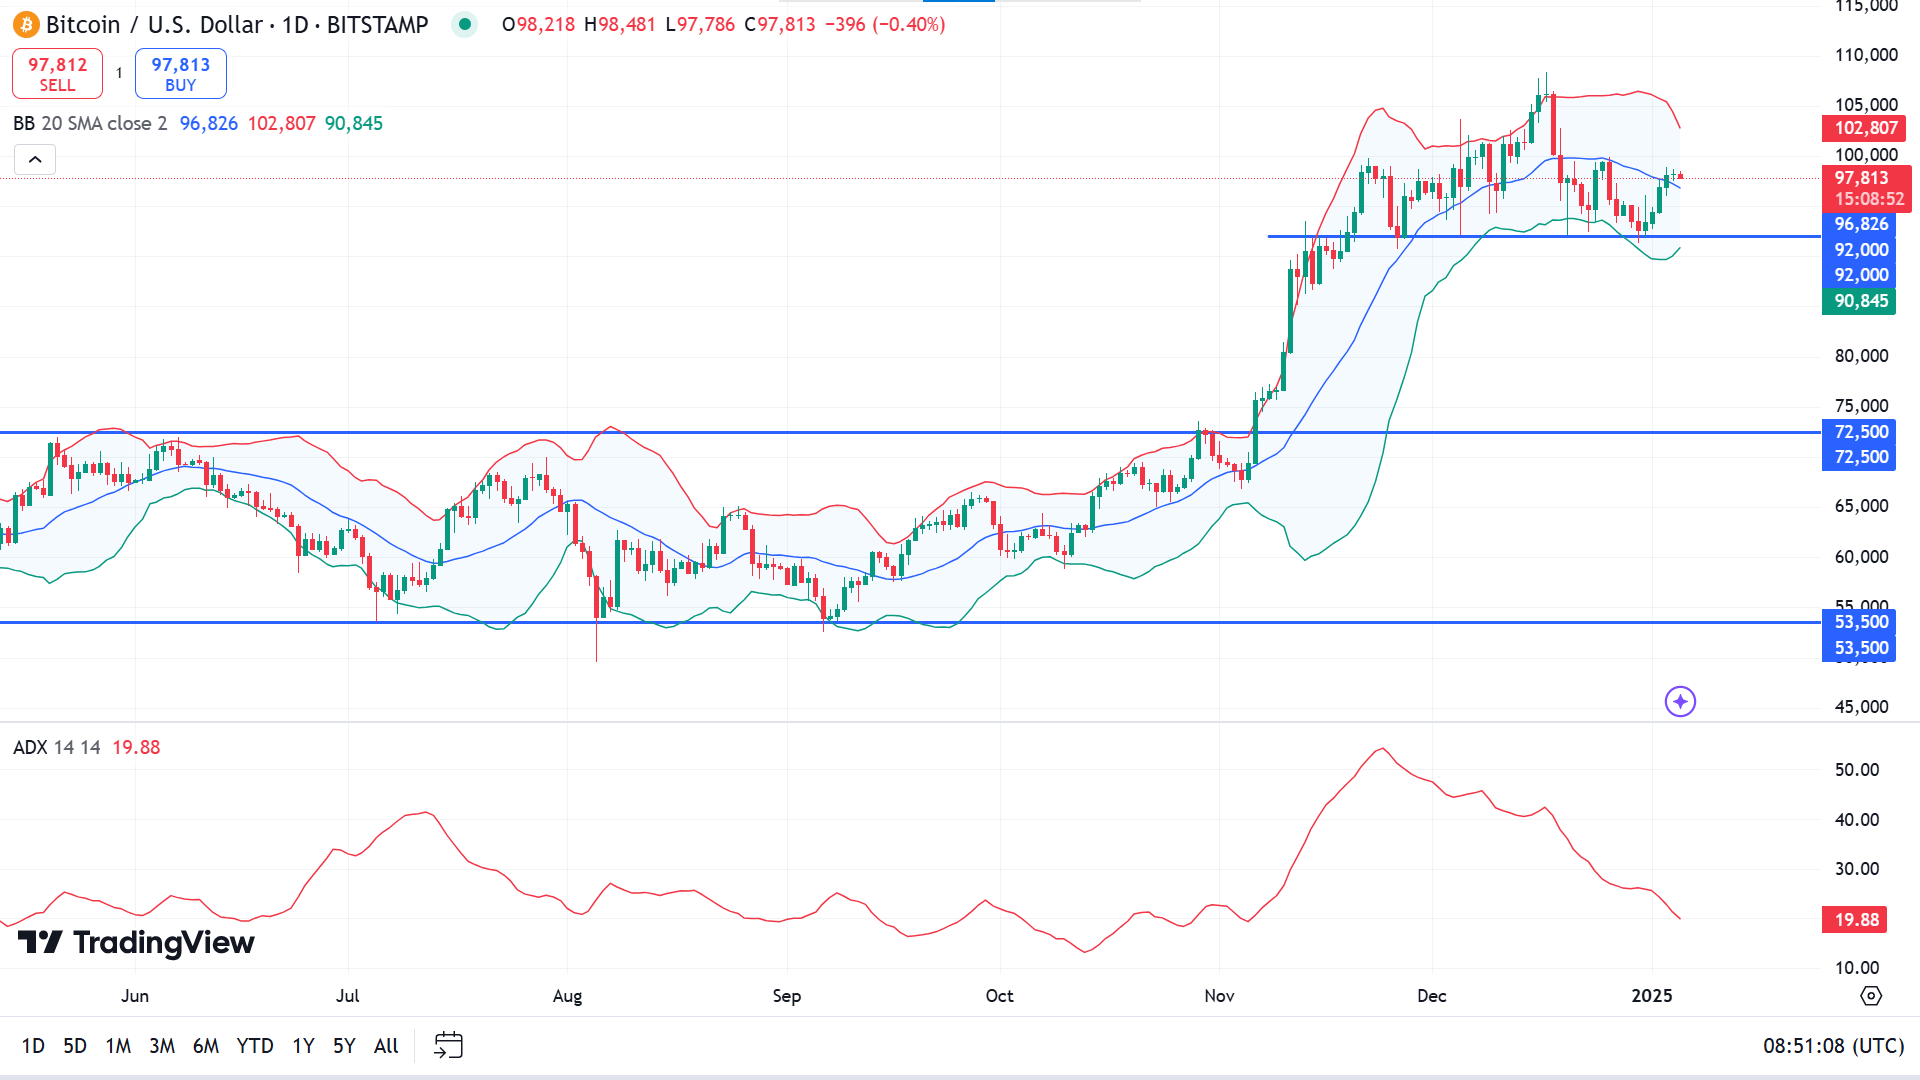
The price recovered from the recent decline in the daily chart, reaching above the middle band of the Bollinger band indicator and holding support at 92,000.00. The ADX reading remains neutral, with the dynamic line sloping downward, signaling that the current bullish trend may be losing power.
Combining the market context, traders might open elegant long positions near the short-term support level of 92,000. This support level can drive the price toward the primary resistance level of 102,902.
On the negative side, it might disappoint buyers if the 92,000 support fails to hold. Breaking the support might enable short-term selling opportunities toward 86,180.
Ethereum (ETHUSD)
Fundamental Perspective
In the past week, blob fees on Ethereum burned over 500 ETH, surpassing Uniswap and ETH transfers to top the burn leaderboard. This signals a notable shift from Ethereum's 2024 trend.
The March Dencun upgrade introduced blob space to Ethereum blocks, significantly enhancing Layer 2 scalability and reducing transaction fees. However, the fee reduction initially tempered Ethereum's burn mechanism, designed to make ETH deflationary. Between April and December, this increased by over 400,000 ETH in circulation.
Introduced in the London hard fork of August 2021, Ethereum's burn mechanism permanently removes a portion of transaction fees, aiming to limit supply growth. Recently, heightened activity on Layer 2 networks has driven the average blob count per block beyond the target of 3.0, triggering price discovery. As a result, Layer 2s have faced higher transaction fees, significantly boosting ETH burns.
If network activity increases as the holidays end and blobs continue driving ETH burns, this could shift sentiment positively toward blobs and strengthen Ethereum's "ultrasound money" narrative, enhancing its investment appeal.
Meanwhile, Ethereum ETFs saw net outflows of $55.4 million on Monday, ending a four-day streak of inflows, according to Coinglass data.
Technical Perspective
The weekly chart shows the price has been recovering for two consecutive weeks after crashing from the yearly high, leaving buyers optimistic for the upcoming weeks as the overall trend remains bullish.
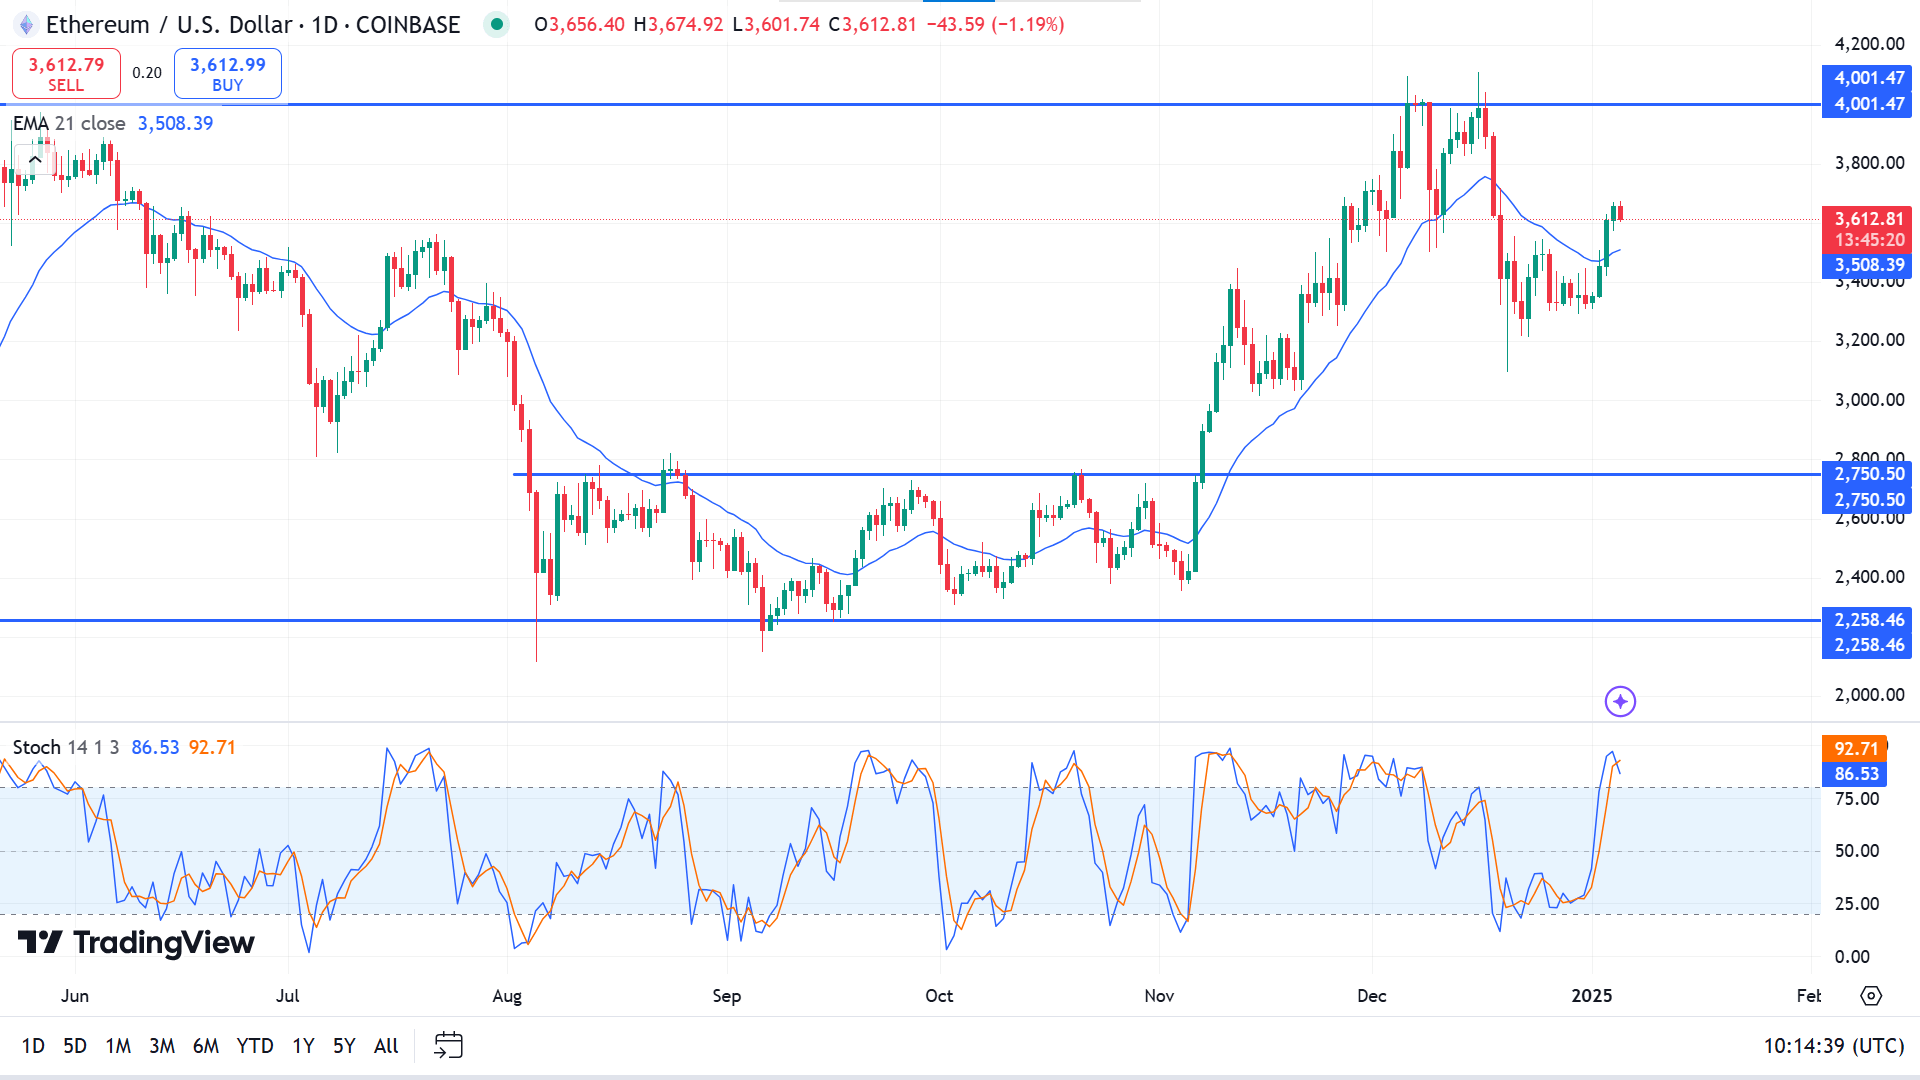
The price reaches above the EMA 21 line due to recent bullish pressure on the asset on the daily chart. The Stochastic reading remains neutral with the dynamic signal line reaching above the upper line of the indicator window, creating a fresh bearish crossover.
According to the indicator readings, if the price remains above the EMA 21 line or holds the temporary support of 3508.59, it can hit the resistance of 4001.47.
On the other hand, if the price declines below 3508.59, it might invalidate the current bullish signal. Again, it might trigger short-term selling opportunities toward the primary support near 2919.60.
Nvidia Stock (NVDA)
Fundamental Perspective
Nvidia's market value surged by an extraordinary $2 trillion in 2024, fueled by the relentless growth of artificial intelligence (AI). Analysts project even more significant potential for the stock in 2025, supported by a host of favourable catalysts. Nvidia's shares skyrocketed 178% last year, making it the third-best-performing stock in the S&P 500.
Despite its lofty valuation, Wall Street remains optimistic. Analysts have been revising price targets upward, anticipating continued expansion driven by the company's dominance in AI chip production. Wedbush Securities predicts the AI boom will persist, identifying Nvidia as its top pick among AI technology leaders for 2025.
Analysts anticipate a sharp increase in AI-related investments, projecting $2 trillion in capital expenditures for the sector over the next three years. This strong outlook underpins confidence in Nvidia's ability to maintain its leadership in the AI chip market, making it a focal point for the ongoing tech revolution.
Technical Perspective
The last solid green candle after doji from acceptable support indicates that buyers may return to the asset to hit resistance.
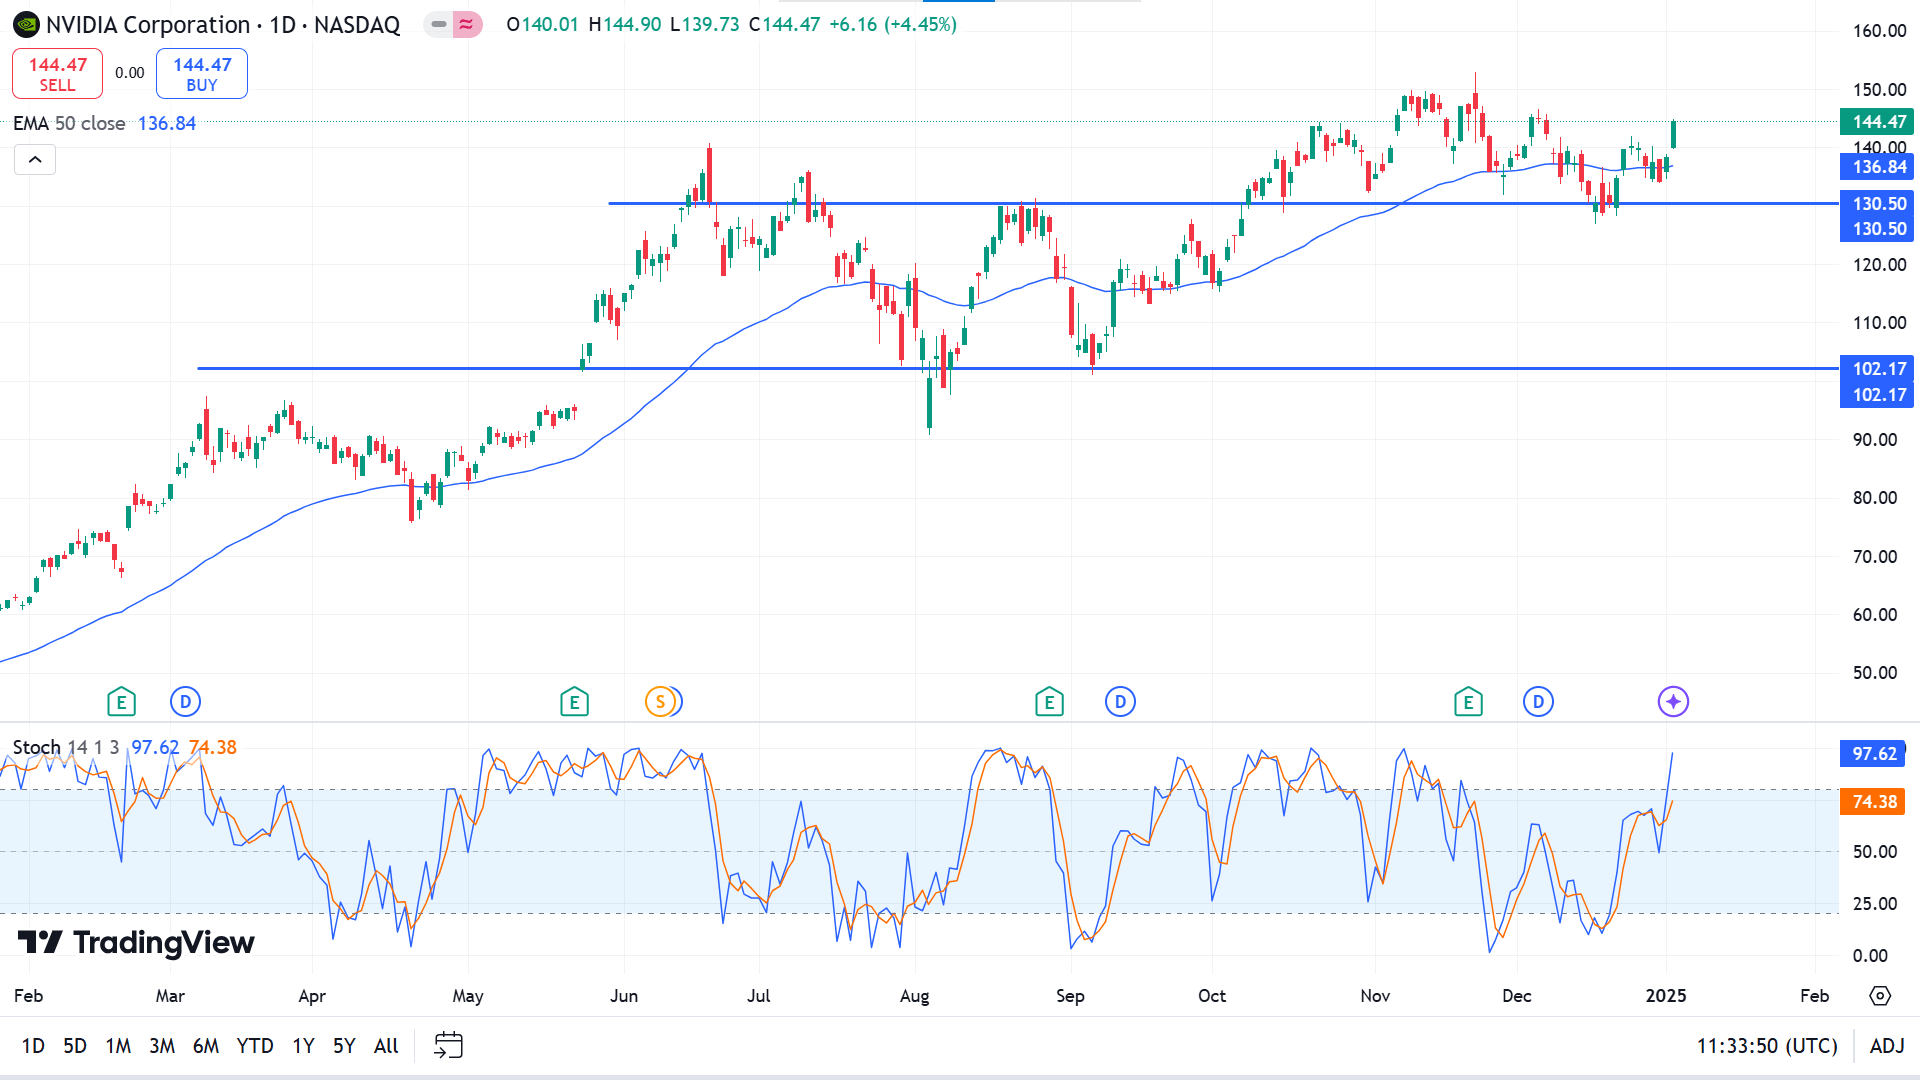
The daily chart shows the price is soaring above the EMA 50 line. Additionally, the Stochastic dynamic line floats above the upper line of the indicator window, supporting extreme bulls.
According to the broader market context, price action traders may wait near 130.50 to beat the ATH of 152.89. In the meantime, sellers may observe the price reaction at 130.50 as the price declines below the level, enabling short-term selling opportunities toward the primary support near 115.60.
Tesla Stock (TSLA)
Fundamental Perspective
Tesla shares surged 8% on Friday, recovering from a recent decline tied to underwhelming fourth-quarter delivery figures. To boost demand for its luxury Model S sedan, Tesla has reintroduced the highly sought-after "free Supercharging for life" perk for new purchases or leases.
This non-transferable benefit applies solely to individual owners or lessees, excluding used vehicles, corporate orders, and commercial uses such as ridesharing or deliveries. Users must access Tesla's Supercharger network to qualify, and the company reserves the right to revoke privileges for excessive use or unpaid fees.
Tesla initially ended this offering in 2018 to maintain financial sustainability but now brings it back with an unprecedented lifetime commitment for a single owner or renter. The move comes as Model S and Model X sales fell below 10,000 units last quarter, year-over-year.
By reinstating this popular benefit, Tesla aims to reignite interest in its flagship sedan and accelerate electric vehicle adoption. The substantial savings on charging for frequent travelers further reinforce Tesla's leadership in clean energy and its global commitment to reducing reliance on gasoline-powered vehicles.
Technical Perspective
The last weekly candle erases the loss but finishes with a red body and wicks on both sides, indicating a continuation as seller domination is visible.
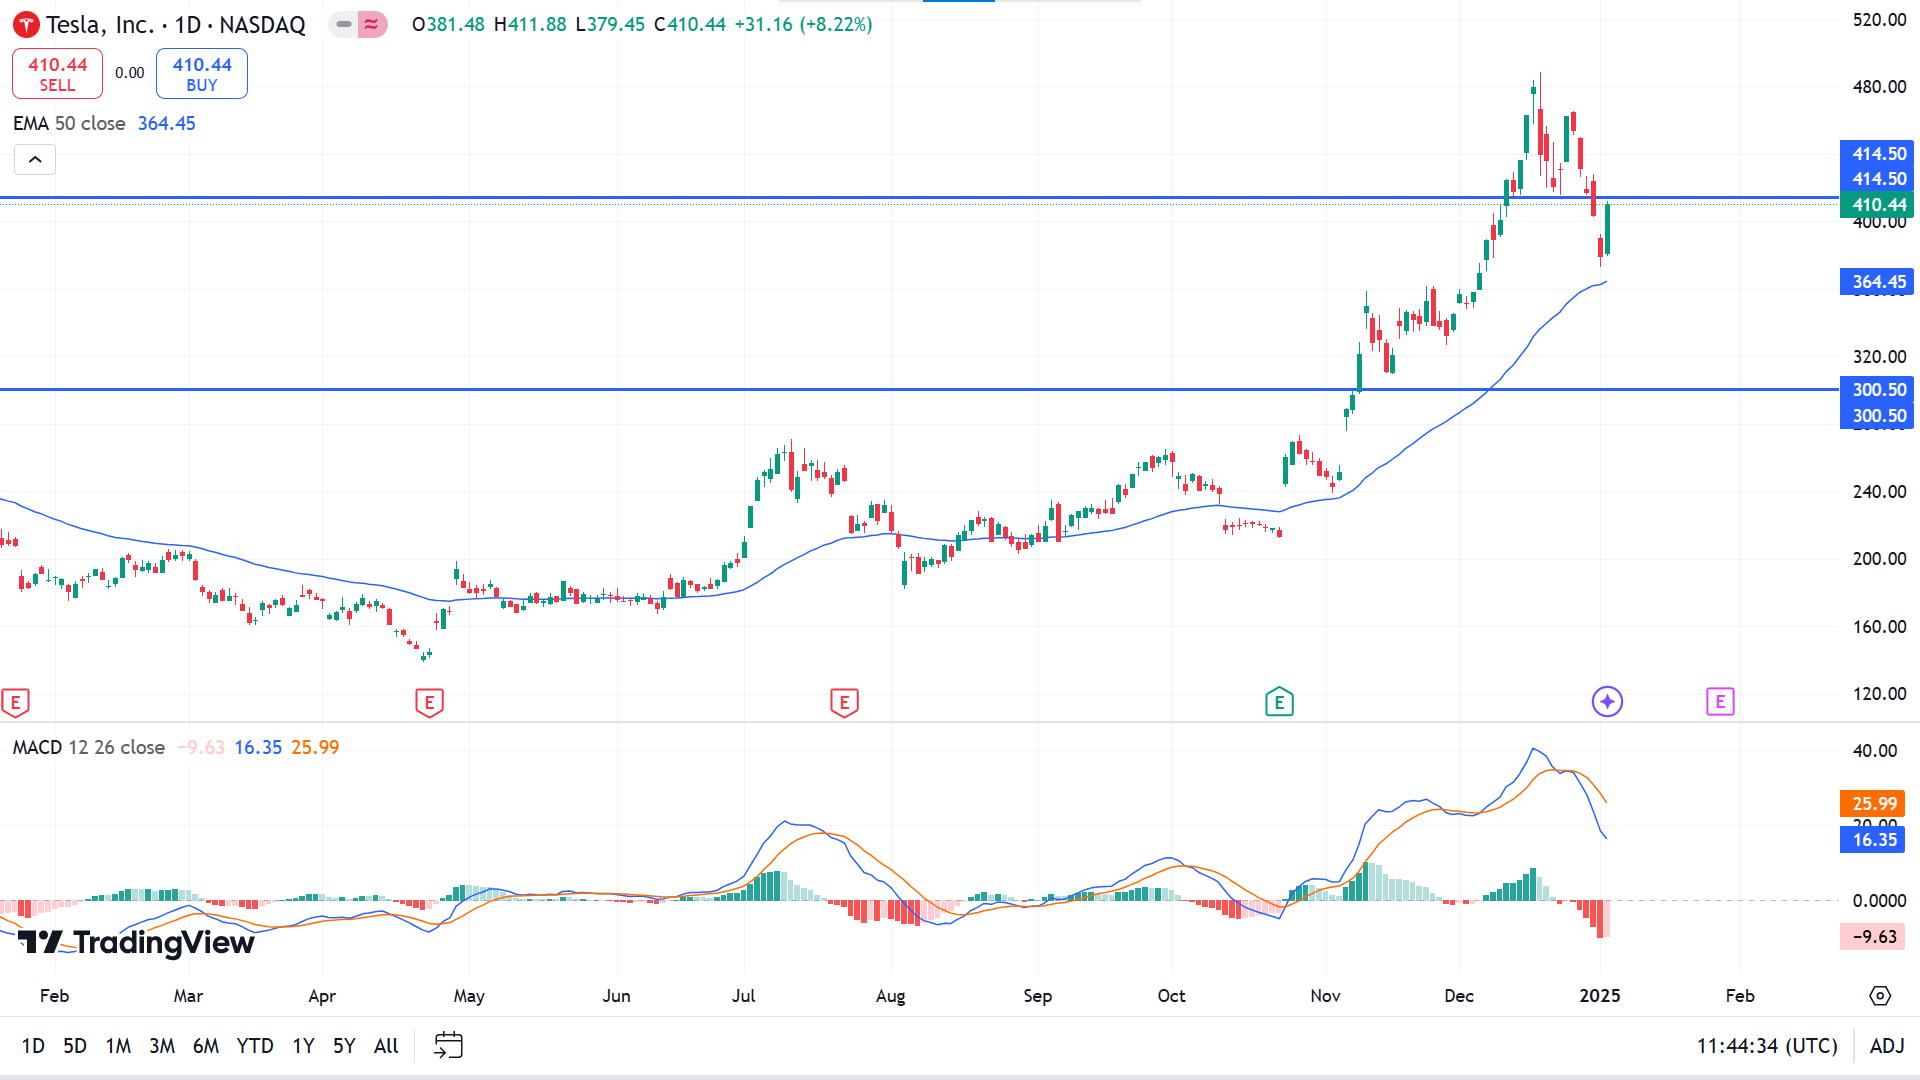
The price hovers above the EMA 50 line on the daily chart, confirming the trend remains bullish. The scenario is different at the MACD indicator window, as the dynamic signal line creates a fresh bearish crossover and red histogram bars below the midline of the indicator window, reflecting bearish pressure on the asset.
Based on price action concepts, sellers primarily observe the price reaction on the 414.50 level, which might drive the price further downside near 364.45 to accumulate.
Meanwhile, if a solid green candle closes above 414.50, it might disappoint sellers and trigger buyers to beat the ATH of 488.54.
WTI Crude Oil (USOUSD)
Fundamental Perspective
West Texas Intermediate (WTI) Oil extended its rally, reaching a 2.5-month high of $73.39 on Thursday. The gains are fueled by optimism that global governments will introduce supportive measures to spur economic growth, potentially boosting fuel demand.
Nonetheless, factory activity in Asia, Europe, and the US closed 2024 on a subdued note, as concerns over trade risks under incoming US President Donald Trump and China's fragile recovery weigh on sentiment.
China's National Development and Reform Commission (NDRC) expressed optimism about sustained economic recovery, highlighting plans for increased funding through ultra-long treasury bonds to support key programs. In a New Year's address, President Xi Jinping reaffirmed his commitment to prioritizing economic growth, signaling more proactive policies in 2025. Additionally, according to the Financial Times, the People's Bank of China is reportedly considering a rate cut at an appropriate time this year.
On the supply side, the Energy Information Administration (EIA) reported a sixth consecutive weekly decline in US crude inventories, with a 1.178 million-barrel drop for the week ending December 27, though below expectations for a 2.75 million-barrel decrease. Stocks at the Cushing delivery hub also fell slightly, declining by 0.142 million barrels.
Technical Perspective
The last solid green candle reflects extreme bullish pressure on the asset, leaving optimism for buyers as signalling demand surge.
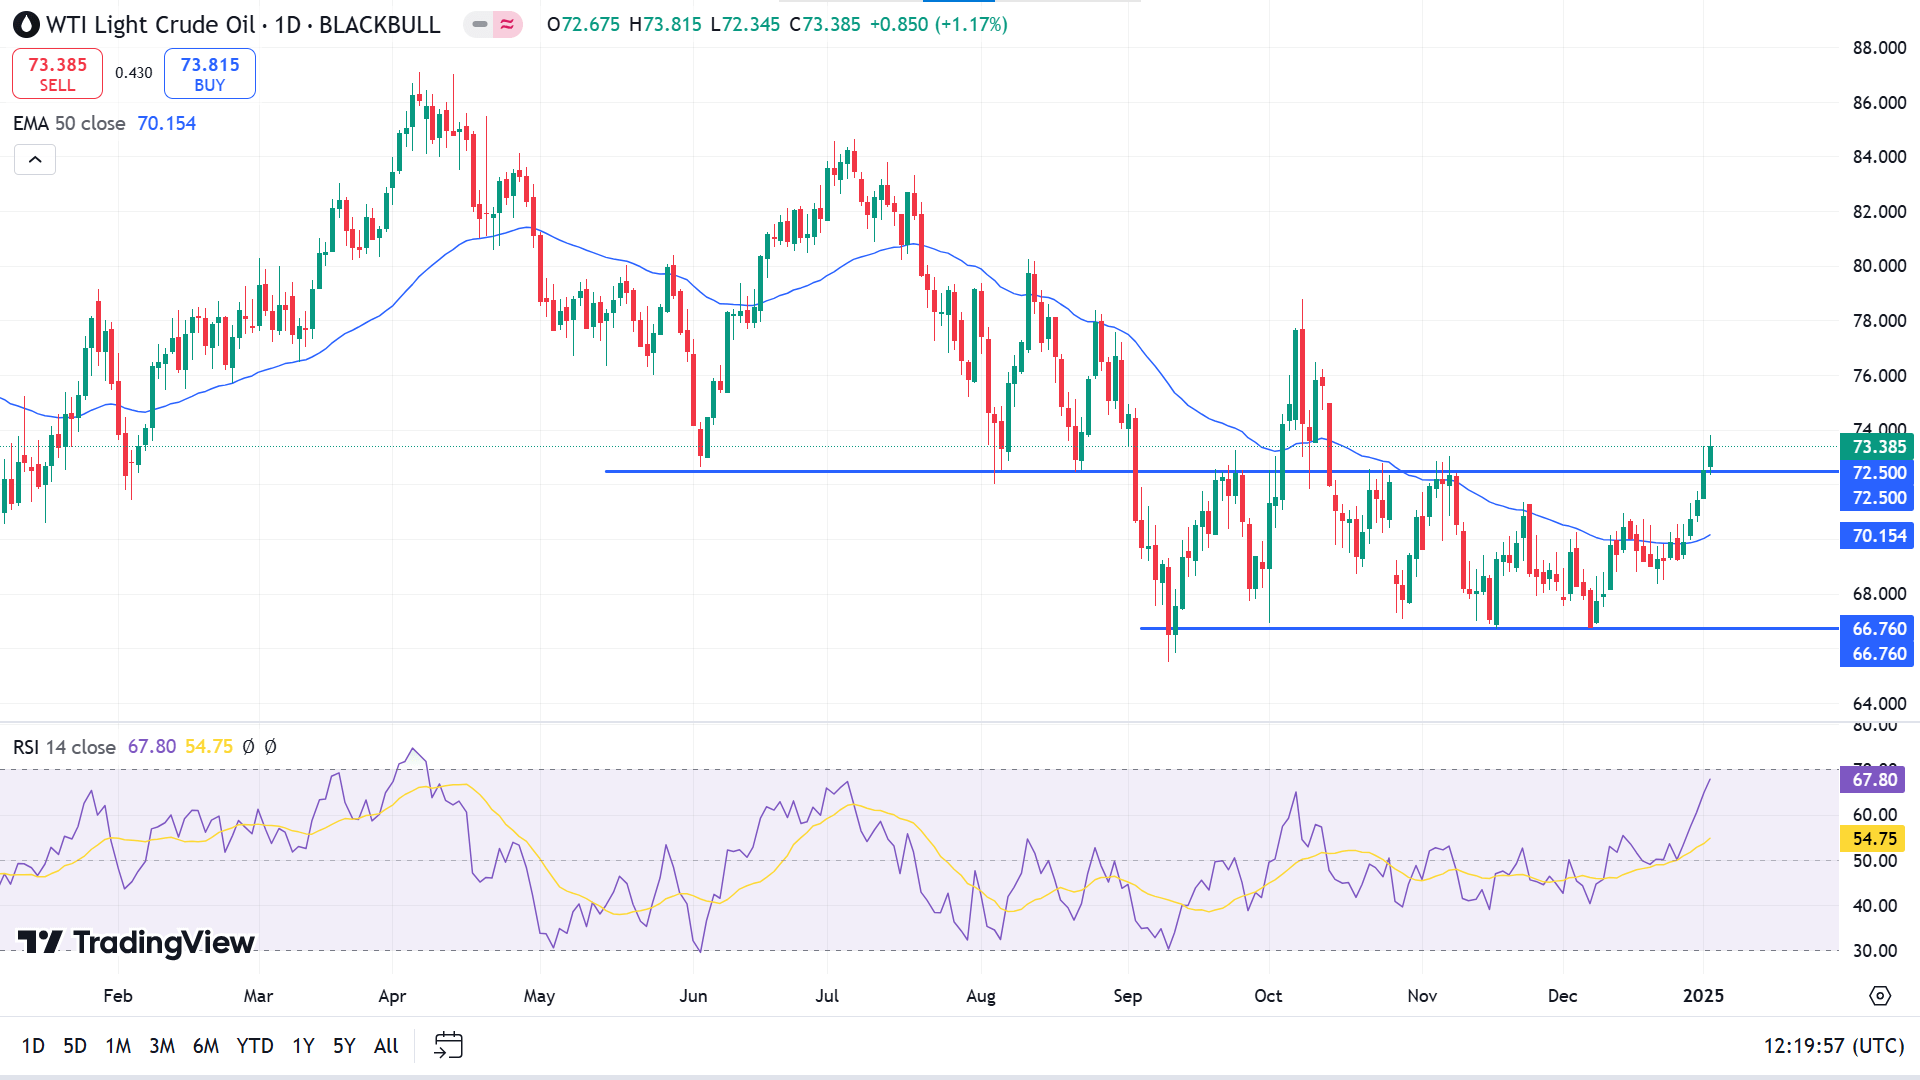
The price breaks above consolidation in the daily chart and hits above the range top of 72.50. The piece moves upward as it surges above the EMA 50 line, and the RSI dynamic line supports the bullish pressure through the dynamic line edging upside.
According to the current scenario, traders may be conscious of near 72.50 to open adequate long positions if the support holds. The price might hit the primary resistance near 77.80.
In the meantime, the bullish signal will be invalidated if the price declines below 72.50. This might enable selling opportunities toward the range low of 66.76.


