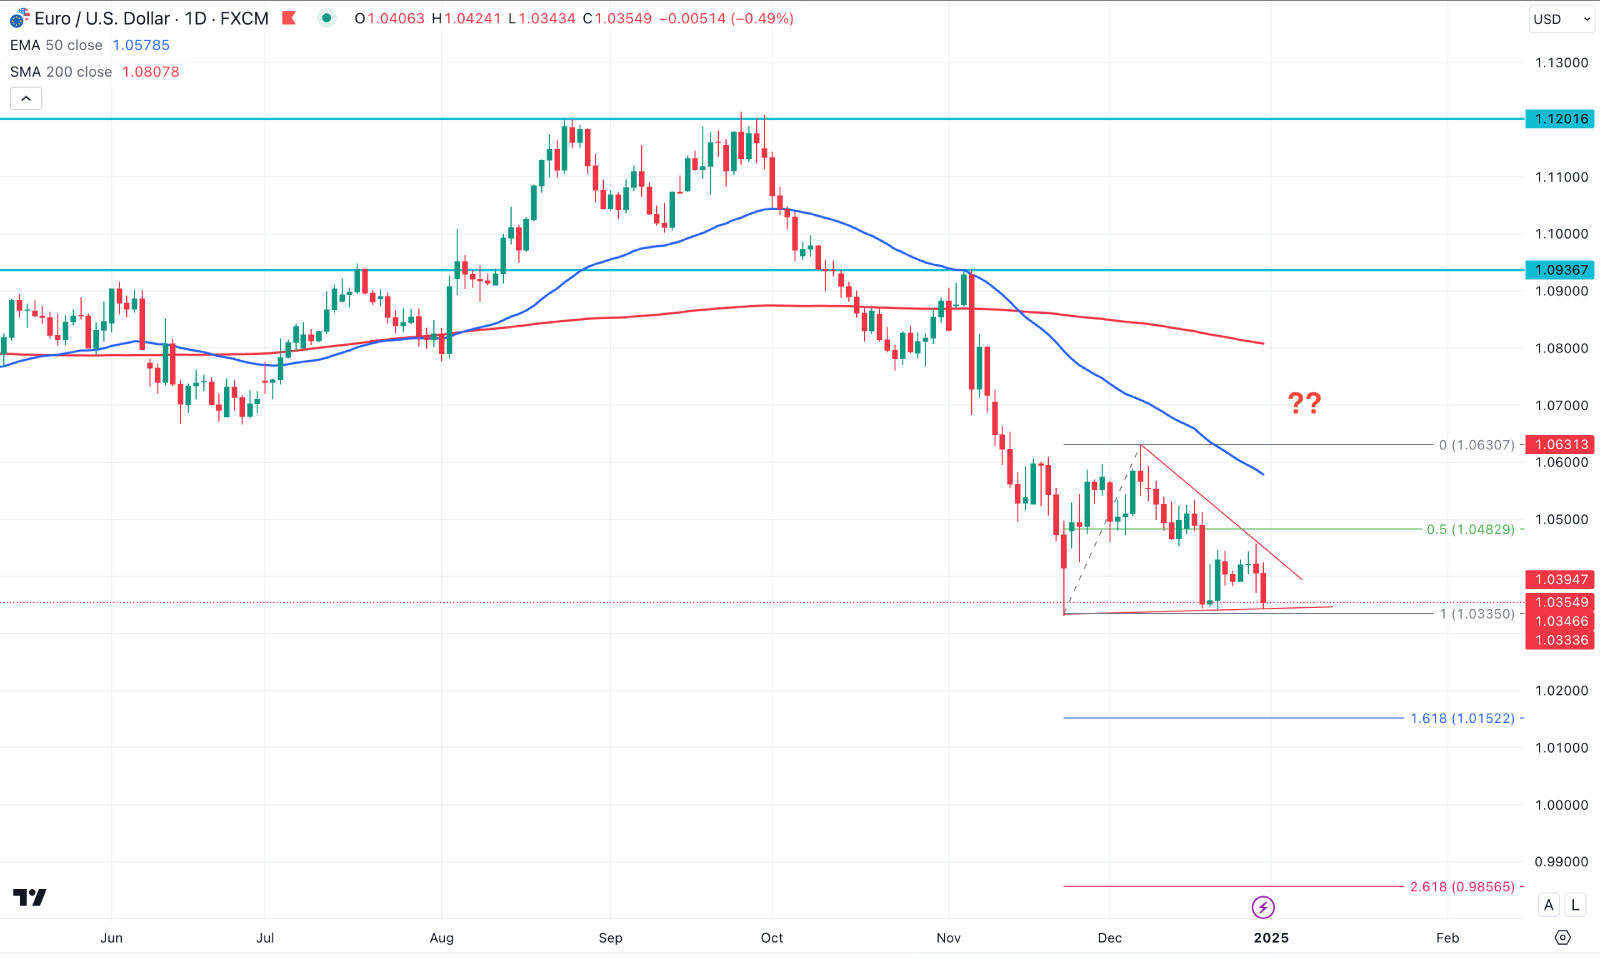
The first trading day of the new year saw the EURUSD lose ground after incurring an indecision the day before. However, a minor recovery of the EURUSD currency pair can be ascribed to a muted US dollar (USD) after Treasury yields declined.
How Could Fed's Decision Affect The EURUSD Price?
As US Treasury yields dropped by around 2% this week, the United States Dollar Index (DXY), which compares the US dollar (USD) to six other major currencies, is still slightly down at 108.00. The yields for the next two and ten years were 4.24% and 4.53%, correspondingly.
The Federal Reserve (Fed) may take a more cautious stance on prospective rate decreases in 2025, indicating a change in its monetary policy strategy. This change would provide difficulties for the risk-sensitive EURUSD pair, given uncertainty about the economic policies anticipated under the newly inaugurated Trump administration.
Furthermore, despite increased geopolitical uncertainties brought on by the protracted Russia-Ukraine conflict and continued instability in the Middle East, the safe-haven outflows placed stress on the Euro. According to Reuters, Israel's representative to the UN, Danny Danon, urged Yemen's Iran-backed Houthi terrorists to stop attacking Israel with missiles on Monday.
Dovish ECB Could Attract EURUSD Bears
Due to the European Central Bank's (ECB) dovish advice on the policy of interest rates for the new year, the euro's value and the EURUSD pair are under pressure to decline. By the close of June 2025, the ECB is anticipated to have lowered its Deposit Facility value to 2%, which regulators consider to be a neutral rate, after reducing it by one hundred basis points (bps) to 3 percent this year.
This implies that the ECB will lower its key borrowing costs by 25 basis points at each meeting in the first half of this year.
EURUSD Forecast Technical Analysis

In the daily chart of EURUSD, the ongoing selling pressure is visible, where the current price hovers at a record low. Moreover, the latest price shows a sideways momentum within a descending triangle, from where a bearish break is possible.
Looking at the major structure, a Death Cross is visible in the daily chart, as the 50-day EMA crosses below the 200-day SMA line.
Considering the bearish pressure, a break below the 1.0335 level would be a remarkable achievement for sellers. A downside pressure below this line might resume the bearish trend, towards the 1.0152 support level, before reaching the 0.9856 line.
On the other hand, a strong bullish recovery with a V-shape recovery is needed before anticipating a trend change. A daily close above the 1.0482 level could signal a minor bullish pressure, which can extend the price towards the 200 day SMA line.


