Although tech and growth companies had propelled markets higher for the majority of the abbreviated trading week, a widespread sell-off unexpectedly halted Wall Street's holiday euphoria, with each of the major benchmarks finishing lower.
The decrease halted the DJI's worst dropping run since 1974, which had been followed by a five-session profitable streak after a 10-session loss.
US30 Santa Claus Rally
The traditional Santa Claus rally, when equities typically increase in the final five trading sessions of December and the initial two of January, was prevented by the sell-off. As per the Stock Trader's Almanac, the S&P 500 has experienced an average increase of 1.3% since 1969.
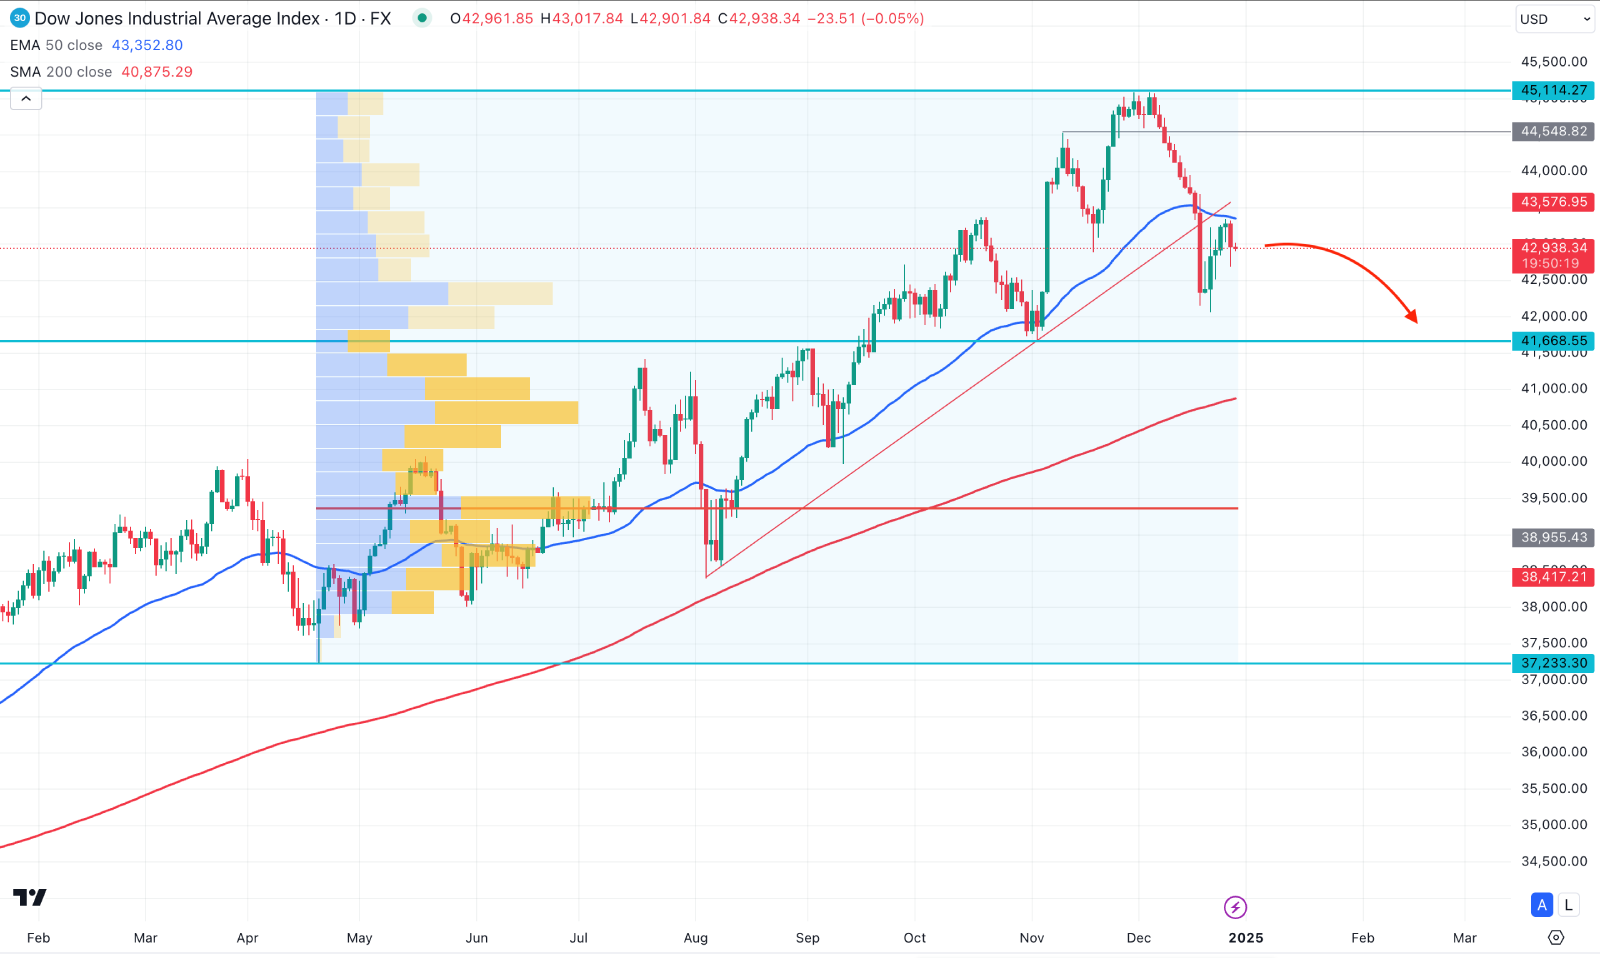
The S&P 500 and Nasdaq both posted slight losses to finish multi-session gains. Compared to these, the US30 maintained the loss, being 6.74% down from the December 2024 peak. However, a bottom is seen at the 20 December low, from where a rally might appear.
US30 Direction Awaits US Treasury Rates
Investors' focus had been drawn to increasing U.S. Treasury rates; in the session before, the leading 10-year note, US10Y, reached a high of more than seven months. On Friday, the yield was around that level, at 4.62%.
Higher yields are thought to hamper growth stocks since they increase the cost of borrowing for company expansion. These equities were also affected by Friday's sell-off, particularly the so-known Magnificent Seven tech mega-caps, which had been major forces behind the market's rise in 2024.
This week, with fewer holidays, trading volumes have been lower than they have been during the past six months, and they are probably going to stay low until January 6. The December jobs data, which is coming on January 10, will be the markets' next main focus.
Dow Jones (US30) Technical Analysis

In the daily chart of US30, the recent price shows a primary sign of selling pressure as a bearish trendline break is visible from the record-high price.
Following the market sentiment, the price aimed lower and formed multiple daily candles below the 50-day Exponential Moving Average. After proper validation, investors might find bearish pressure on this instrument.
Overall, more clues are needed before anticipating a trend reversal. Primarily, selling pressure is expected as long as the 50-day EMA remains above the current price. In that case, the downside pressure might extend toward the 200-day SMA line.
On the bullish side, an immediate bullish reversal with a daily close above the 43,676.83 level could signal a trend continuation, targeting the 45,114.27 line.


