EURUSD
Fundamental Perspective
The EURUSD pair edged higher in thin trading after the Christmas and Boxing Day holidays. This upward move was supported by a softer US Dollar (USD), even as the Federal Reserve (Fed) is expected to ease monetary policy gradually. Inflation has slightly recovered over the past three months.
The US Dollar Index (DXY), which tracks the USD against a basket of six major currencies, faced difficulty holding the crucial 108.00 support level. The USD had shown strength in recent months, bolstered by expectations of robust economic growth under the incoming US administration and speculation of a more measured pace in the Fed's rate cuts.
The Fed's latest dot plot suggests that policymakers anticipate the federal funds rate to reach 3.9% by the end of 2025, implying two rate cuts next year, down from the previously expected four. However, BCA Research analysts predict the Fed will lower rates by over 50 basis points in 2024, citing inflation expectations falling short of the 2% target and unemployment surpassing the Fed's 4.3% forecast.
Meanwhile, US Initial Jobless Claims data for the week ending December 20 showed a surprising decline to 219K, slightly below the prior figure of 220K and well under the expected 224K, signaling resilience in the labor market.
Technical Perspective
The last weekly candle closed as a small red candle, posting three consecutive losing candles, suggesting a pause in the current downtrend. Sellers are still optimistic but keep a keen eye on the sell barrier level before opening buy positions, as the weekly pattern suggests a trend-changing environment.
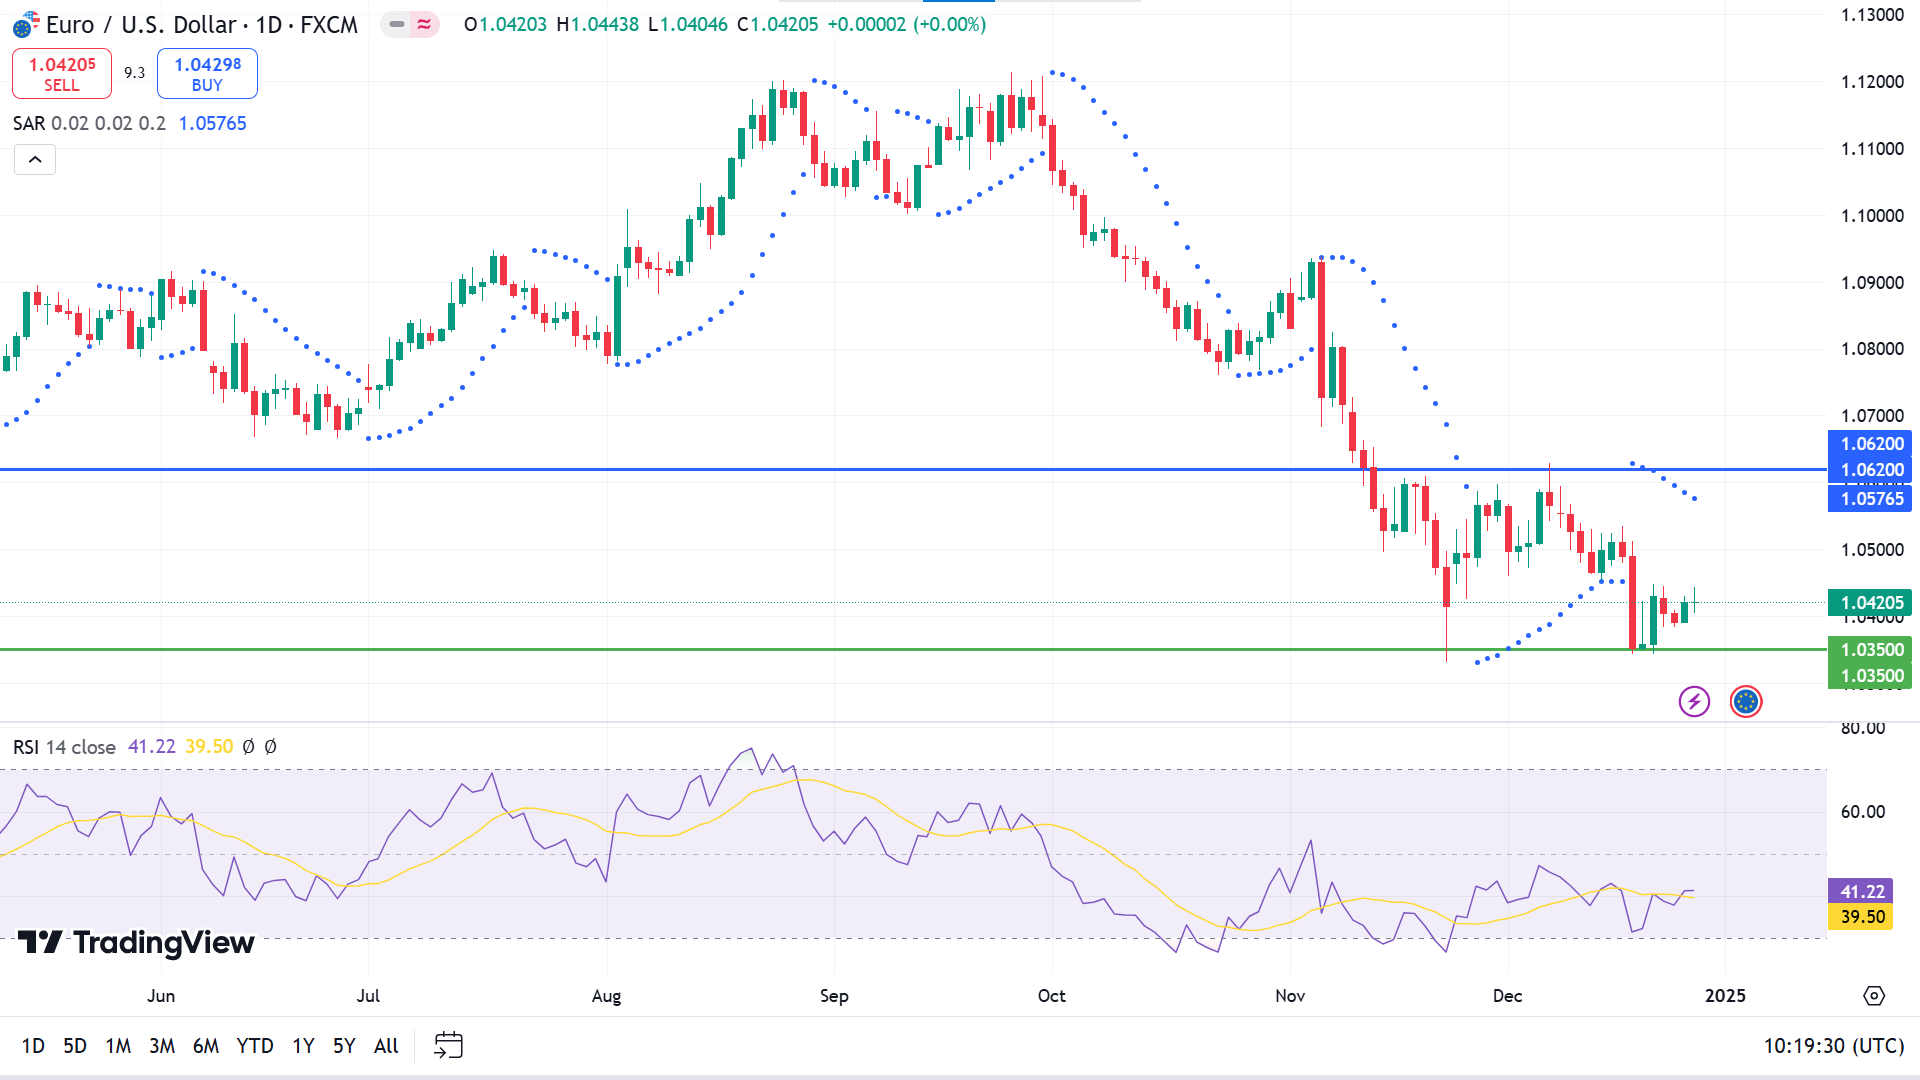
The price has remained downtrend since October and has been consolidating since November, above an acceptable support level of nearly 1.0350. The parabolic SAR continues creating dots above the price candles, declaring the recent bearish pressure, and the RSI indicator reading remains neutral. The RSI dynamic signal line floats below the midline, edging upside.
According to the current scenario, expert buyers may seek to open long positions near the adequate support of 1.0350, which can turn the price to a top range of 1.0620. A valid breakout can drive the price toward the next resistance near 1.0926.
On the other hand, the bullish signal might be invalidated if a daily red candle closes below 1.0350, which can drive the price toward the next support near 1.0138.
GBPJPY
Fundamental Perspective
The Pound Sterling (GBP) gained against major currencies as investors focused on the Bank of England's (BoE) potential approach to interest rate cuts in 2025. The mid-December policy meeting revealed a surprising dovish shift, with the Monetary Policy Committee (MPC) voting 6-3 to keep rates steady, contrasting with the expected 8-1 split.
This larger-than-anticipated support for rate cuts has heightened market expectations for 2025, with traders now pricing in a 53-basis point (bps) reduction, up from 46 bps after the December 19 announcement. Projections suggest at least two 25 bps cuts during the year. Despite this, Governor Andrew Bailey has not committed to a specific easing path, citing significant economic uncertainties in the UK.
Tokyo's headline CPI inflation in Japan rose to 3.0% year-over-year (YoY) in December, up from 2.6% in November. Excluding Fresh Food and Energy, CPI climbed to 2.4% YoY, slightly below the forecasted 2.5%. Meanwhile, the Bank of Japan's (BoJ) policy summary emphasized potential adjustments to easing measures if economic conditions evolve as expected, highlighting the importance of wage momentum and data analysis in shaping future policy decisions.
Technical Perspective
The weekly chart shows bulls might be back on the asset as it posted four consecutive green candles, leaving buyers optimistic.
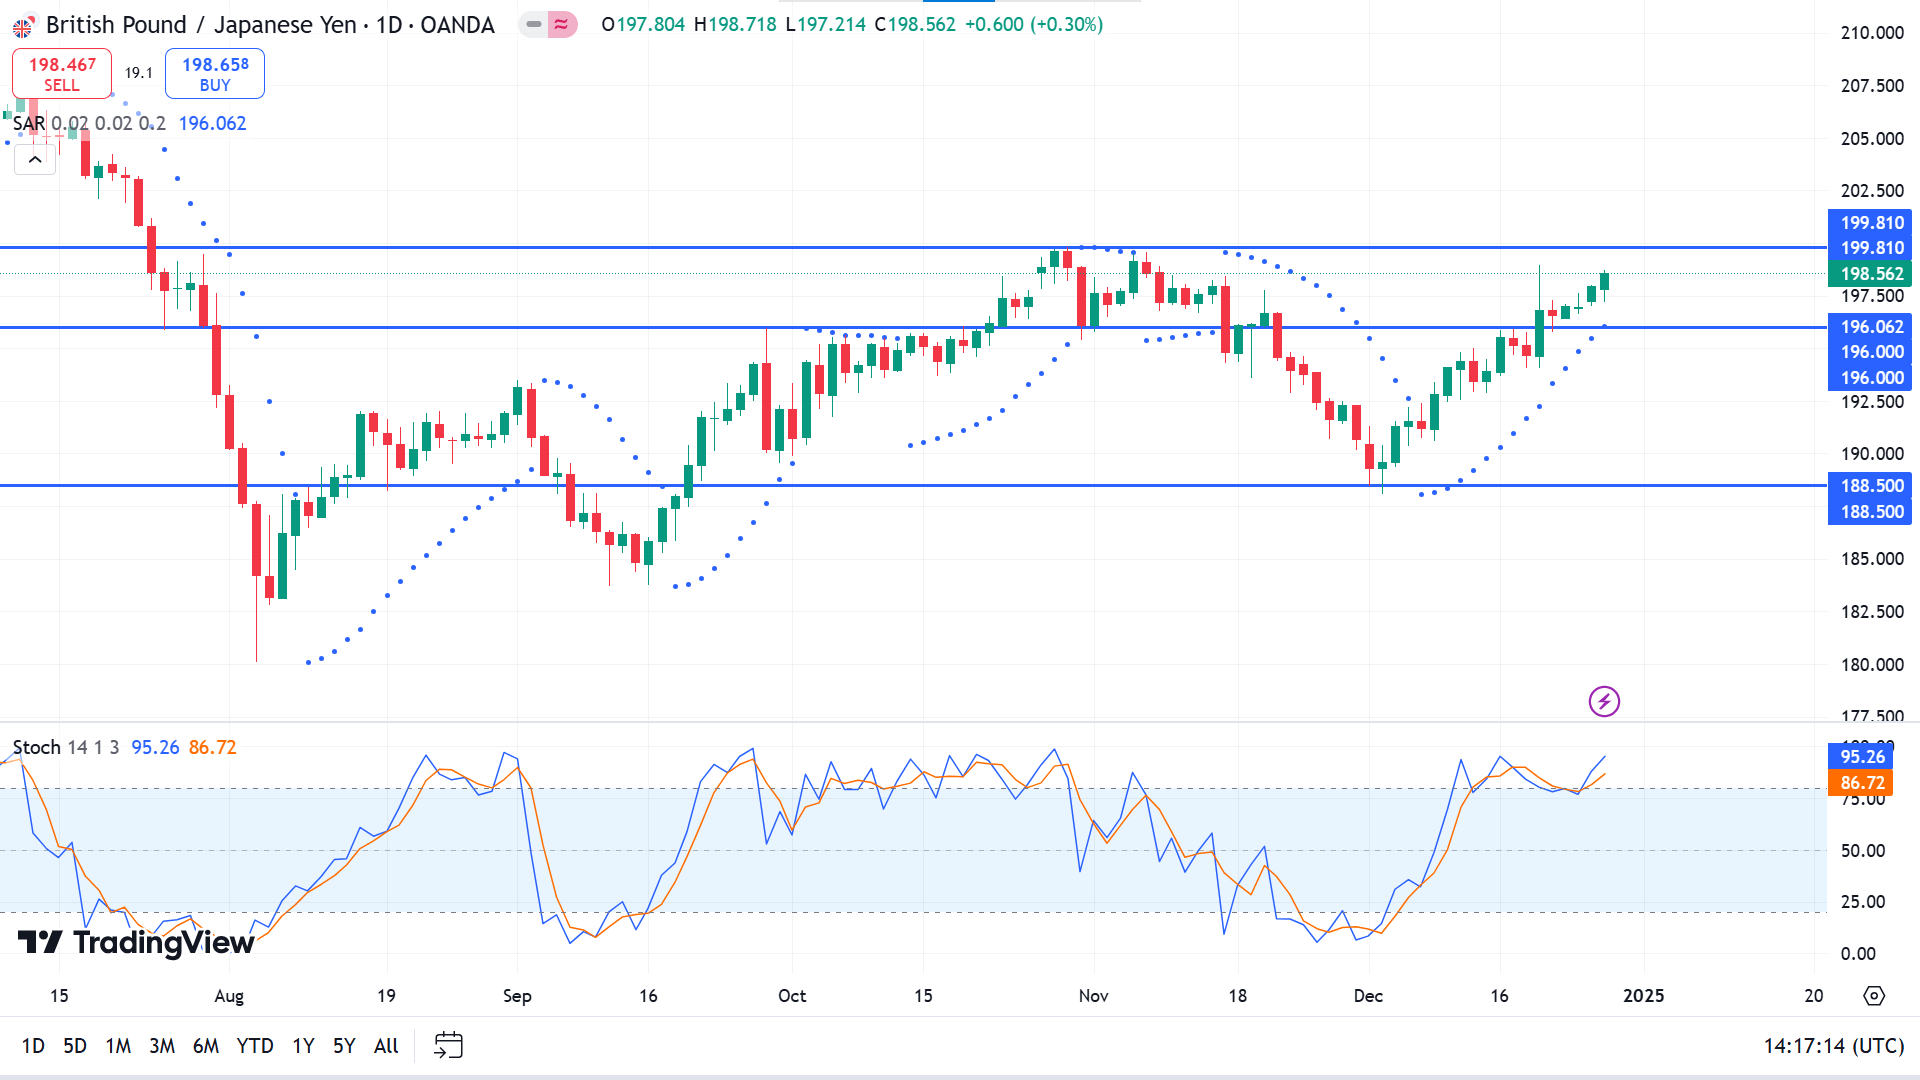
The parabolic SAR indicator shows a solid bullish trend on the daily chart by creating dots below the price candles. The stochastic indicator window also supports the bullish trend through dynamic lines floating above the upper line of the indicator window.
Based on the market context, sellers may be primarily watching the primary resistance near 199.81. This level can be a barrier for buyers, as the price could move toward adequate support near 196.00.
Meanwhile, buyers may seek a valid breakout of the primary resistance of 199.81, which can trigger the price toward the following resistance near 208.12.
NASDAQ 100 (NAS100)
Fundamental Perspective
U.S. stocks ended Christmas week on Friday with a pullback, retreating from recent substantial gains as light holiday trading triggered profit-taking. The U.S. dollar also softened slightly but remained on track for a nearly 7% annual increase. Optimism about U.S. economic growth and expectations of tax cuts, deregulation, and tariffs under President-elect Donald Trump's administration have fueled the dollar's strength. These factors will also likely keep the Federal Reserve cautious about aggressive rate cuts through 2025.
Selling pressure on Wall Street's major indexes built steadily through the day, disrupting what had initially looked like a classic year-end rally following an impressive market performance throughout the year. Investors appeared to lock in profits before the final holiday-shortened week of 2024.
Jeff Schulze, Head of Economic and Market Strategy at Clearbridge Investments, remarked, “The Santa Claus rally arrived earlier this year. This is likely profit-taking ahead of another holiday-shortened week, and light trading volumes can create temporary air pockets.”
Tech giants, including Tesla (-4.9%), Amazon, Microsoft, and Nvidia, led Friday's declines, weighing on the broader market and tempering year-end enthusiasm.
Technical Perspective
The weekly chart shows the price is on an uptrend but facing bearish pressure as the last candle closed as a green hammer with an upper wick after an ideal red candle. These may spark short-term selling opportunities, whereas the overall trend remains bullish.
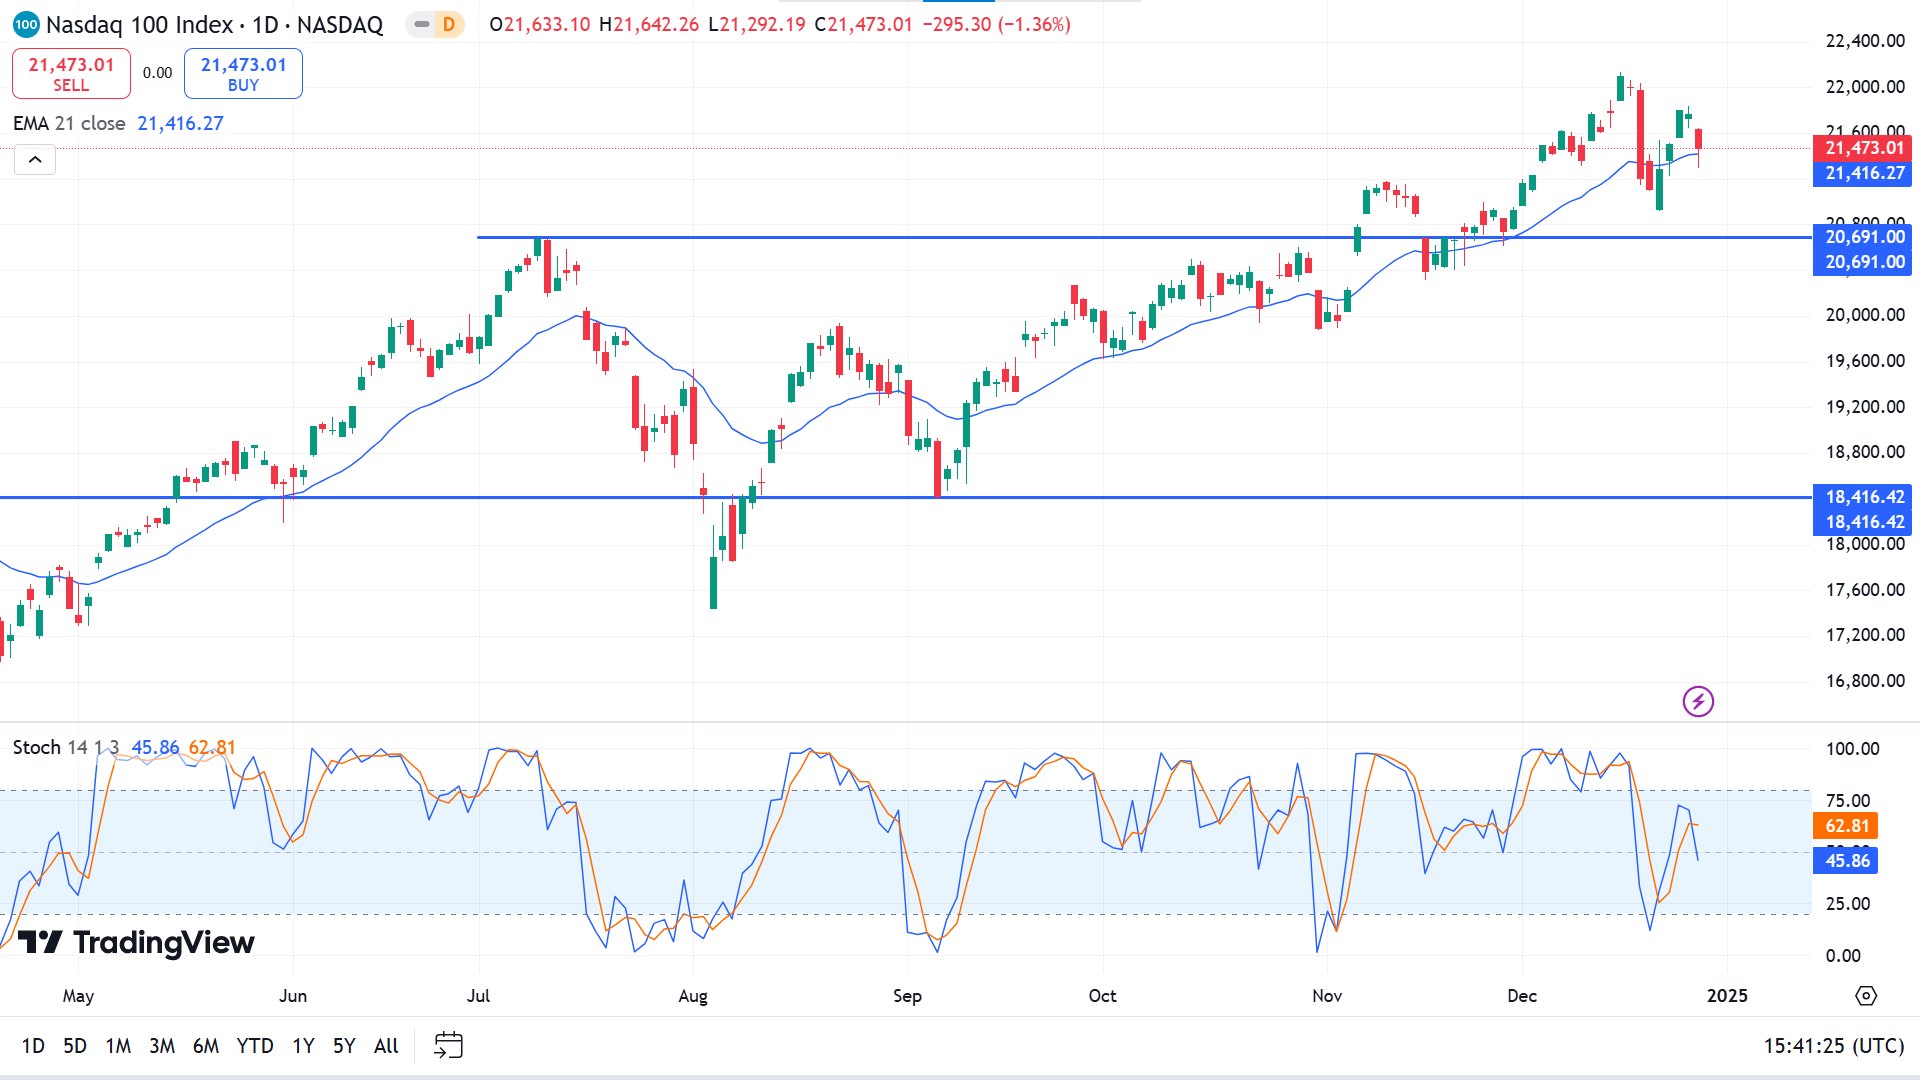
The price declined at the EMA 21 line in the daily chart, but the previous support of 20,691.00 remains intact, and the price has failed to reach its peak. The scenario is different at the Stochastic indicator window, as the dynamic signal lines create a bearish crossover signaling seller domination, but the reading remains neutral.
According to the price action concepts, buyers may seek to open adequate long positions near the support of 20691.00, which can trigger the price toward the ATH near 22,133.22 or beyond.
Meanwhile, if the support of 20691.00 fails to sustain and the price declines below that level, it might disappoint buyers. It might spark short-term selling opportunities toward primary support near 19,902.28, following the next support near 18416.42.
S&P 500 (SPX500)
Fundamental Perspective
Wall Street's main indexes remained sideways, capping an intense holiday-shortened week bolstered by optimism over a typically favorable market period. The S&P 500 has recovered most of last week's losses, driven primarily by the Federal Reserve's outlook of fewer interest rate cuts in 2025, briefly dampening risk appetite.
The index is on track for its best week in seven and is now about 1% below its record high of 6,099.97, reached on December 6. With just three trading days remaining in the year, investors are eyeing new peaks during the "Santa Claus rally," spanning the final five sessions of December and the first two of January. Historically, this phase has delivered average gains of 1.3% for the S&P 500 since 1969, according to the Stock Trader's Almanac.
“This year's rally seems cautious,” noted market strategist Allison, referring to muted enthusiasm among market participants. Optimism from a stellar November, driven by Donald Trump's presidential victory and expectations of pro-business policies, continues to underpin U.S. equities. However, trading volumes remain below the six-month average and are unlikely to normalize until January 6. Investors now shift focus to the December jobs report due on January 10.
Technical Perspective
The last weekly candle ended as a hammer with a small body and upper wick within the body of a red candle, which reflects the possibilities for further accumulation to beat the recent peak.
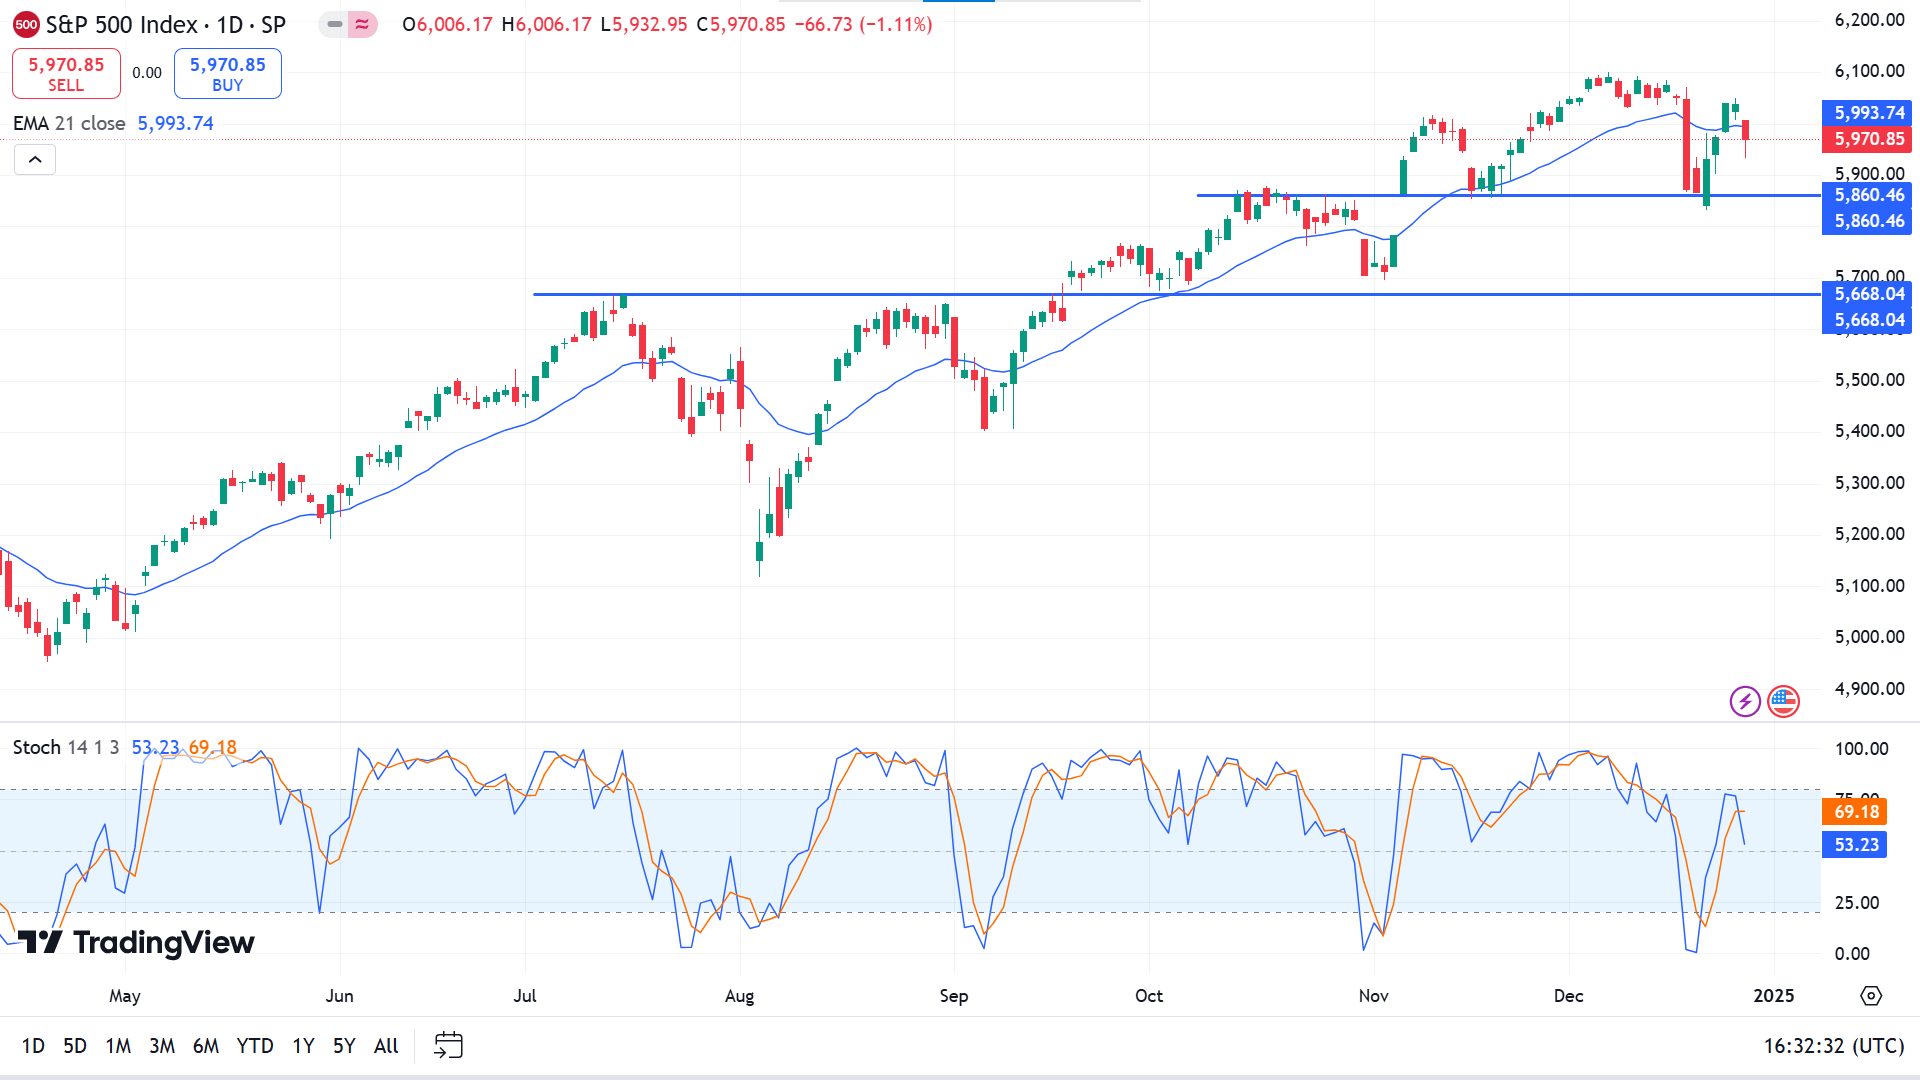
The price faced bearish pressure as it declined below the EMA 21 line on the daily chart. Although the trend remains bullish, the Stochastic indicator window shows seller domination through a bearish crossover between dynamic signal lines and edges downside.
The broader market context suggests that price action traders might be observing 5860.46 to open long positions, which can be a key level to drive the price toward the ATH of 6,099.97 or beyond.
However, if the price dives below 5,860.46, it might disappoint short-term buyers. This also might enable short-term selling opportunities toward support near 5668.04, following the next support near 5254.67.
Gold (XAUUSD)
Fundamental Perspective
Gold (XAUUSD) trades near $2,630 in subdued activity following the Christmas holiday, edging lower. However, its safe-haven appeal remains supported as markets assess the U.S. economic outlook under the incoming Trump administration and the Federal Reserve's evolving interest rate strategy for 2025.
U.S. PCE inflation data suggests the potential for more Fed rate cuts, countering earlier expectations of limited monetary easing. Geopolitical uncertainties, such as the prolonged Russia-Ukraine conflict and unrest in the Middle East, further bolster demand for the precious metal. Gold is set to end the year with a remarkable 27% gain, its strongest annual performance since 2010, fueled by central bank purchases and heightened global tensions.
The U.S. Dollar Index (DXY) trades above 108.00, near its highest since late 2022. A stronger dollar could cap gains for dollar-priced commodities like gold, raising costs for non-USD buyers. However, subdued U.S. Treasury yields, with 2-year and 10-year rates at 4.33% and 4.58%, respectively, may support the non-yielding asset.
Heightened geopolitical risks include reports of thwarted Ukrainian assassination plots in Russia and escalating violence in Gaza, adding to safe-haven demand. Meanwhile, the Fed's cautious stance on 2025 rate cuts underscores lingering economic uncertainties.
Technical Perspective
The last weekly candle closed as a small Doji candle after a red candle, which reflects consolidation as the price moves between a range of a solid green candle for five weeks. The weekly pattern leaves precious metal investors conscious of predicting the next trend.
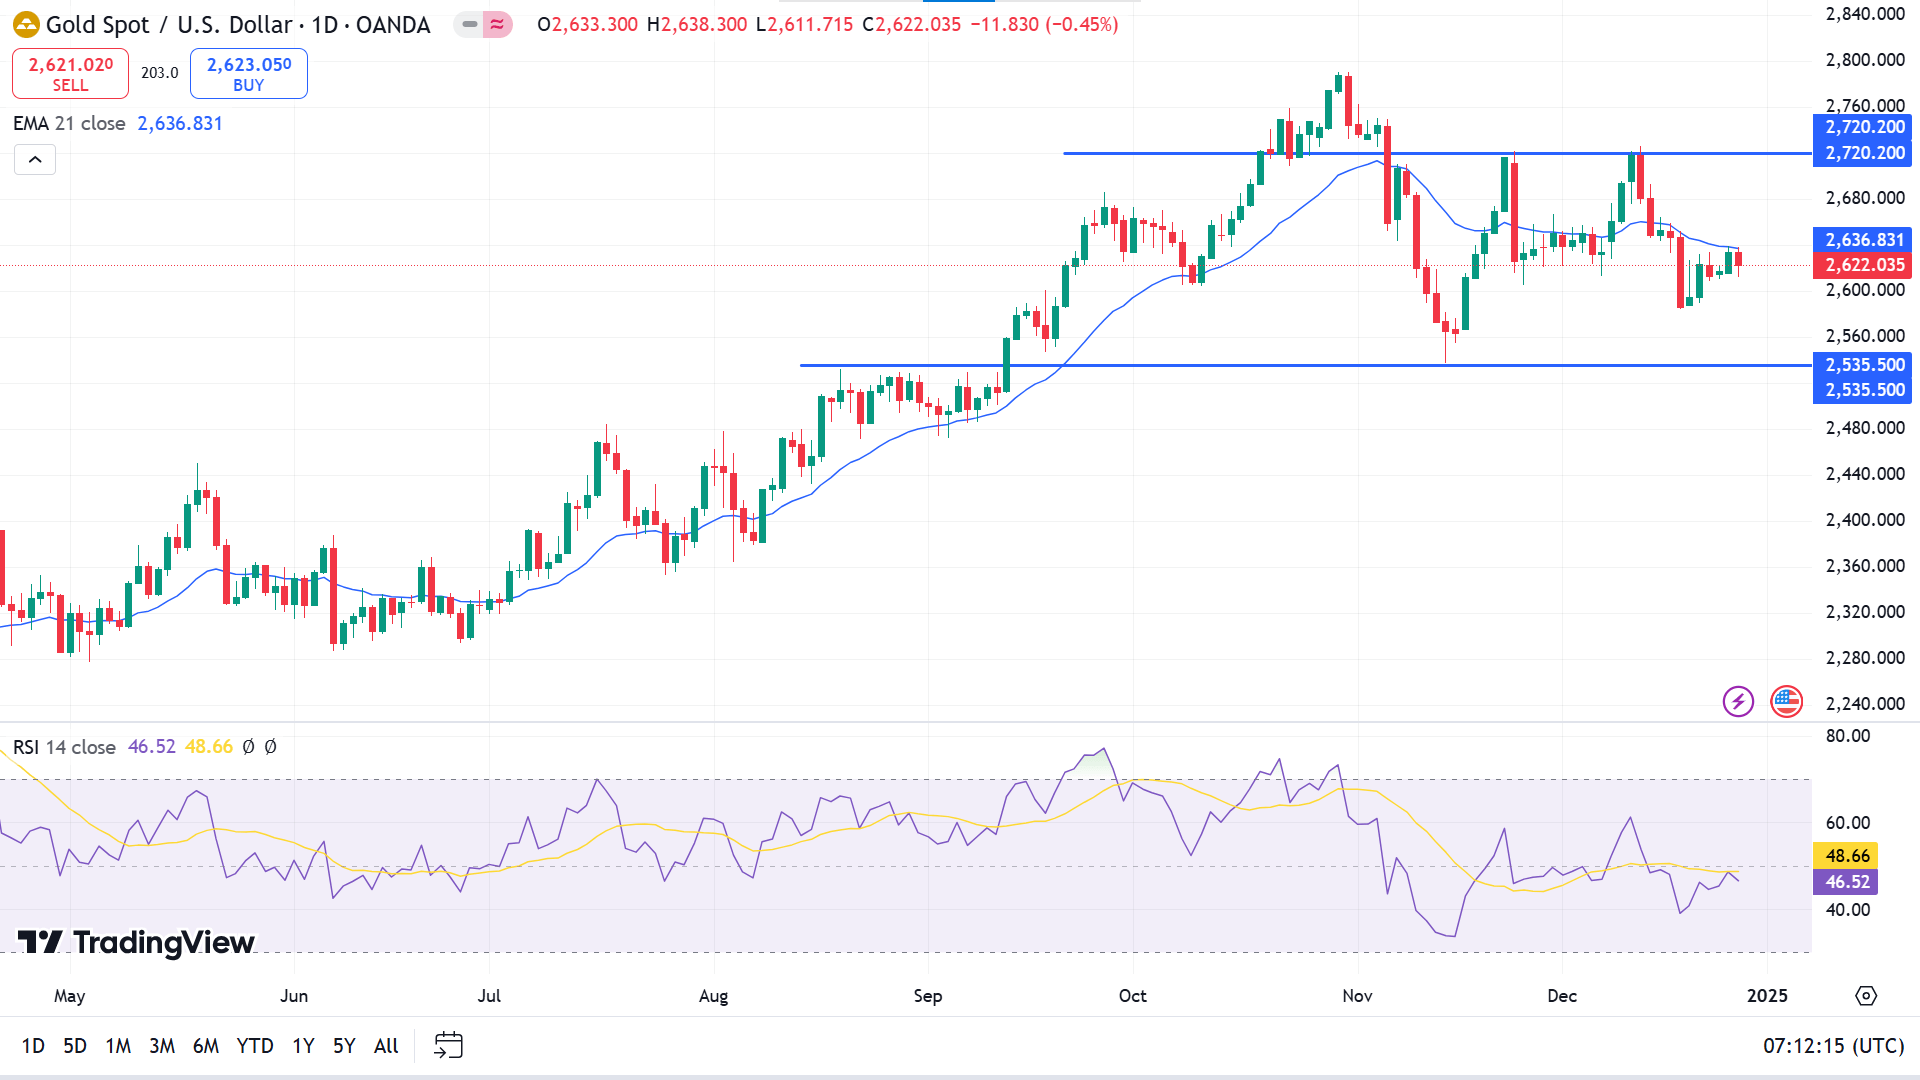
The price below the EMA 21 line on the daily chart reflects bearish pressure on the asset. The RSI indicator window supports the bearish pressure through the dynamic signal line floating below the midline of the indicator window.
Based on the broader market context, traders may be looking at the Nov low of 2535.50, which can be an accumulation level to drive the price toward 2,720.00.
On the other hand, if the price declines below 2535.50, it would disappoint buyers besides sparking short-term selling opportunities toward 2441.99.
Bitcoin (BTCUSD)
Fundamental Perspective
Bitcoin (BTC) is erasing much of its earlier weekly gains after failing to capitalize on the "Santa Claus rally," a typical year-end price surge. Despite this dip, on-chain indicators suggest a potential for recovery, driven by increasing demand on centralized exchanges.
According to Farside Investors, institutional interest in Bitcoin is resurging, with net inflows of $475.2 million into spot Bitcoin Exchange Traded Funds (ETFs) on Thursday. This marks the end of a four-day streak of outflows and highlights growing confidence among institutional players, positioning Bitcoin for a potential 2024 rally.
Analysts at Santiment noted a post-Christmas rise in stablecoin whale activity, with large deposits flowing into centralized exchanges like Binance. Seven stablecoin transactions, ranging from $9 million to $50 million, were recorded within 24 hours. These inflows suggest heightened interest in crypto purchases, potentially signaling a bullish outlook for Bitcoin and new altcoins.
Additionally, the taker buy volume—a measure of trader demand—has consistently grown on Binance since early November, forming higher lows through December 25. This uptick in buying pressure underscores increasing interest among traders and hints at positive price momentum for Bitcoin in the near term.
Technical Perspective
The last weekly candle closed as a doji after a solid red candle hit above the anticipated 100,000 mark due to profit-taking and distribution, leaving investors conscious of the next direction.
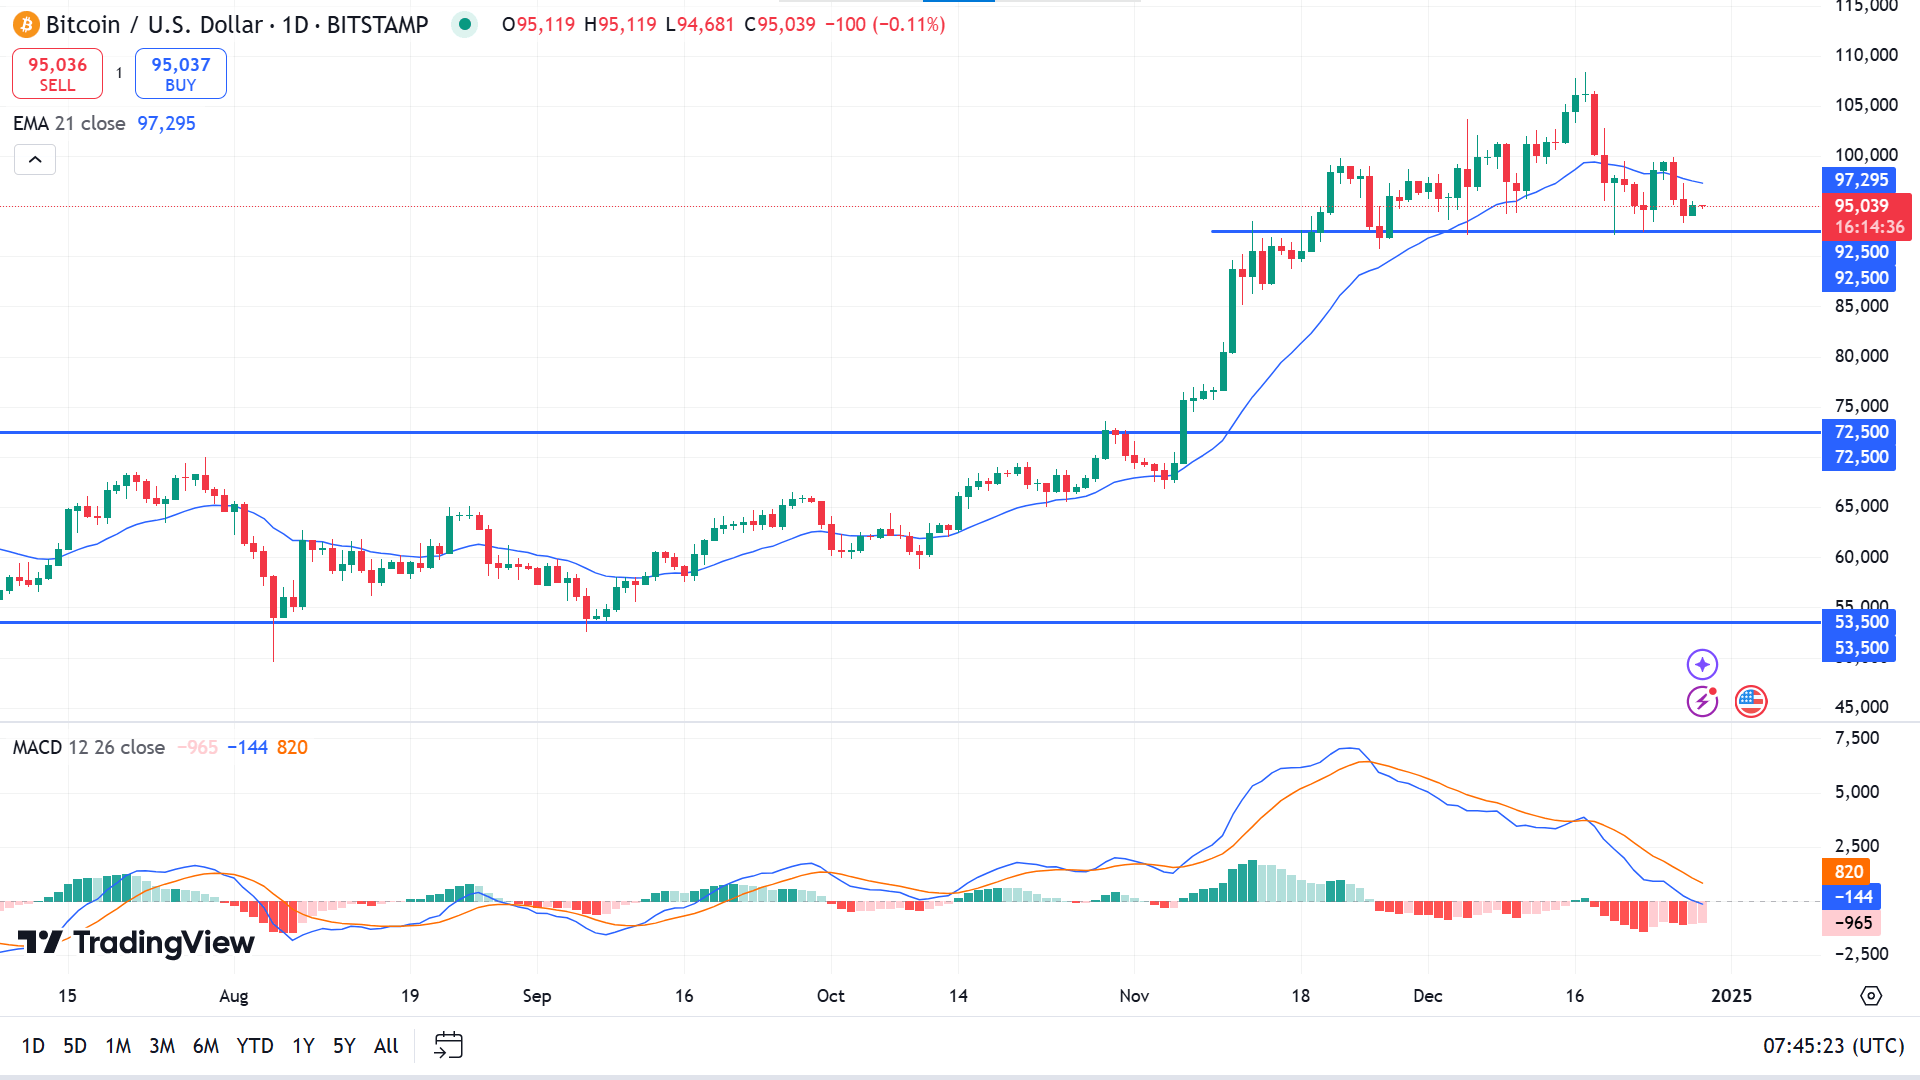
On the daily chart, the price declines below the EMA 21 line due to recent bearish pressure. The MACD indicator reading supports the bearish signal through the dynamic signal line sloping downward and the red histogram bars below the midline of the indicator window.
According to the current scenario, the price is moving above a crucial baseline of 92,500 and might accumulate to beat the ATH of 108,364.
On the negative side, a daily red candle close below 92,500 might disappoint buyers and enable short-term selling opportunities toward anticipated support near 80,000.
Ethereum (ETHUSD)
Fundamental Perspective
Ethereum (ETH) is trading at $3,355, fueling debates about its ability to reach $5,000 during the 2025 bull run. The cryptocurrency faces a pivotal resistance at $4,000, a level it has struggled to break and maintain throughout 2024. Market sentiment remains divided, with key indicators painting a complex picture.
Sentiment data reveals a decline in Ethereum's Open Interest (OI) for derivatives, falling from $14.50 billion in mid-December to $13.94 billion. This signals reduced liquidity and waning bullish confidence. Additionally, CryptoQuant reports rising exchange inflows, indicating increased selling pressure that could weigh on Ethereum's short-term prospects.
Despite these challenges, Ethereum's fundamentals remain strong. Glassnode data shows a steady rise in whale activity, with wallets holding at least 1,000 ETH growing from 5,580 on December 1 to 5,612 by December 18. This accumulation by major holders indicates sustained long-term confidence in Ethereum's prospects.
Meanwhile, the crypto space is abuzz with JetBolt's (JBOLT) presale success, selling over 200 million tokens and introducing features like zero-gas technology and SocialFi staking. While Ethereum navigates its recovery, JetBolt's advancements showcase the growing potential of emerging altcoins in reshaping the blockchain landscape.
Technical Perspective
The price hit the yearly high near 4,109.00 a week ago and couldn't hold above 4000. The last candle ended with a small green body and a small upper wick within the range of the solid red candle, leaving investors cautious about anticipating the next move.
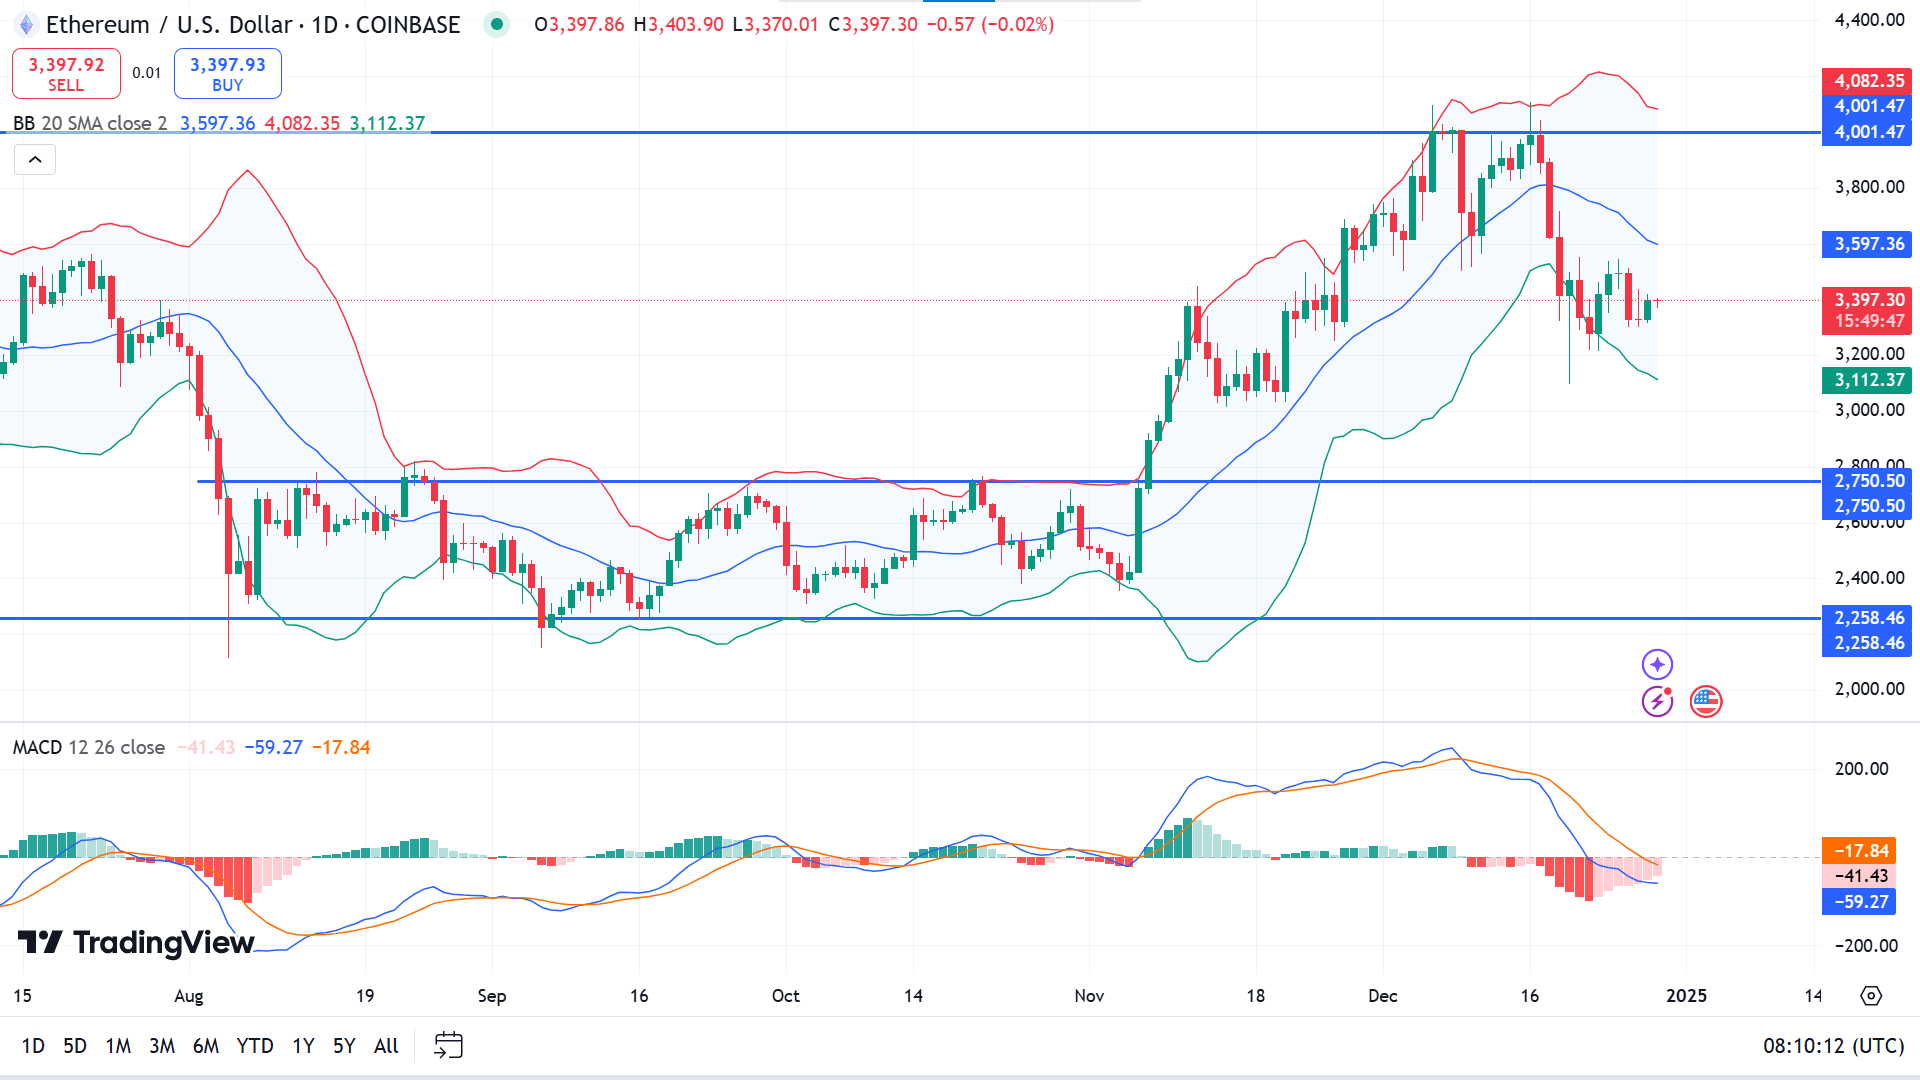
The price is moving on the lower channel of the Bollinger band indicator, and the chart pattern shows buyers may lose interest above 4,001.47. While the MACD indicator shows bearish pressure is active, the red histogram bars fade below the midline of the indicator window, suggesting bears may lose power.
According to the price action concepts, ETH declines to temporary support of 3,228.26, which can drive the price toward the yearly high of 4,109.00 or beyond.
Meanwhile, a daily red candle close below 3,228.26 will invalidate the bullish signal besides sparking short-term selling opportunities toward 2750.50.
Tesla Stock (TSLA)
Fundamental Perspective
China's electric vehicle (EV) market is poised to surpass combustion engine vehicle sales by 2025, achieving a milestone ten years ahead of Beijing's initial target in 2020. Originally aiming for EVs to comprise 50% of car sales by 2035, China is now on track to reach this goal as early as next year, far outpacing EV adoption in the U.S. and Europe.
Projections indicate that EV sales, encompassing battery electric vehicles and plug-in hybrids (known collectively as new energy vehicles or NEVs), will grow by 20% year-on-year and exceed 12 million units by 2025. Meanwhile, sales of combustion engine vehicles are expected to decline by over 10%, dropping below 11 million, according to estimates from UBS, HSBC, Morningstar, and Wood Mackenzie.
Leading the charge is BYD, commanding 34.5% of China's NEV market from January to November 2024. Geely follows with an 8% share, while Tesla holds third place at 6%. In November alone, BYD sold 417,232 NEVs in China, significantly outpacing Tesla's 73,490 units and Geely's 120,896 units, according to the China Passenger Car Association. This rapid transition underscores China's dominance in the global EV landscape.
Technical Perspective
After reaching the new ATH, the weekly chart shows some weakness on the solid bullish pressure through a doji candle after an inverted red hammer candle. Hence, buyers are passionate about determining new trading positions.
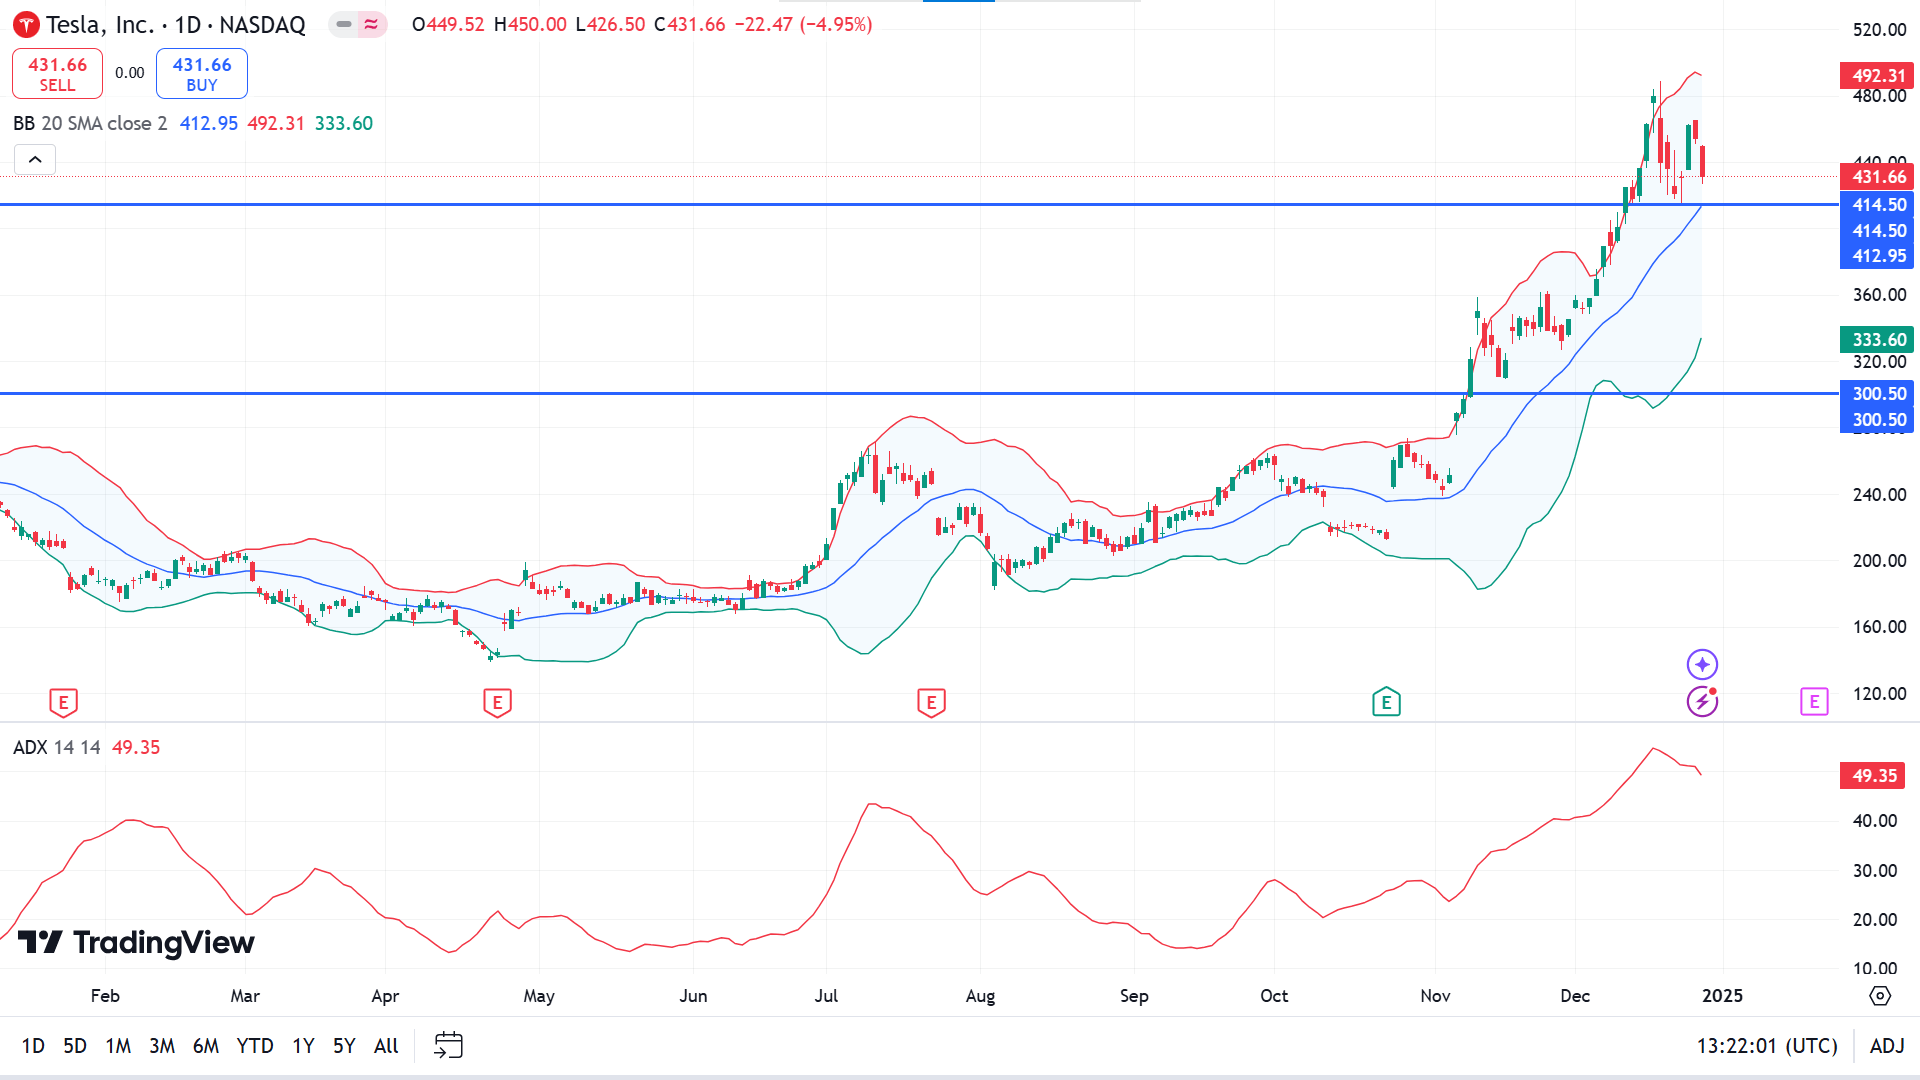
The price is consolidating on the daily chart, moving at the upper channel of the Bollinger bands indicator but still holding long-term dynamic support near 414.50. The ADX indicator window reading near 50 declares sufficient trend strength.
According to the current scenario, buyers are optimistic near 414.50 to beat the ATH 488.54 or beyond that level. Any successful breakout below 414.50 can lead the price toward the support near 351.37.
Nvidia Stock (NVDA)
Fundamental Perspective
Nvidia (NVDA) has experienced a record-breaking year, with its stock more than doubling in value in 2024, driven by soaring demand for its AI chips. While recent declines pushed the stock into correction territory, analysts remain highly optimistic about its future prospects, citing Nvidia's dominant position in the AI market and robust growth potential.
CEO Jensen Huang described AI as a transformative force, with Nvidia positioned to thrive as computing capabilities expand exponentially. The company posted record-breaking fiscal third-quarter revenue of $35.1 billion, fueled by $30.8 billion in data-center revenue—more than double the previous year's figure. Nvidia's next-generation Blackwell AI system, touted as a "game changer," has seen unprecedented demand, underscoring its technological leadership.
Out of 21 analysts tracked by Visible Alpha, all but one rate the stock as a “buy” or equivalent, with an average price target of $177, implying a 31% upside from Friday's closing price of $134.70. Nvidia's market capitalization now exceeds $3 trillion, placing it among an elite group of companies.
Morgan Stanley recently named Nvidia a “top pick,” citing its robust research and development investment and strong partnerships with leading cloud providers, reinforcing its AI dominance in the near term.
Technical Perspective
In the weekly chart, the price floating above a support line creates two doji candles, reflecting investors' enthusiastic concern about the next price movement.
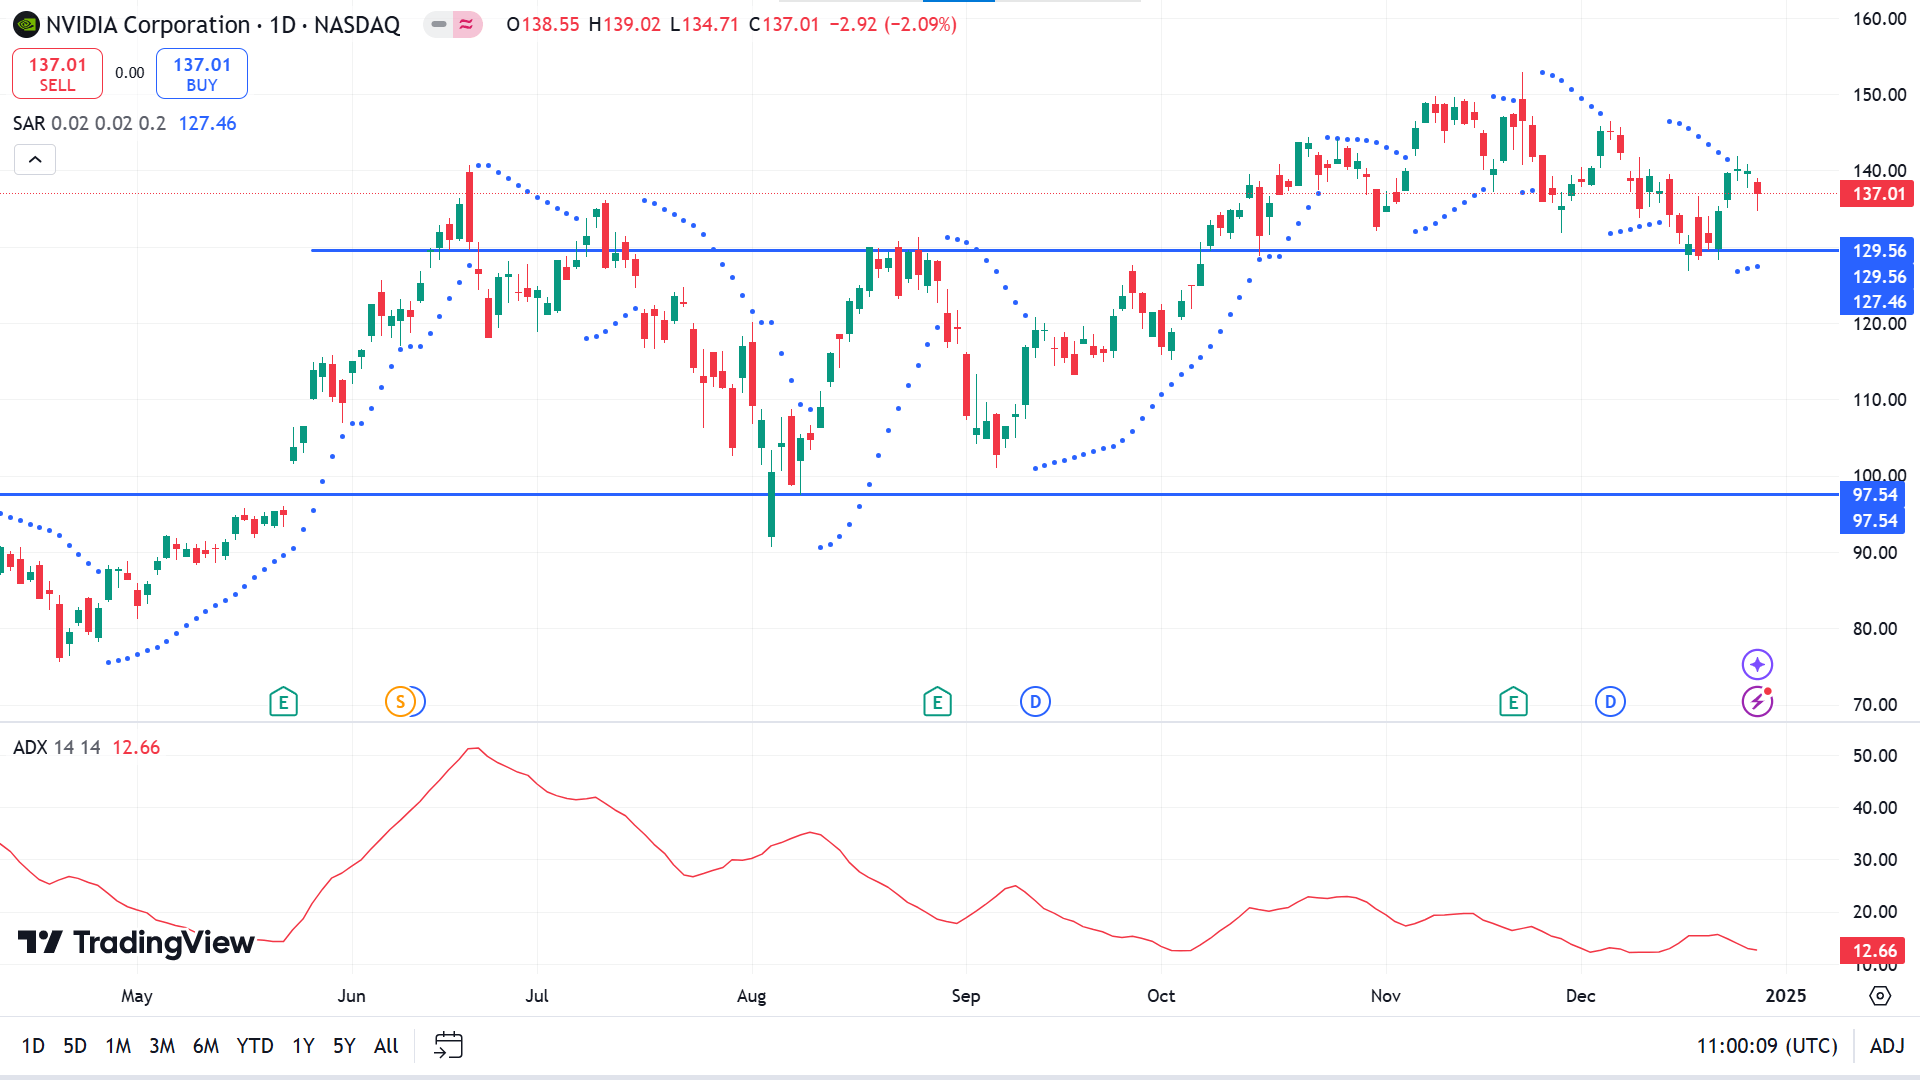
The daily chart reflects a mixed scenario when checking parabolic SAR and the ADX indicator reading. The parabolic SAR continues creating dots below the price price candles, indicating bullish pressures on the asset price. The ADX dynamic line sloping downward declines below 25, suggesting the current trend may lose power and a potential retracement.
Based on the current market context, price action traders may seek adequate long positions near the support of 129.56, which might turn the price back to the ATH near 152.89.
On the other hand, if the price falls below 129.56, buyers might be disappointed, sparking short-term selling opportunities toward 102.17.
WTI Crude Oil (USOUSD)
Fundamental Perspective
West Texas Intermediate (WTI) crude oil is trading around $69.50 per barrel, rebounding from earlier losses. Reports support the prices that major European energy firms prioritize oil and gas for short-term profits over renewables, a trend likely to continue into 2025 as governments delay clean energy targets. This slowdown in renewable policies follows the energy price surge after Russia's 2022 invasion of Ukraine.
Oil prices are on track for a weekly gain, driven by optimism surrounding China's economic recovery efforts. The World Bank recently raised its growth forecast for China through 2025, citing stimulus measures as a positive factor. However, it also noted lingering challenges, including weak consumer confidence and issues in the property sector, which could temper growth. Reports of China's increased flexibility in using government bond proceeds to stimulate its economy have strengthened hopes for higher oil demand from the world's largest importer.
Further supporting prices, Russia declared a federal emergency after a Black Sea oil spill on December 15. The spill occurred during a storm, which caused one tanker to split and another to run aground. The incident underscores ongoing risks in global oil supply chains, adding to crude oil's near-term appeal.
Technical Perspective
The price has been within a specific range since September and is floating near the range top, primarily making sellers optimistic.
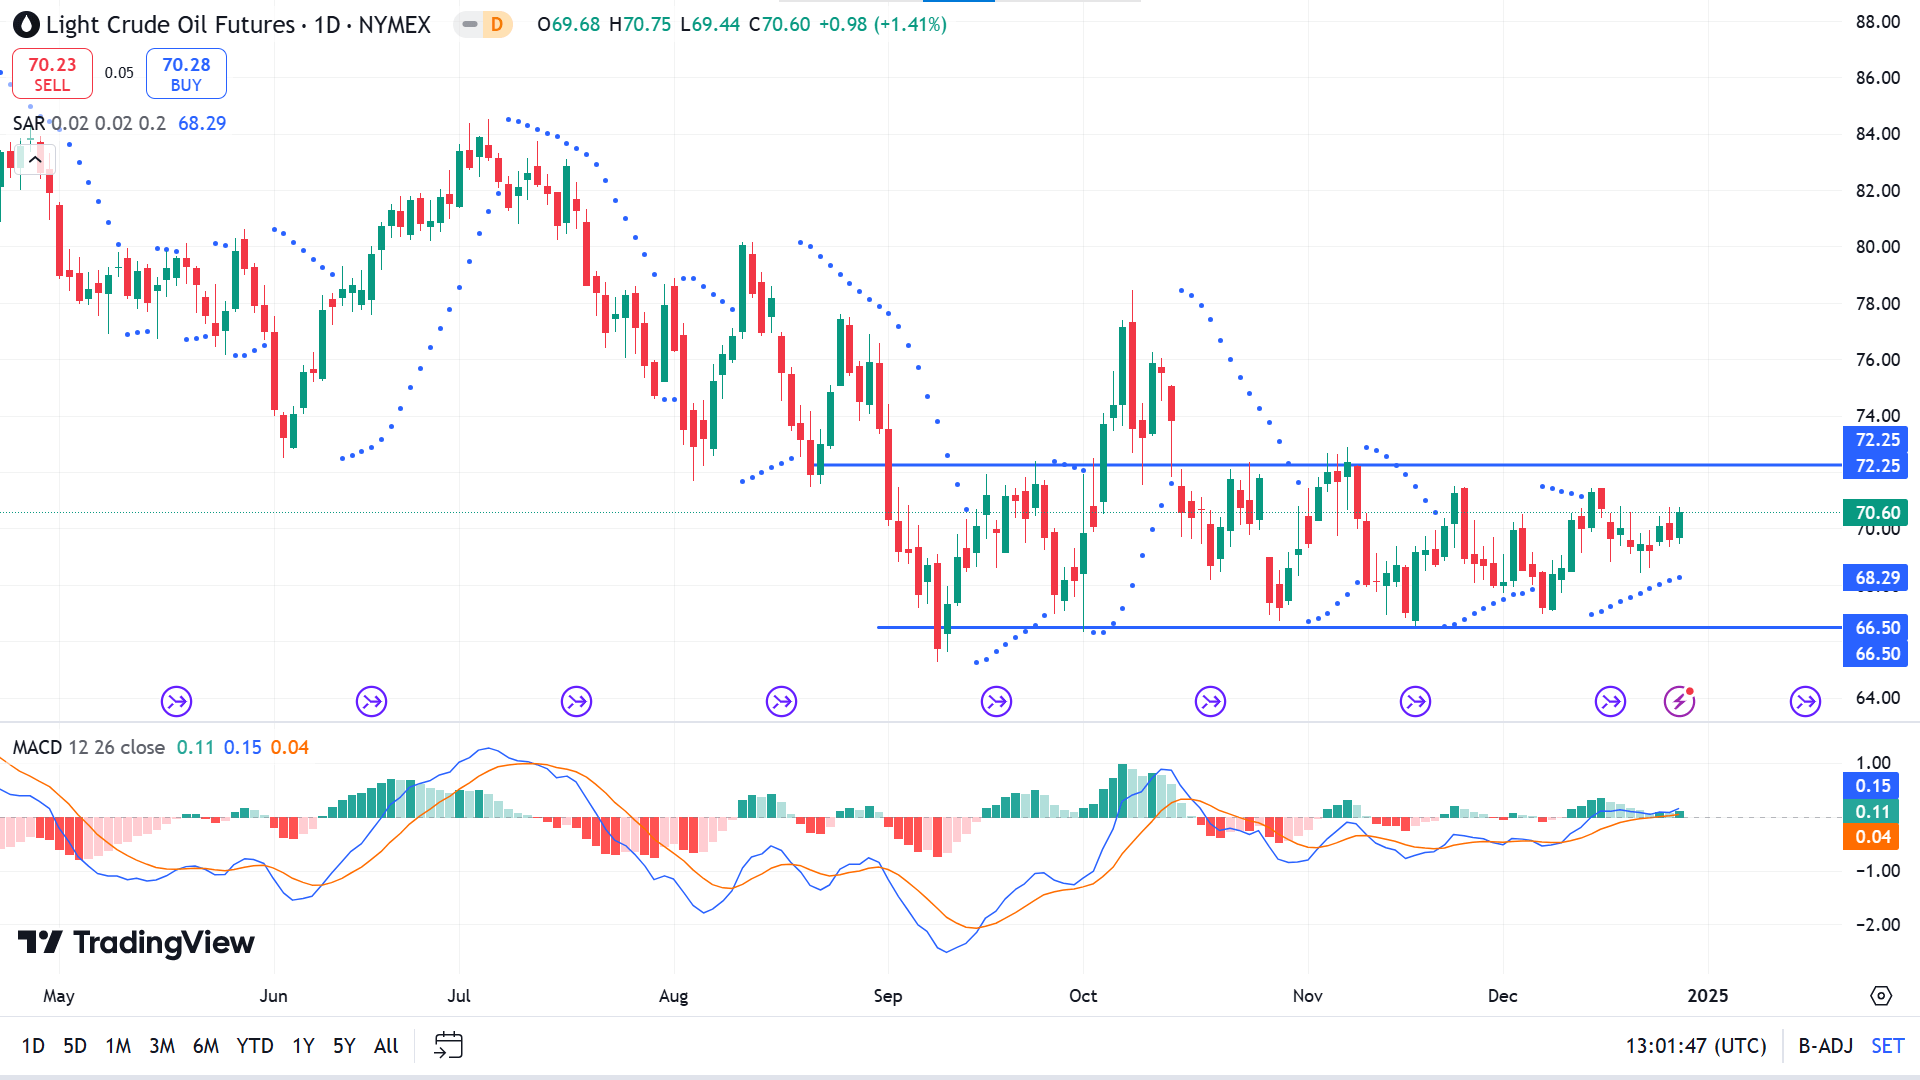
The parabolic SAR indicator creates dots below price candles reflecting buyers' domination of the asset price. The MACD indicator window supports the bullish signal through a dynamic line reaching above the midline of the indicator window, and green histogram bars appear.
Evaluating the current market conditions, buyers primarily look at the range low near 66.50, while sellers seek trading positions near the range peak near 72.25. Any breakout above the resistance of 72.25 might trigger the price toward the following resistance near 77.26, while the price can dive to the yearly low near 65.27 if the 66.50 support fails to sustain.


