Coinbase ( COIN ) shares fell for a fourth straight session on Monday, capping a turbulent month that saw the stock lose a fifth of its value.
Shares of the largest U.S. cryptocurrency brokerage have fallen sharply since hitting a three-year high in early December. The drop in share prices has been closely tied to a sharp drop in exchange volumes since then as bitcoin prices have retreated sharply, raising concerns that lower trading fees could hit the company's revenue.
Coinbase shares have lost about half of their value from their December high, following a broad sell-off in major cryptocurrencies and tech stocks amid concerns that tariffs could slow economic growth and reignite inflation. The stock closed down 1% at $172.23 on Monday.
Below, we break down the technical indicators on the Coinbase chart and point out the major price levels to watch.

Descending Extension Pattern
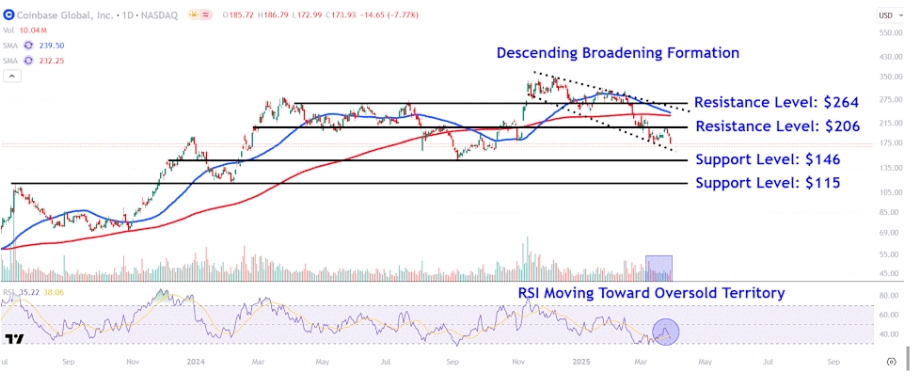
Since November, Coinbase stock has been retreating within a descending extension pattern, with the 50-day moving average (MA) about to cross below the 200-day MA, forming an ominous death cross, a chart pattern that portends lower prices.
Recently, the stock has fallen to the downtrend line of the pattern, although trading volume has generally declined for much of March, suggesting that trading interest in the stock is waning.
Meanwhile, the relative strength index (RSI) is approaching oversold territory, warning investors that price momentum is waning.
Let's find the major support and resistance levels that investors need to watch on the Coinbase chart.
Major Support Levels
If a break below the descending trendline of the descending extension pattern occurs, the stock could initially revisit downtrend support near $146. Investors may look for buying opportunities near the notable swing low of last September, which also aligns with a series of comparable trading levels on the chart between December 2023 and February 2024.
A break below this level could see the stock fall to $115. This area on the chart could offer support near the multi-month horizontal line connecting the July 2023 peak and the February 2024 trough.
Key Resistance Levels to Watch
The initial move higher could see selling pressure around $206. Coinbase stock could run into resistance near the March countertrend high, which aligns with a series of price action on the chart dating back to February of last year.
Finally, a break above this area would bring the $264 level into play. This area, currently sitting above the upper trendline of a descending extension pattern, could draw attention to the series of peaks and troughs that formed on the chart between April of last year and February of this year.
*Disclaimer: The content of this article is for learning purposes only, does not represent the official position of VSTAR, and cannot be used as investment advice.


