Introduction
How has the Fed's reckless rate hikes led to a broader increase in financial liquidity in risky markets? Bitcoin prices may not be directly correlated to Fed rate hikes, but they must be strongly correlated to USD Liquidity.
Fed Monetary Policy Tools No Longer Focused on M2
Last year, the Federal Reserve raised interest rates sharply, and we know that the ultimate goal of the Federal Reserve's monetary policy is to achieve "price stability and full employment," and its intermediate goal is to regulate the federal funds rate. The Federal Reserve's monetary policy regulation tools are mainly used to adjust the federal funds rate (i.e., the price of the U.S. dollar), the discount rate, the reserve requirement ratio, the excess reserve ratio, the overnight reverse repurchase rate to carry out, and with the open market operation of the purchase and sale of bonds, to realize the "Quantitative Tightening (QT)" or "Quantitative Easing (QE)".
From the previous Federal Reserve interest rate meeting minutes between the lines, we see more about the economic vitality, labor market indicators, financial stability and other key words as the participants in the decision to decide the federal funds rate ceiling decision-making basis, and even in the Fed official's speech also rarely mentioned "money supply".
"QT" or "QE", usually considered to control the supply of money and the speed of circulation. But the Federal Reserve is not the number of M0 or M2 as the main regulatory tool, why?
M0 (also known as MB, base money) M0 includes all money in circulation, such as notes and coins (i.e., currency), and also includes commercial banks' deposits with central banks (e.g., the Federal Reserve) and banks' cash reserves M2 is a broader measure of broad money. It includes M0, savings deposits, time deposits, and other more liquid financial assets. These assets can be easily converted into currency or used for payments, reflecting the broader circulation of money and quasi-money.
The main reasons why the Federal Reserve's monetary policy tools and objectives no longer focus on the money supply are, first, that the monetary transmission mechanism in an economy involves a variety of factors, including the velocity of money, the state of the credit market, and the volatility of asset prices. Thus, simply adjusting the money supply may not be able to precisely control inflation. Second, the objective of monetary policy is not only to control inflation, but also includes real output, employment, and other aspects. As a result, the Fed typically prefers to use other tools, such as interest rate policy and quantitative easing, to achieve its economic stability and inflation goals. These tools can more directly affect market interest rates, credit conditions, and financial markets.
In short, although controlling the money supply seems to be able to reduce inflation, but not absolutely; even if the money supply is controlled, it is difficult to control the speed of circulation of money and conduction path - also can not realize the effect of QT or QE.
Because of this, the Federal Reserve in order to achieve the purpose of this reckless interest rate hikes, although not the slightest concern about the changes in M2, but the result is that M2 fell.
This round of rate hikes began in March 2022, and by September 2023 the Fed had raised rates 11 times in a row, with a cumulative increase of 525 basis points. At the same time, M2 fell correspondingly.
Accompanied by interest rate hikes brought about by market tightening expectations, in the past 2022, institutions have been bearish 2023 U.S. stock market performance.
Tightening expectations finally soar
At the beginning of the year, institutions were more pessimistic about the impact of multiple clouds on risk markets, including high inflation, the impact of interest rate hikes, banking crises, recession and the debt ceiling. But the fact is that despite the rise in the price of the U.S. dollar and the decline in the number of U.S. dollars, the U.S. stock market in 2023 was strong and reached record highs, in particular, the Nasdaq index rose 43% for the year, the S&P 500 and the Dow Jones index rose 24% and 14%, respectively, approaching and reaching a new all-time high. U.S. stocks all the way up, the reason for this, CICC summarized three main factors:
First, after the outbreak of small and medium-sized bank risk events in March, the U.S. government has taken measures to continue to come to the rescue. The Treasury Department and the FDIC provided deposit insurance to bank depositors affected by the problems, which helped stabilize confidence. At the same time, the Federal Reserve, through the BTFP for banks to provide liquidity support, essentially "expanding the table," so that U.S. equities in the first half of rising expectations for interest rate hikes and risk-free rates, did not bear too much pressure. On the contrary, this period of interest rate sensitive growth stocks performed strongly, the Nasdaq rose 43%, significantly more than the Dow Jones index rose 14%, while the technology growth-oriented Nasdaq 100 index is up 54% for the year.
Second, the successful resolution of the debt ceiling crisis that erupted in May boosted market sentiment and risk appetite in the short term. With the US dollar maintaining its global reserve currency status, the US government has theoretically unlimited room to increase its leverage in the short term, which has been an important factor in lowering the risk premium for the private sector.
Despite rising valuation levels and a sharp decline in risk-free rates since November, the main driver throughout the year was the decline in earnings and risk premiums.
Furthermore, throughout the year, fiscal policy kicked in during the third quarter, contributing to a further acceleration in economic growth, which in turn led to good results for US-listed companies. In particular, traditional companies, which had not benefited from the AI trend, returned to positive growth and earnings in the third quarter after four consecutive quarters of declining revenues.
Why have QT-targeted rate hikes led to a broader increase in financial liquidity in risky markets?
The Fed actively "QT", the fiscal unexpectedly "QE”
According to CICC's research, from the macro level, the fiscal accidental expansion is the key to the U.S. stock market trend for the whole year exceeded the expectations at the beginning of the year, and the trend of the U.S. stock market this year basically corresponds to the marginal changes in financial liquidity indicators.
In order to understand CICC's analysis, we first need to understand the main factors of USD Liquidity and the reasons for its changes.
Factor 1: The balance sheet of the Federal Reserve
The Fed's balance sheet is a financial statement that records the Fed's assets and liabilities. This statement shows the various types of financial assets and liabilities that the Fed holds at a given point in time, reflecting its monetary policy and the functioning of financial markets. The balance sheet is usually divided into two main sections: assets and liabilities.
The Federal Reserve's asset-side accounts include (1) the gold account; (2) special drawing rights (SDRs); (3) coins; (4) directly held securities, unamortized securities premiums/discounts, repurchase agreements, and loans; (5) net portfolio positions of special purpose entities (SPEs), which are primarily the net portfolio holdings of limited liability companies (LLPs) established by the New York Federal Reserve to rescue financial institutions in distress; (6) accounts receivable (funds in transit); (7) fixed assets; (8) central bank liquidity swaps; (9) foreign currency-denominated assets; and (10) other assets.
The Fed's liability accounts include (1) currency in circulation; (2) reverse repurchase agreements; (3) deposits; (4) funds in transit; (5) injections of Treasury funds into credit facilities; and (6) other liabilities and dividends payable.
Changes in the balance sheet can reflect the Fed's monetary policy and market operations. For example, by buying or selling Treasury securities, the Fed can adjust its balance sheet to affect the level of the money supply and interest rates in order to achieve its monetary policy objectives.
For example, when the Fed buys bonds from commercial banks to expand its balance sheet, commercial banks receive more funds that can be released, and the result is an injection of funds into the financial system, encouraging lending and supporting economic activity; while selling bonds to shrink the balance sheet absorbs funds, thereby tightening the money supply.
Thus:
Fed Balance Sheet Increases - USD Liquidity Increases
Fed Balance Sheet Decreases - USD Liquidity Decreases
Factor 2: The Fed's Overnight Reverse Repo Balance
Reverse repurchase (RRP) is a financial instrument, typically a short-term (usually overnight) agreement, between the Federal Reserve and other financial institutions. The Fed's reverse repurchase operations are designed to achieve the purpose of absorbing excess liquidity by selling its own assets to lock in other deposits from depository institutions in the reverse repo instrument, thereby adjusting short-term interest rates in the market.
- Liquidity absorption: The reverse repo operation is essentially a liquidity absorption operation because the Federal Reserve sells assets, such as Treasury securities, in reverse repo transactions, thereby absorbing liquidity from the market. This helps to prevent excessive growth of funds in the market and helps to keep money market rates near their target levels.
- Impact on short-term interest rates: Reverse repos can affect short-term interest rates in the market by providing an alternative, low-risk investment option. When reverse repo rates are higher than short-term rates in other markets, financial institutions are more willing to participate in reverse repo transactions, thereby influencing short-term market interest rates.
- Adjustment of monetary policy: Reverse repurchase agreements are part of the Federal Reserve's implementation of monetary policy. Reverse repos allow the Fed to adjust the level of liquidity in the market as needed. The size and interest rate of reverse repurchase agreements may vary depending on the Federal Reserve's need to adjust monetary policy to maintain stable money market conditions.
Overall, reverse repurchase agreements are one of the Federal Reserve's tools for managing market liquidity and short-term interest rates. Through reverse repos, the Fed can absorb or inject funds as needed to achieve its monetary policy objectives and maintain the smooth functioning of financial markets.
For example, the New York Fed allows eligible counterparties to deposit U.S. dollars through overnight reverse repos and earn a return, but the currency multiplier for the New York Fed's RRP balances is zero because once the funds are in the Fed's account, they no longer create money and become "dead money" because the Fed does not use the deposited funds to make commercial loans. The Fed does not use these deposited funds to make commercial loans. But money deposited at any other commercial bank/financial institution creates a money multiplier.
For example, prior to the outbreak, U.S. commercial bank reserve ratios ranged from 3% to 10% - resulting in a money multiplier for U.S. commercial banks of 33x to 10x - but the Fed has since lowered it to 0%, which means that commercial banks can lend 100% of their money, yet they don't need to have guaranteed funds for those deposits.
The money market fund (MMF) must be mentioned here. This is a fund where both retail and institutional customers can deposit cash to earn short-term returns. People can choose to deposit all their idle cash in the MMF and can withdraw it within one business day. And the MMF can invest the money in RRPs and a variety of other low-risk short-term credit instruments (e.g., U.S. Treasuries, AAA-rated U.S. corporate commercial paper) - leaving the money with the Federal Reserve is the least risky option and pays about the same fees as the other two options, but both options carry some risk. As a result, money market funds prefer to keep their money at the Federal Reserve rather than in a leveraged financial economy, if they can.
Therefore:
Fed Overnight Reverse Repo Balance Decreases - USD Liquidity Increases
Fed Overnight Reverse Repo Balance Increases - USD Liquidity Decreases
Factor 3: Treasury TGA Account
Market liquidity is directly affected by the Treasury General Account (TGA), an account maintained by the U.S. Department of the Treasury to hold the cash balances of the federal government. Changes in this account can affect the liquidity of financial markets to some extent, particularly in short-term money markets.
- Inflows and outflows of funds: When the cash balance in the TGA account increases, it means that more funds are flowing into the government's account. Conversely, if the cash balance in the TGA account decreases, it means that more funds are flowing out of the government account. This directly affects the overall liquidity of the market.
- Effect on short-term market interest rates: Changes in the TGA account will affect short-term money market rates. If the government needs to raise funds, it will withdraw funds from the TGA account, which could lead to less liquidity in the market while putting upward pressure on short-term market rates. Conversely, if the government deposits funds into the TGA account, it may increase liquidity in the market and put downward pressure on short-term market interest rates.
- Market participant confidence: The level of the TGA account may also affect the level of market participant confidence. An increase in account balances may be viewed as a positive sign of liquidity in the market, while a decrease in account balances may raise concerns about market tightening.
Overall, changes in the TGA account are a direct reflection of the federal government's financing position and affect market liquidity. This account plays a moderating role in U.S. monetary policy and short-term market interest rates.
The U.S. Treasury General Account (TGA) is in balance with the New York Fed. When it decreases, it means the U.S. Treasury is injecting money directly into the economy and creating activity. When it increases, it means that the U.S. Treasury is saving money rather than stimulating economic activity. When the Treasury sells bonds, the TGA also increases. This action removes liquidity from the market because buyers must pay for the bonds in dollars.
Therefore:
TGA Account Increases - USD Liquidity Decreases
TGA Account Decreases - USD Liquidity Increases
In short, USD Liquidity increases and decreases in the following scenarios:
USD Liquidity - Increases:
Fed balance sheet - Increases
RRP Balance - Decreases
TGA - Decreases
USD Liquidity - Decreases:
Fed Balance Sheet - Decreases
RRP Balance - Increases
TGA - Increase
However, all three potential factors do not always point in the same direction - for example, sometimes the Fed's balance sheet grows while the TGA grows. Thus, whether dollar liquidity increases or decreases depends on the interaction of these three factors, the direction in which they change, and the magnitude or speed at which they occur.
Understanding the concepts of these three indicators and their impact on liquidity, we can determine that dollar liquidity is largely determined by the Fed's (unleveraged) balances, and we can arrive at a calculation of U.S. financial liquidity:
Dollar Liquidity Status Index = [the Fed's balance of assets and liabilities] - [the total amount of reverse repo bids accepted by the Fed] - [the balance of the U.S. Treasury's general account held by the Fed].
CICC looks at the "quantitative" side of U.S. financial liquidity and finds that U.S. equities in 2023 are essentially aligned with the marginal changes in the financial liquidity index, with three phases of increasing Fed balance sheet, decreasing TGA accounts, and decreasing RRPs (all pointing to an increase in U.S. dollar liquidity):
1) Financial liquidity increased between March and mid-July as U.S. stocks rallied, corresponding to the crisis in small and medium sized banks, which caused the Fed to expand its balance sheet by purchasing Treasuries and other financial instruments (providing liquidity to banks via BTFP);
2) In mid-July through September, a pullback in U.S. equities, corresponding to the Treasury's issuance of bonds to replenish the TGA account after the debt ceiling issue is resolved and tapering continues, leads to a reversal of financial liquidity to the downside;
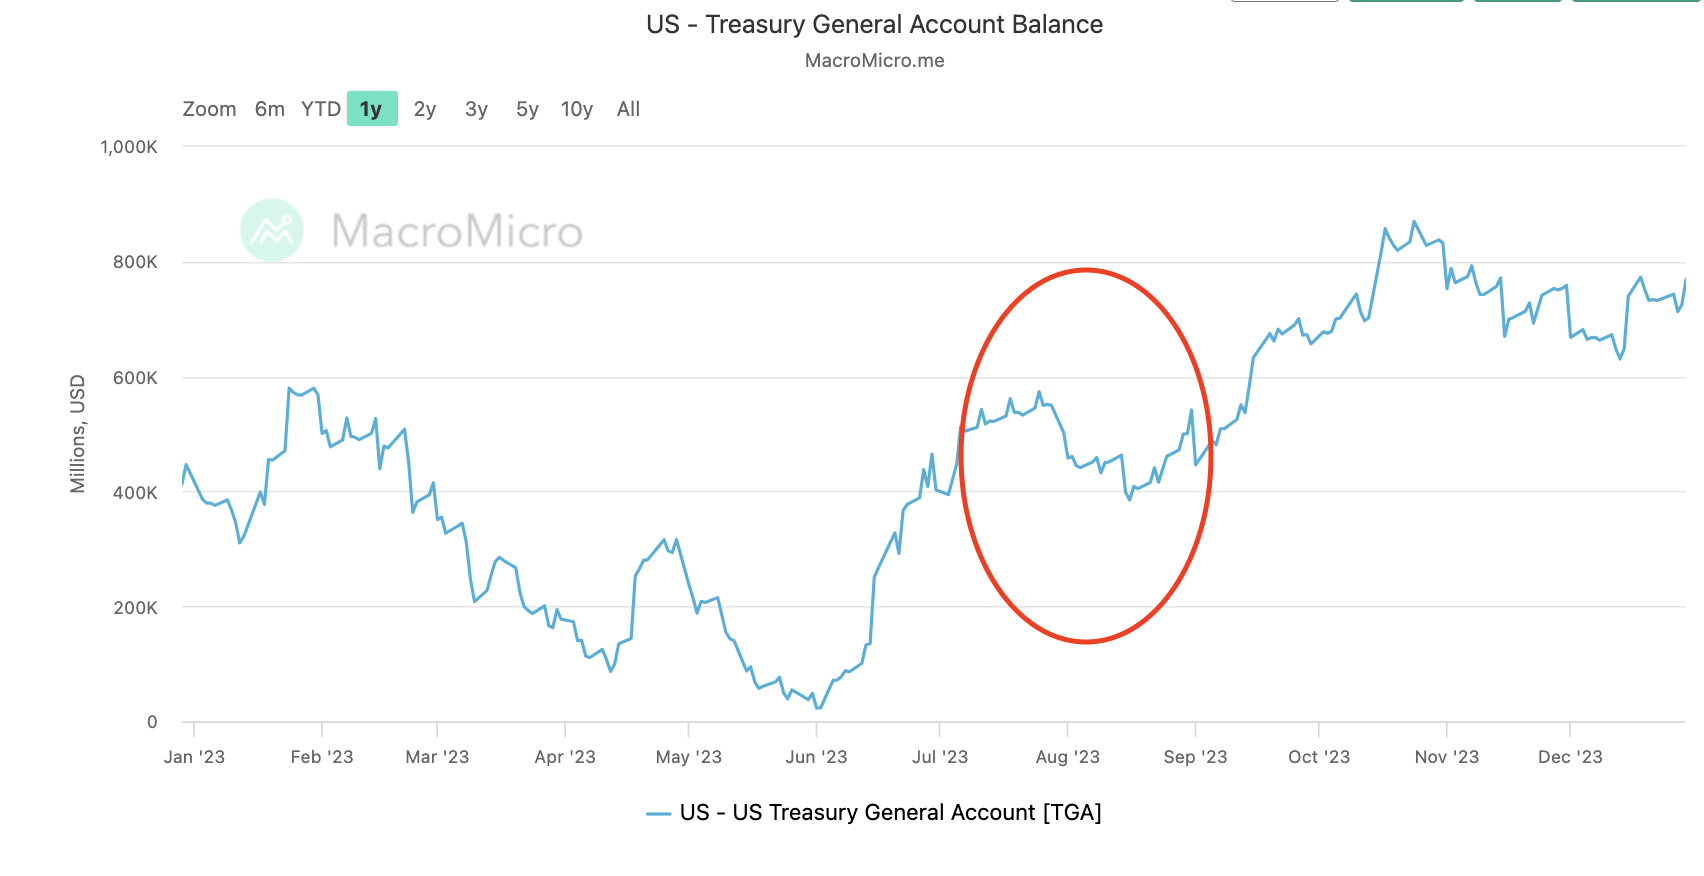
Chart: U.S. Treasury TGA Account (January 3, 2024)
3) In October to date, US equities are hitting new highs again, corresponding to the completion of the TGA account replenishment and the accelerated release of reverse repo trades to hedge against the effects of tapering, with financial liquidity trending up instead of down.
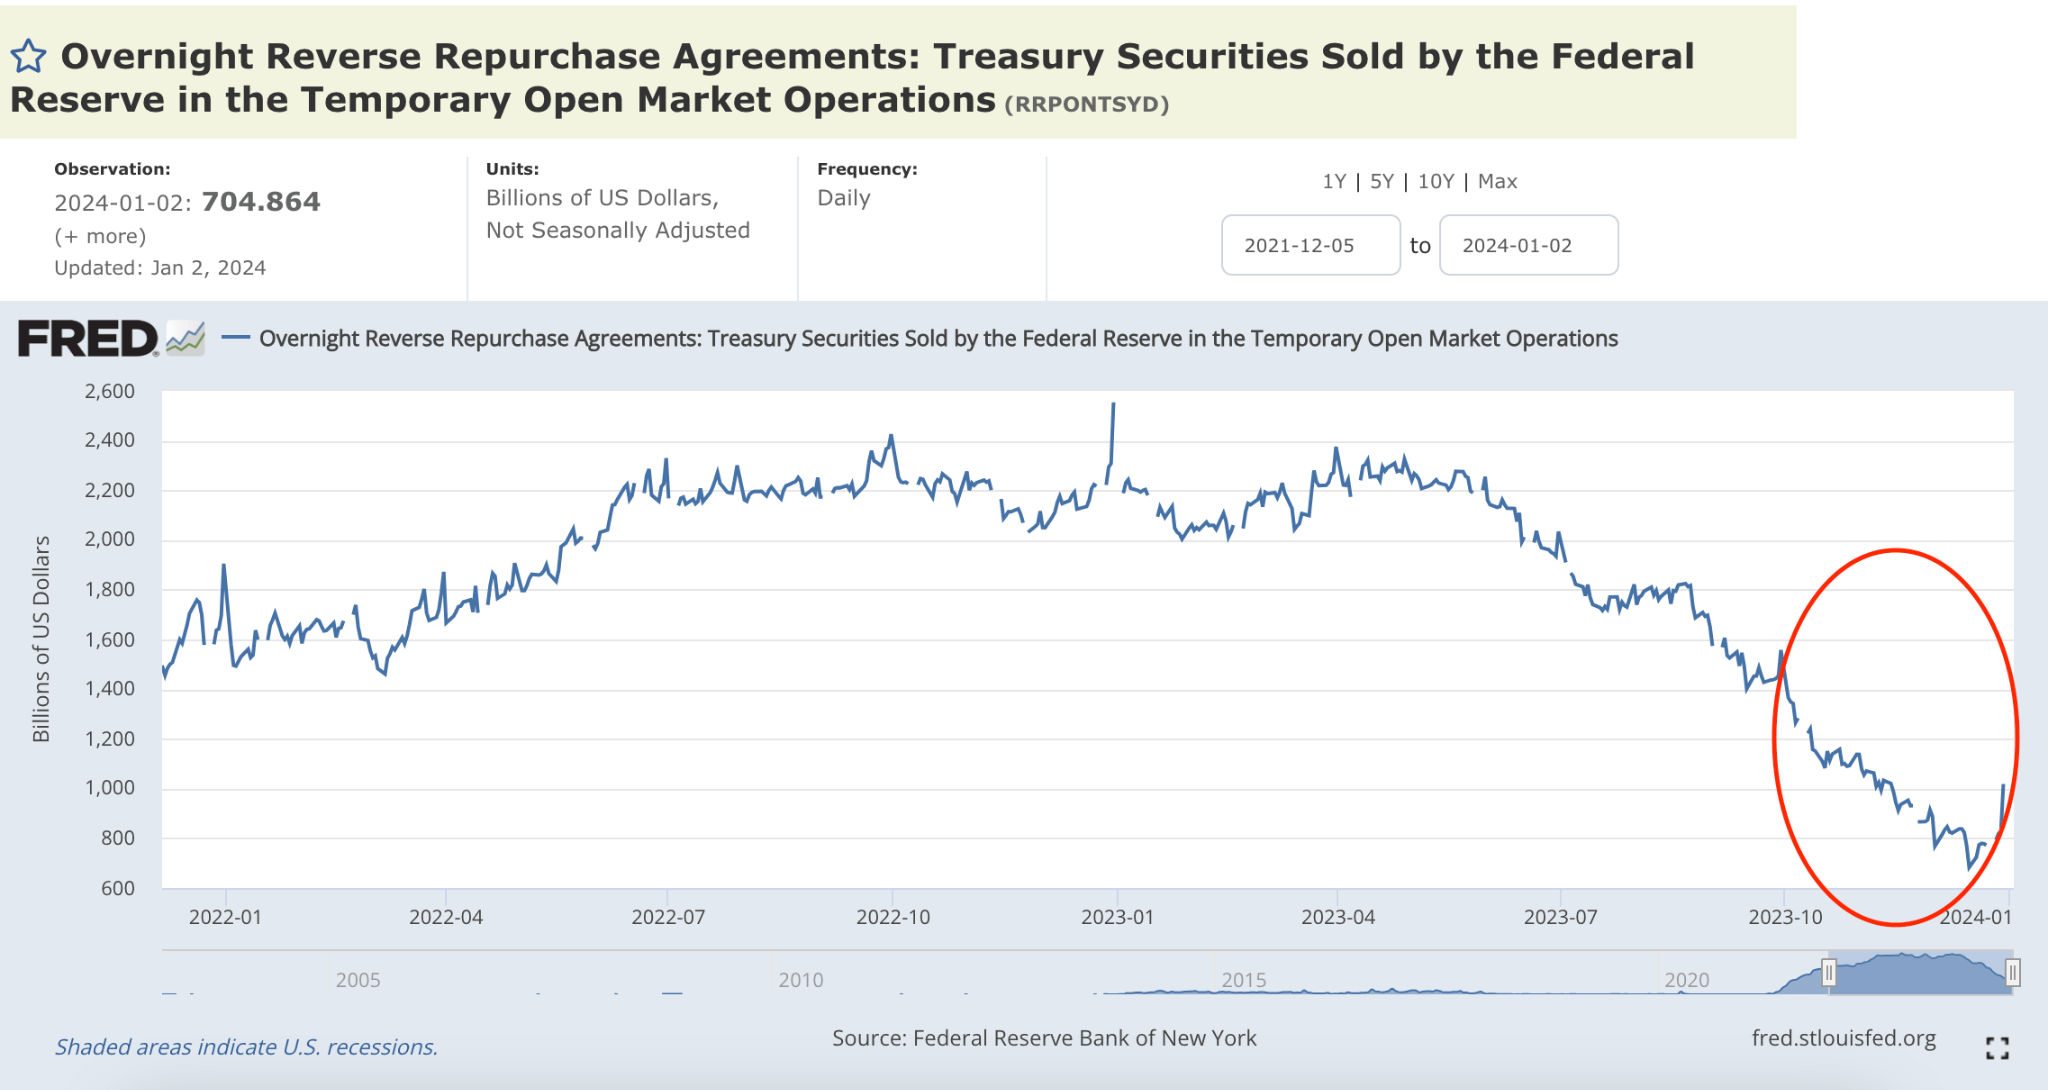
Chart: Total Fed Overnight Reverse Repos (January 3, 2024)
Bitcoin and USD Liquidity Conditions Index
Historically, there has been some positive correlation between dollar liquidity and changes in risk asset prices.
In the current phase of cryptocurrency capital markets, bitcoin is a powerful indicator (and sometimes leading indicator) of the state of global dollar liquidity.
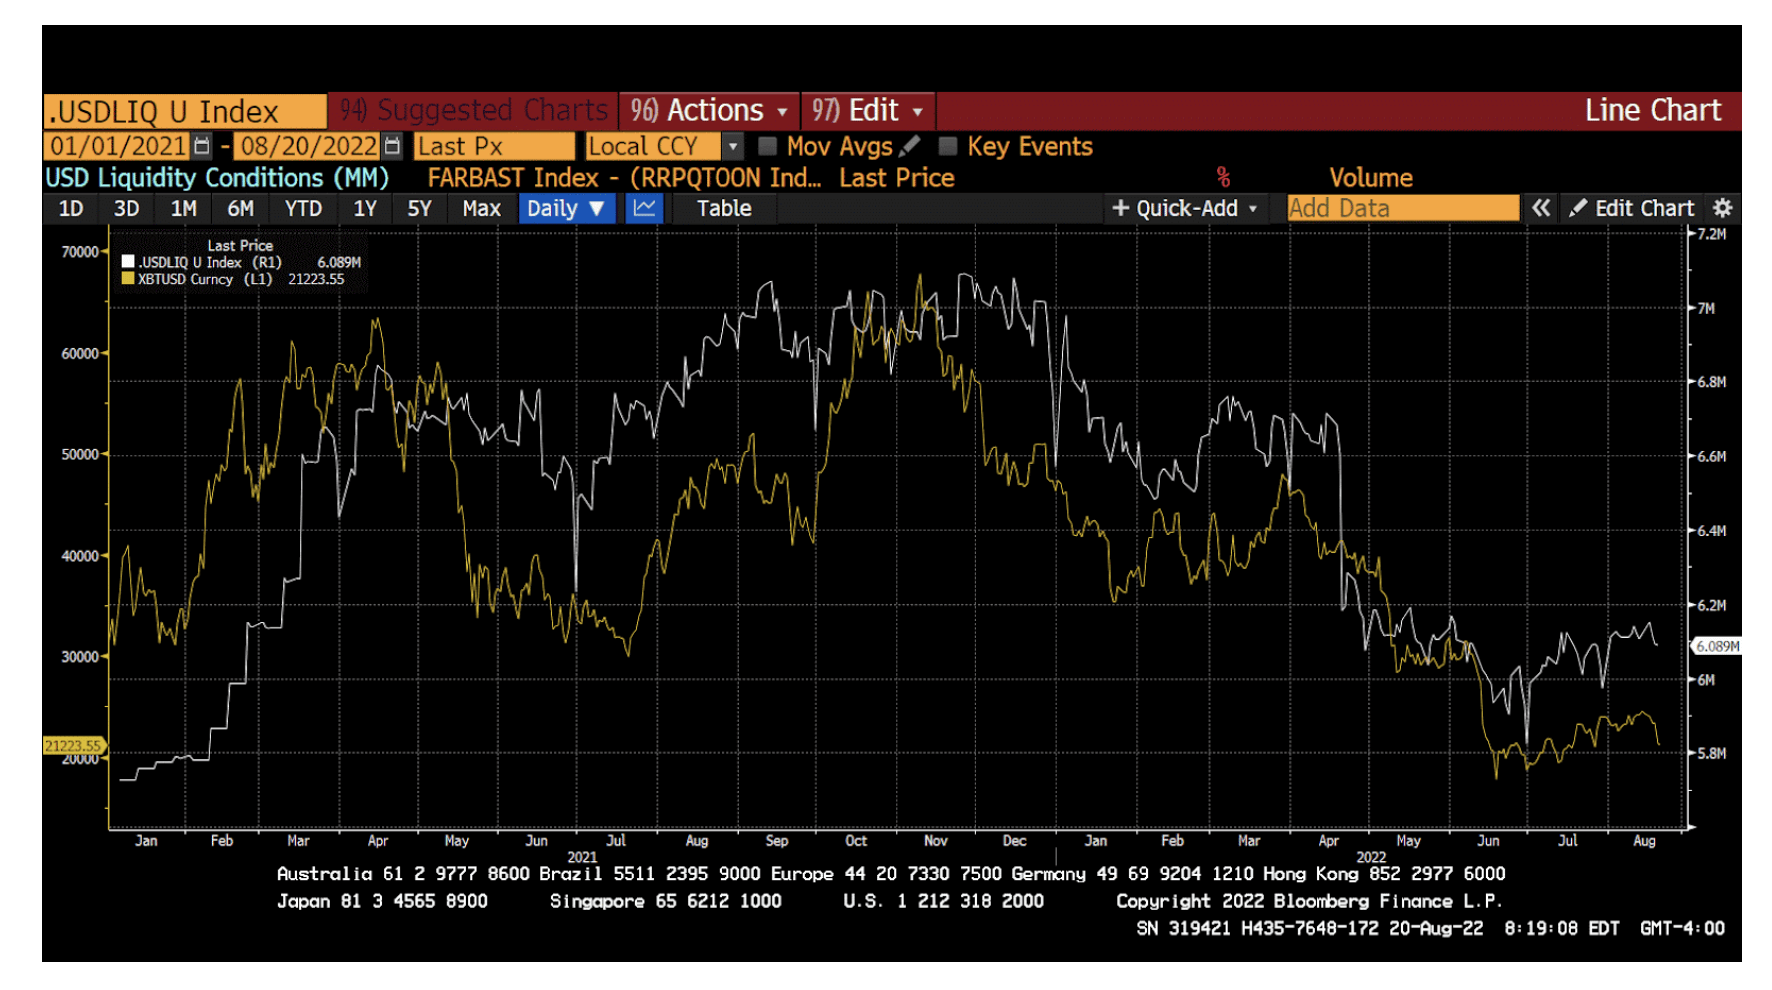
Bitcoin (yellow) vs. USD Liquidity Conditions (white) January 2021-August 2022
To see how accurate this relationship is, let's take a look at the highs and lows of US dollar liquidity and bitcoin from January 2021 to August 2022:
The Bitcoin and USD liquidity indicators correspond to localized highs or lows on dates that are close to each other. Bitcoin consistently overshoots in advance of an uptrend and consistently undershoots in advance of a downtrend. As a result, Bitcoin is currently a powerful leading indicator of USD liquidity.
Bitcoin is a digital currency that represents different systems and ideologies about how society can best organize its monetary affairs. The U.S. dollar is the global reserve currency that is compatible with the U.S.-dominated Western financial system. We can expect that when the dollar system creates surpluses, bitcoin will absorb them. Bitcoin is a real-time smoke detector whose price is linked to the bubble behavior of the dollar-based financial system.
Thus, if the quantity of money (liquidity) has a greater impact on the financial markets than its price, then the Fed can raise interest rates at will without harming the markets as long as the dollar liquidity index continues to rise. The act of raising the federal funds rate would make the Fed look like it is fighting inflation, and the Fed could even allow its balance sheet to shrink to maintain its image. Behind the scenes, however, there is still the ability to influence RRP balances and also require the Treasury to spend more TGA funds to stimulate economic activity, leading to a net increase in liquidity and boosting stock performance. While both of these potential levers are limited in their ability - neither the RRP balance nor the TGA can go below zero - they can still be used to effectively offset QT in the short term.