
The Polygon price (MATIC) has decreased by 19% over the past 30 days. The token has recovered several times, but the last few weeks have seen extremely lackluster price movement.
MATIC On Chain-metric Analysis
Santiment claims that Polygon's future is still very dismal. The Open Interest (OI), or the total value of all pending contracts in the market, contributes to this. The OI for each trade was $38.85 million at the time of publication.
This level was last attained by the metric in June 2022, particularly during the downturn in the market. For those who are unfamiliar, a rise in OI signifies that traders are putting more liquidity into contracts linked to a token, thereby increasing access to the cryptocurrency.
This improvement in net positioning typically results in a price increase. On the other hand, a decline in open interest indicates that traders may be withdrawing funds, which could hurt the price.
MATIC Blockchain Has Fewer Cruisers
From a trading standpoint, this value's decline suggests stronger sellers. This might further depress the Polygon native token price if it stays the same.
Nevertheless, data from IntoTheBlock suggests that the market as a whole does not appear to think that way. The blockchain statistics platform indicates that there are fewer Cruisers and Traders.
Those who have owned a cryptocurrency for three to twelve months are known as cruisers. Conversely, traders are individuals who have held within the previous 30 days.
An increase in participants indicates the market's confidence in a token's potential. However, the fact that it dropped indicates that a sizable portion of the market has doubts about MATIC's near- to medium-term potential.
MATIC Price Prediction Technical Analysis
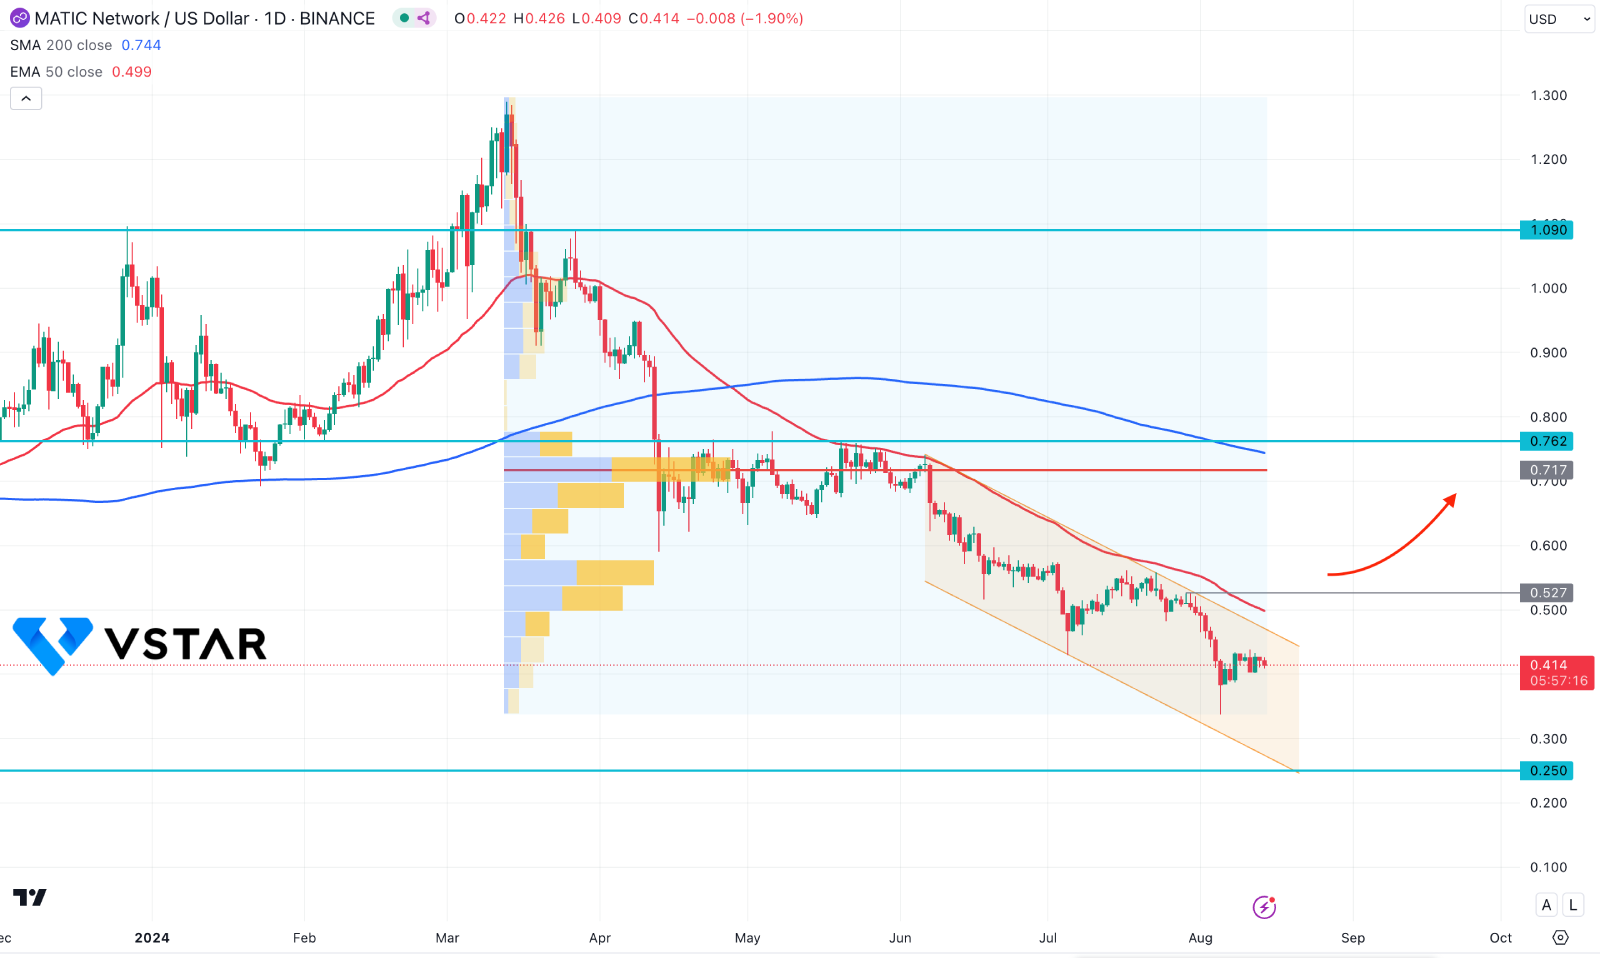
In the daily chart of MATIC price, the recent price shows a bearish continuation momentum, suggesting a short opportunity.
Looking at the volume structure, the most active level since April 2024 is at 0.717 level, which is above the current MATIC coin price. Moreover, the 200-day Simple Moving Average is above the current price with the 50-day EMA. As both dynamic lines are above the current Polygon price and aimed lower, we may expect a bearish continuation from a valid price action.
Based on the daily market outlook, an upward pressure with a channel breakout could signal a trend reversal. In that case, a daily close above the 0.527 resistance level could be a potential long opportunity, aiming for the 1.000 psychological level.
On the other hand, a failure to break above the 50 day EMA line with a valid bearish reversal could signal a trend continuation, aiming for the 0.200 level.