


On August 13, following the bell, Nu Holdings Ltd. (NU) will release its results for the second quarter of 2024. As the current price action is potent for bulls, we may consider it a strong buy, depending on the price action.
NU Earnings Forecast
According to analyst estimates, the to-be-reported revenues are expected to be 10 cents, representing 11% successive growth. With an average estimated $2.9 billion, revenues are expected to grow by 6.1% over the previous quarter. Analyst revisions and estimates have not changed recently.
Analysts anticipate that robust customer growth will be the primary driver of the company's notable profit margin growth over the past year in the to-be-reported period. With 85.5 million active customers, the consensus estimate indicates a 3.5% sequential expansion. NU's low-cost functioning platform and robust revenue are anticipated to positively affect the bottom line during the quarter.
NU Competitor Analysis
Its nearest rivals have also not performed well, with SoFi Technologies SOFI rising by just 1% and Banco Santander (Brasil) S.A. BSBR hardly moves at all during the same time frame.
Beyond the short-term results, NU's stock has increased by 20.3% in the last half-year and 42.7% so far this year, suggesting that the present drop is a part of an adjustment phase.
In comparison to its industry, NU is now trading below market value. NU shares are currently trading at 21.95X forward revenue, which is much less than the industry average of 33.42 when examining the projected 12-month Price/Earnings proportion. NU is now trading at 21.62X, significantly less than the industry average of 53.65X, based on the following 12-month EV-to-EBITDA.
NU Geographical Performance
Driven by a strong brand, an effective budget, and enhanced monetization, NU's growth in Brazil is spreading throughout Latin America, encompassing Mexico and Colombia. Revenues increased 69% over the previous year in the initial quarter of 2024, and adjusted net profit soared 143%. As a result, the company's customer base grew by 5.5 million to reach 99.3 million worldwide.
The trend toward digitization encourages continued expansion. NU's future looks bright despite obstacles like competition and foreign exchange risks. Growth is anticipated from expanding geographically into Uruguay, Chile, Argentina, Peru, and Uruguay and improving services in existing markets.
NU Stock Forecast Technical Analysis
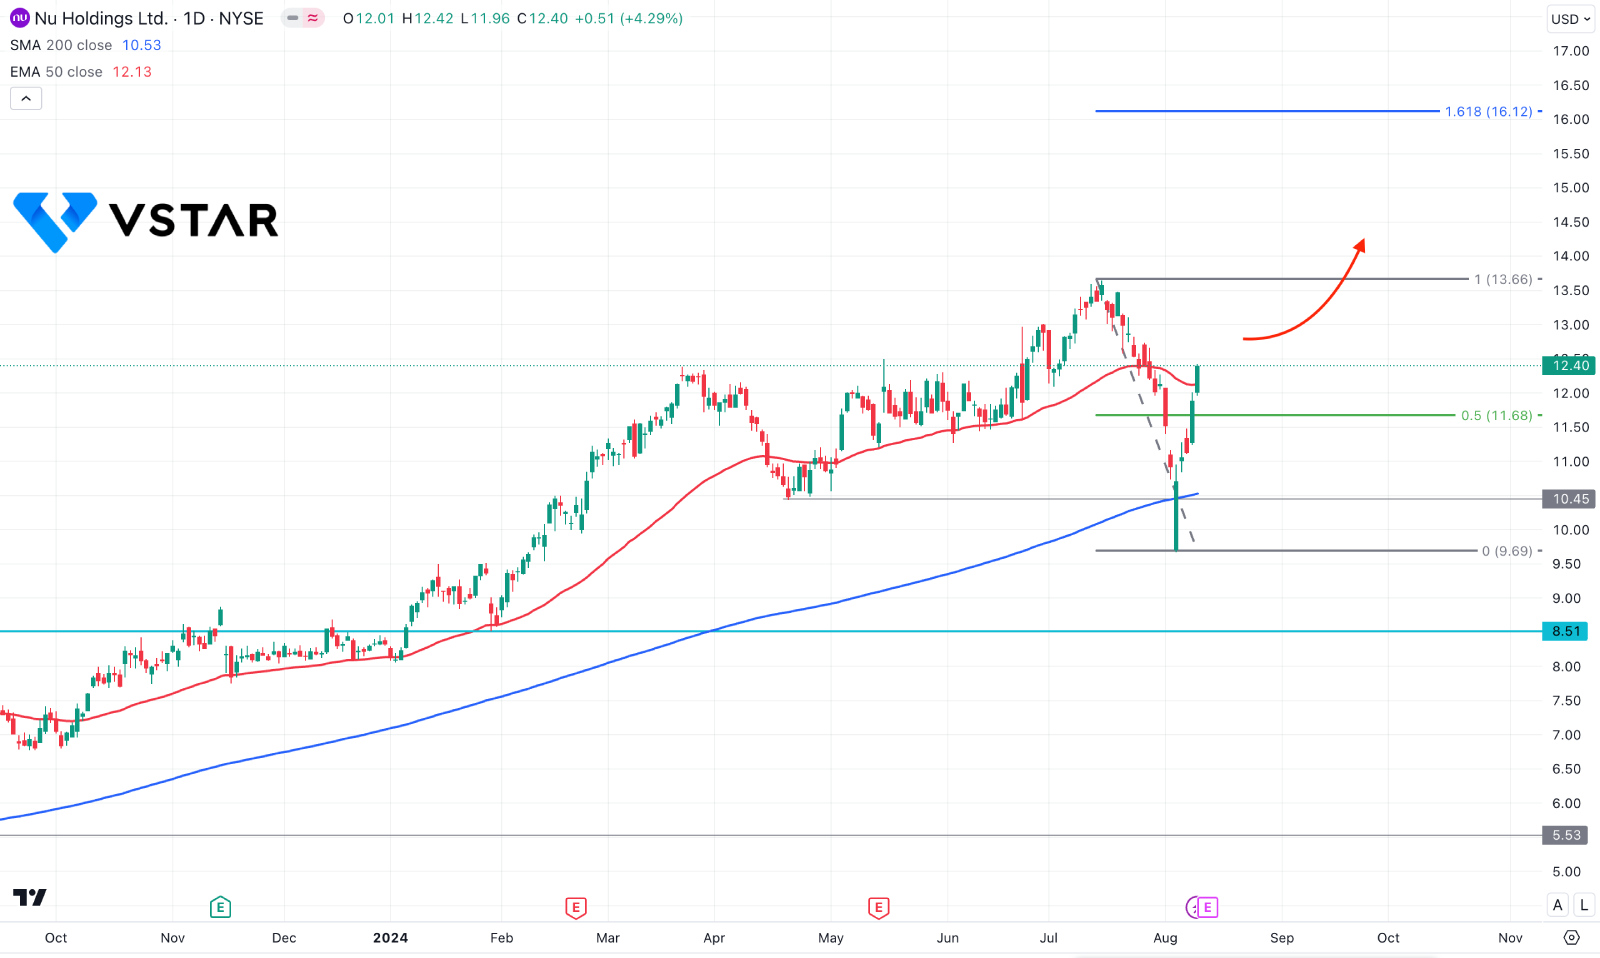
In the daily chart of NU stock price, the overall market momentum is bullish, whereas the most recent price showed a bullish counter-impulsive momentum. Primarily, the upward pressure came potent above crucial dynamic lines, suggesting a potential trend continuation signal.
In the main chart, the 200 day Simple Moving Average is the major support from where the price showed a strong rebound. Also the upside pressure is visible above the 50 day Exponential Moving Average, suggesting a Golden Cross continuation signal.
Primarily, the bullish pressure is potent in NU Holdings stock, where a stable market above the 50-day EMA could extend the momentum toward the 161.8% Fibonacci Extension level at the 16.12 level.
The strong resistance level to look at is the 13.66 level, from where a bearish reversal is possible. A strong bearish candlestick pattern from the 12.00 to 13.70 zone could be a bearish signal, aiming for the 9.50 area.