Natural gas (NG) aimed higher after rising from a one-week low due to forecasts that Arctic air would flow into the lower 48 US states, increasing demand for nat-gas for heating. With a second possible cold front this week, the Commodity Weather Group predicted under-normal temperatures for the eastern United States on Friday for the remaining half of next week.
Natural Gas Weekly Stock Report
Price of Nat-gas When the weekly EIA stock report revealed that Nat-gas inventories dropped by -2 bcf, a lower draw than anticipated of -3 bcf. Friday first prolonged Wednesday's declines to a one-week low, indicating ample nat-gas supplies. This put nat-gas holdings +7.2% over their 5-calendar year intermittent average for this period.
Last Friday, BNEF reported that smaller-48 state air out gas production was 104.5 bcf/day (+0.3% y/y). BNEF reported that the lower-48 state's gas demand on Friday was 96.3 bcf/day, or -6.9% year over year. On Friday, BNEF reported that LNG net transfers to US LNG export terminals were 14.1 bcf/day (+4.5% w/w).
Why Is Natural Gas Price Moving Higher?
On the strength of an uptrend in European nat-gas rates to a one-year high, nat-gas prices surged last week to a one-year high last Friday. Following Russia's hypersonic missile launch into Ukraine, the growing severity of the conflict between Ukraine and Russia caused gas prices in Europe to rise.
There is a greater chance that some of the final Russian natural gas supplies to Europe will be cut off because last Thursday, the United States authorized Gazprombank, the last significant Russian banking organization that certain central European nations still use to pay for the gas they purchase from Russia.
Natural Gas Bullish Case
A rise in US electricity production positively impacts utility companies' demand for natural gas. As per the report released Wednesday, US electricity output increased +3.86% year-over-year to 73,873 GWh (gigawatt hours) in the week closing November 23 and +1.91% year-over-year to 4,168,195 GWh in the 52 weeks closing November 23.
Natural Gas Prices Technical Analysis

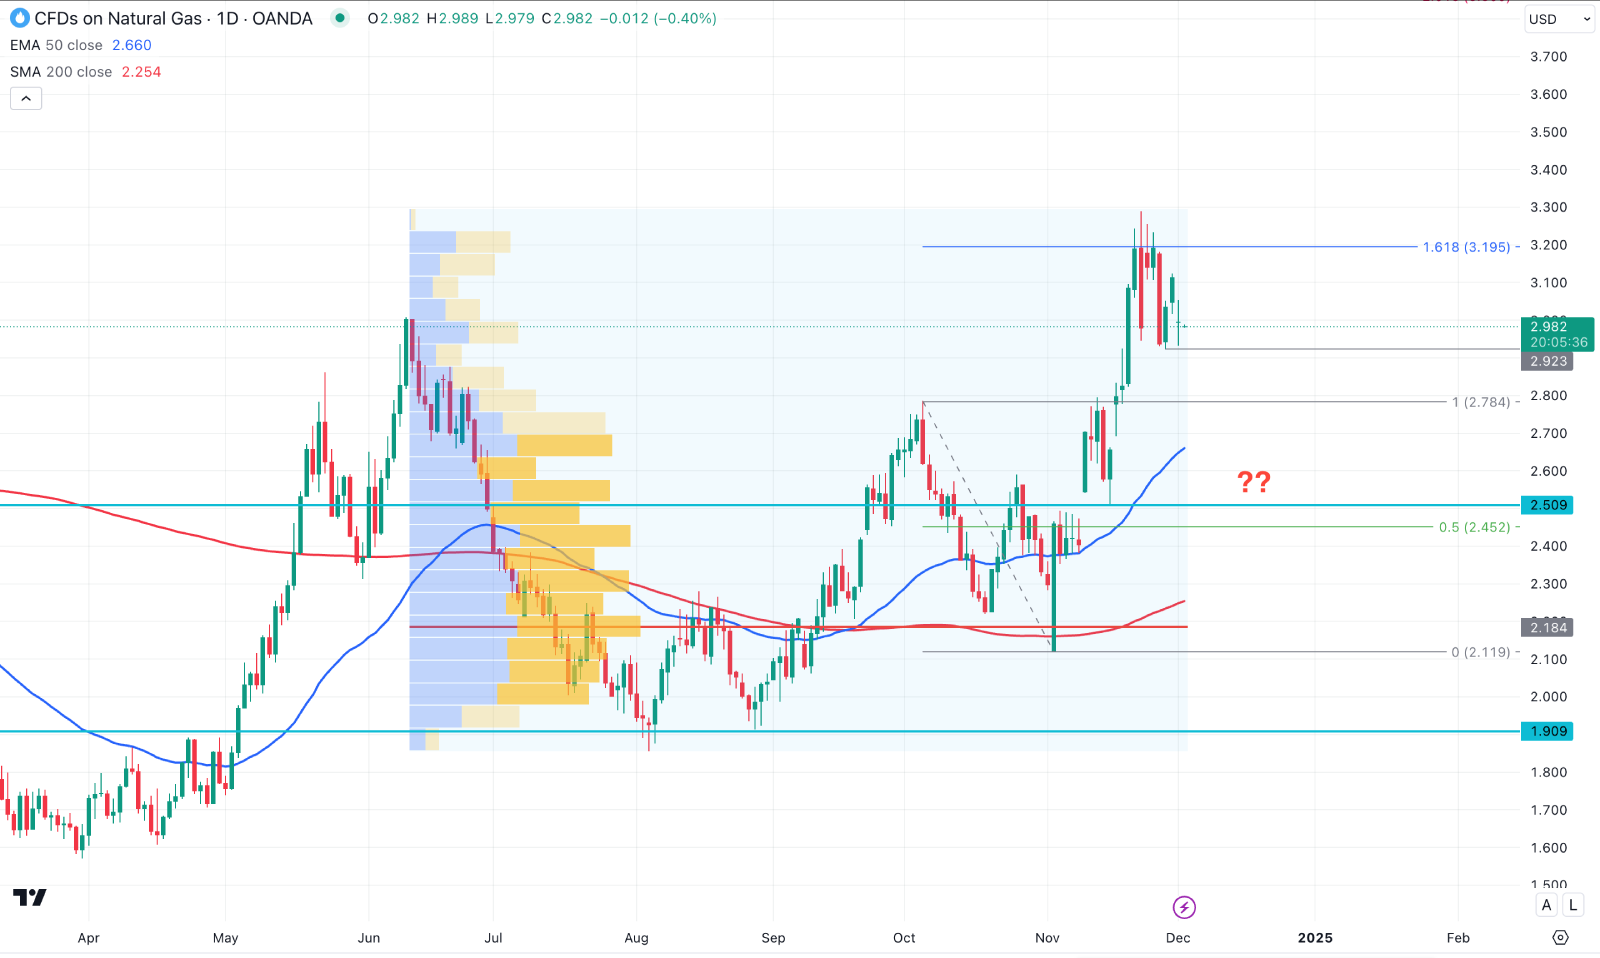
In the daily chart of NG, the ongoing market momentum is bullish, where the current price is trading at the record high level. In that case, investors should monitor how the price trades at the yearly high as sufficient bullish signals are needed from the premium zone.
Technically, a downside correction is pending as a gap between the current price and the 50-day EMA is extended, which signals a pending downside correction as a mean reversion. Also the high volume line still remains at the bottom, supporting the overbought condition.
Based on this structure, the near-term support level is at the 2.923 level as a break below this line could lower the price towards the 2.509 level. A sufficient bullish pressure from the 50 day EMA could offer the decent long opportunity, aiming for the 3.600 level. However, an extended selling pressure below the 2.462 level could lower the price towards the 2.100 level.


