
This week, gold price fell below $2,520 an ounce as traders awaited new indications regarding the extent of the Federal Reserve's impending interest rate reduction.
A Rate Cut Possibility By The Fed
The rate cut possibility is supported by the Fed's dovish remarks, which have highlighted growing labor market risks while conveying confidence that price growth will return to target. Furthermore, as precious metal lowers the potential cost of keeping non-interest-paying resources, US Federal Reserve (Fed) Chair Jerome Powell's remarks at the Jackson Hole symposium this past week, indicating that the "time has come" to begin reducing interest rates, could be favorable for the precious metal.
Data To Watch
According to CME FedWatch Tool, traders are estimating a 71% chance of a 25 bps reduction and a 29% likelihood of a more significant 50 bps cut in the expected September rate drilled.
Markets are also accounting for a 100 bps reduction in cuts overall for the rest of the fiscal year, which would reduce the potential cost of retaining non-interest-bearing property.
Elsewhere, heightened Middle East conflicts have consistently increased bullion's allure as a safe haven.
The focus will be on the Personal Consumption Expenditures (PCE) Price Index data and the initial US Gross Domestic Product (GDP) Annualized for the subsequent quarter (Q2), which are scheduled for release on Thursday and Friday, accordingly. Positive surprises could strengthen the US dollar (USD) and limit the increase in the price of gold denominated in USD.
Gold Price Prediction Technical Analysis
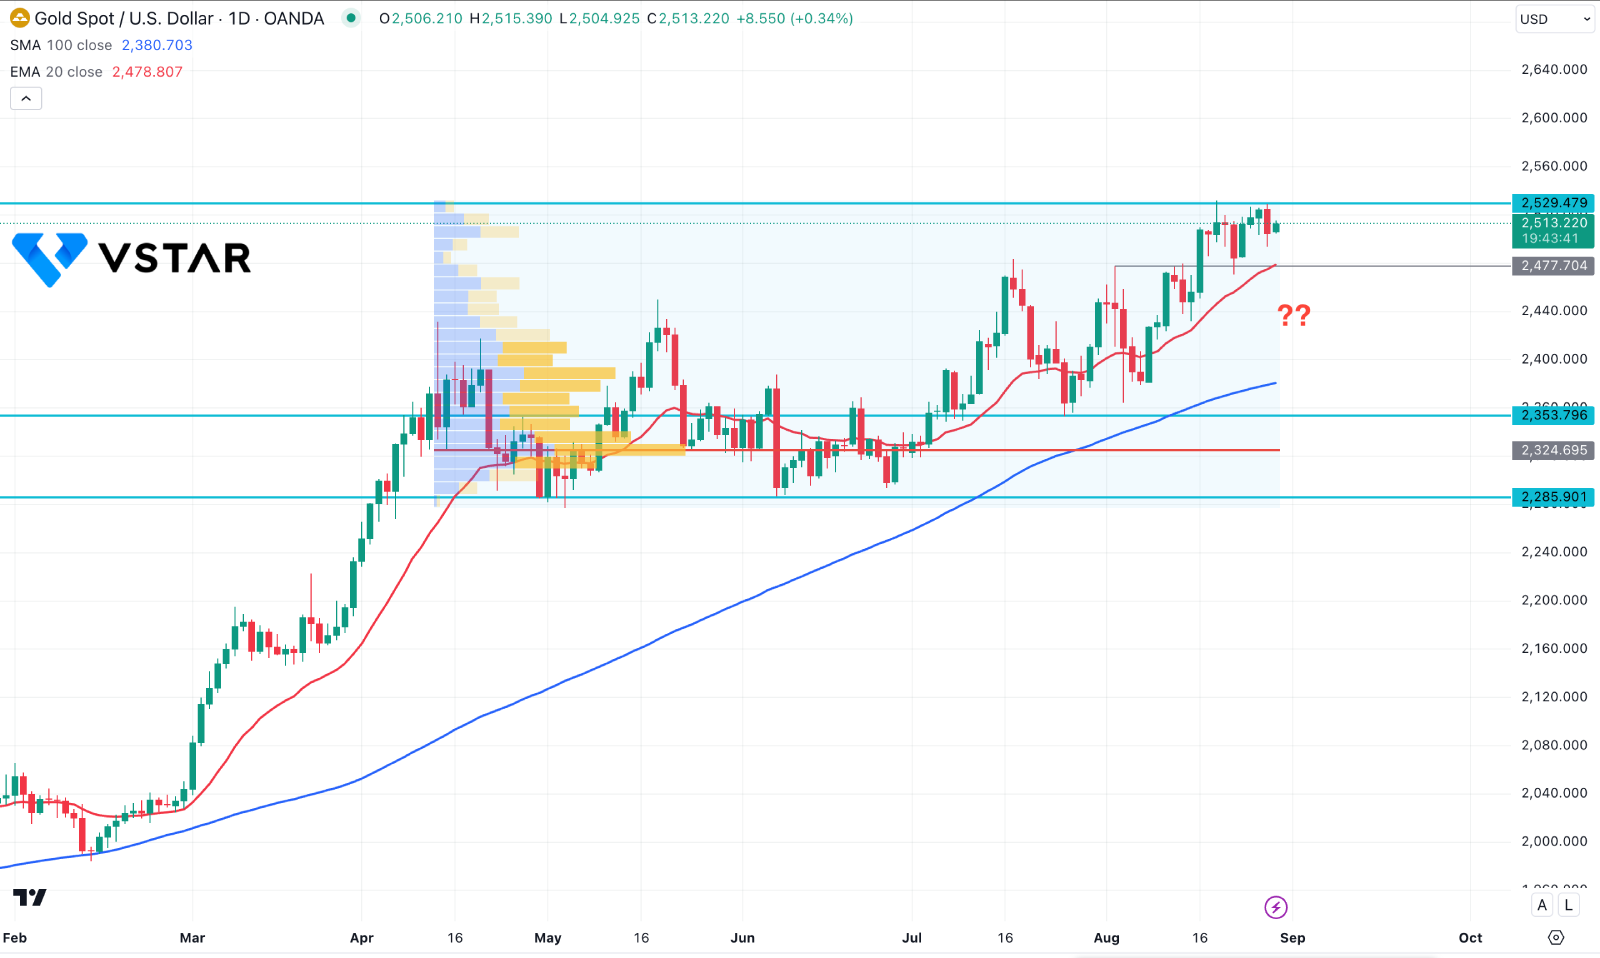
In the daily chart of XAUUSD, the current market momentum is bullish, with no sign of a downside recovery. Moreover, the ongoing uncertainty in geopolitics is an additional buying factor for this pair.
In the volume structure, the highest activity level since April 2024 is supporting the buying pressure. The exact high volume line is at the 2324.69 level, which is below the 2353.79 static support level.
In the main chart, the 100-day SMA and 50-day EMA are below the current price and working as near-term supports.
Based on the daily market outlook, the current gold price hovers at the all-time high level with no sign of a selling pressure. In this context, any bullish signal in the intraday chart could be a potential long signal, aiming for the 2600.00 psychological line.
On the other hand, investors might find a bearish opportunity if the price struggles to hold the momentum above the 50 day EMA line. A valid bearish daily candle below the 2477.00 support line might find support from the 100 day SMA line, before forming another long signal.