Chainlink price (LINK) has increased significantly recently, continuing the upward trend seen over the last few days. This upward trend highlights investor interest and is consistent with larger changes in the bitcoin market.
Growing trader confidence is reflected in the price increase of LINK, which is consistent with rises in other digital currencies. This increase highlights an upward trend in the cryptocurrency space as more investors get interested in its possibilities.
LINK On-chain Metrics Analysis
According to data from Into the Block, the LINK cryptocurrency's notable price fluctuation has impacted investor portfolios and market sentiment. Because of this volatility, 610.99 million LINK coins, worth $6.94 billion, have been categorized as being "In the Money," indicating successful holdings for most investors.
On the other hand, over 281.13 million LINK, valued at approximately $3.2 billion, are "Out of the Money," indicating possible losses for numerous investors. Of the tokens, 28.11% are in this section.
It is also noteworthy that, with 100% market coverage, just 10.79% of LINK tokens are " at the Money" or at breakeven. These dynamics show the continuous price swings in LINK and their possible influence on stakeholders' future investment choices and market tactics.
LINK Volume Structure
With the volume of daily profit-to-loss transactions at LINK, the ratio has risen to 5.986, which is the highest since July 14. Based on the current uptrend, short-term holders appear to be actively taking profits, as seen by the approximately six earnings transactions for each deficit transaction. The high ratio suggests that investors are securing profits as the market tests important levels by taking advantage of a notable price hike or relief rally.
The daily volume of on-chain transactions is divided by profit and loss. Even though the price of LINK is still rising in the market, this profit-taking pattern illustrates the prevailing attitudes among traders. The market is in a cautious state of anticipation as the token tests local supply at about $11.40. The careful balancing act between potential pullbacks and future gains is well-known to traders.
Investors will look for indications of a prolonged breakout or a possible reversal as LINK approaches this barrier. This is a pivotal moment for investors and traders alike, as the result could determine the direction of LINK's price movement in the days ahead.
Chainlink Price Prediction Technical Analysis

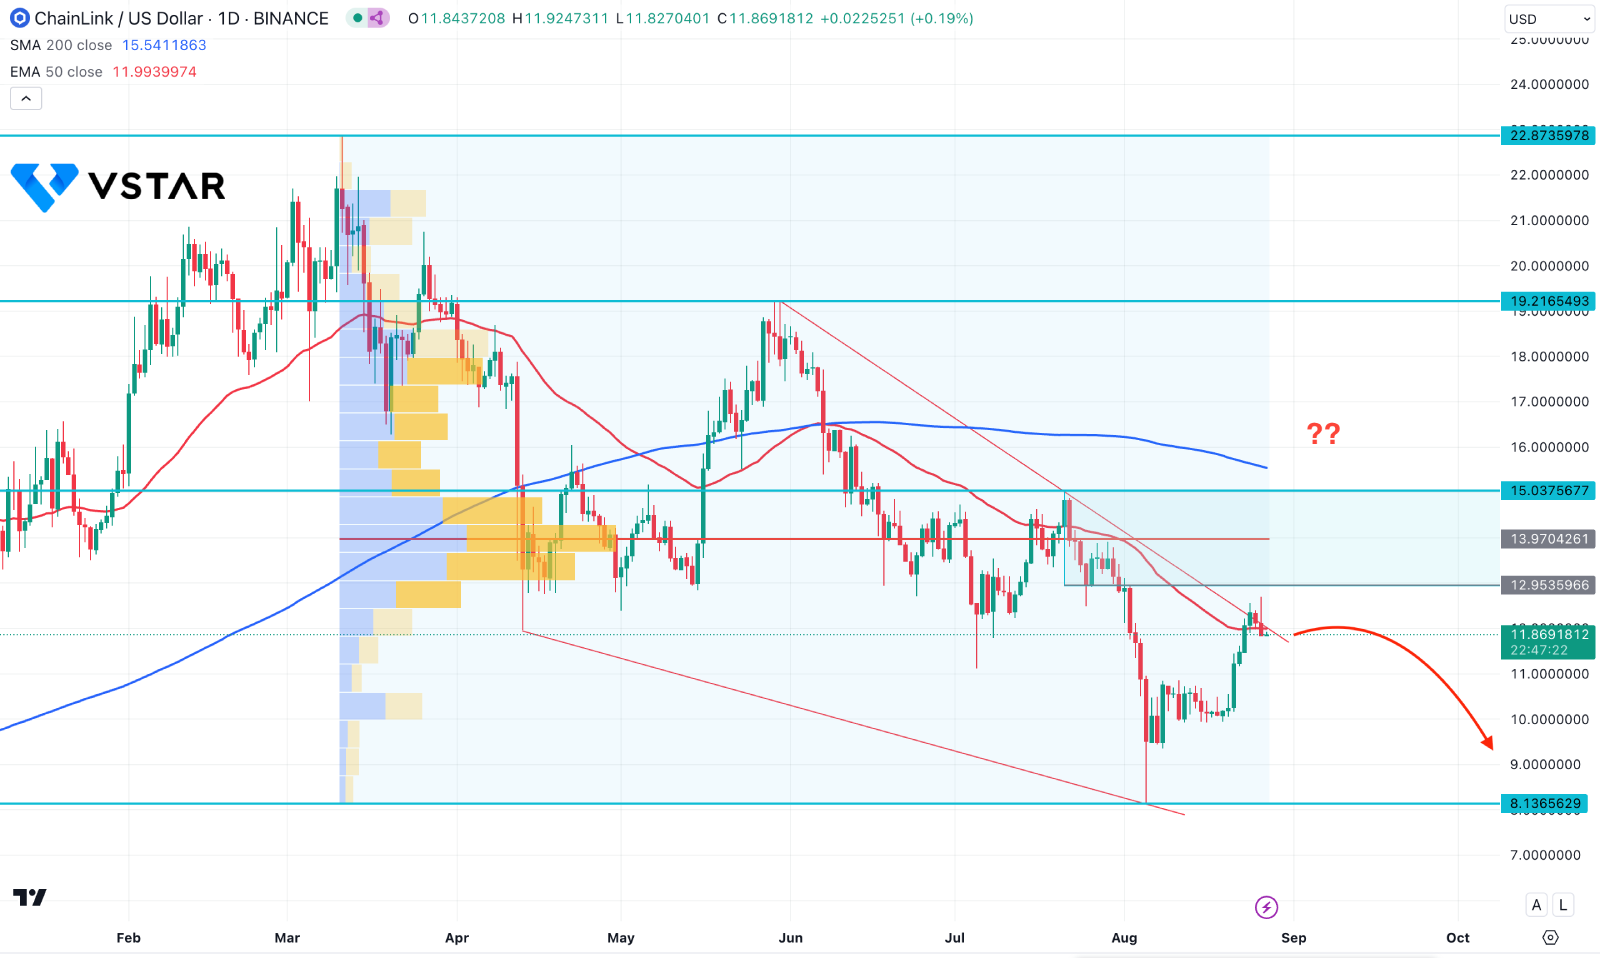
In the daily chart of Chainlink price, the current price hovers within a falling wedge pattern from where a valid bullish breakout is needed before anticipating a long-term wave. However, the most recent price struggles at the trendline resistance from where a decent downside recovery might come.
In the volume structure, the highest activity level is above the current price, signaling a bearish pressure. Moreover, the immediate supply zone indicates a pressure to sellers, signaling an additional bearish signal.
Based on the daily chart, a bullish break above the 200 day Simple Moving Average level could signal a bullish breakout, aiming for the 18.00 psychological line.
On the other hand, any bearish reversal from the 50 day EMA with a bearish daily candle could lower the price towards the 8.13 support level.


