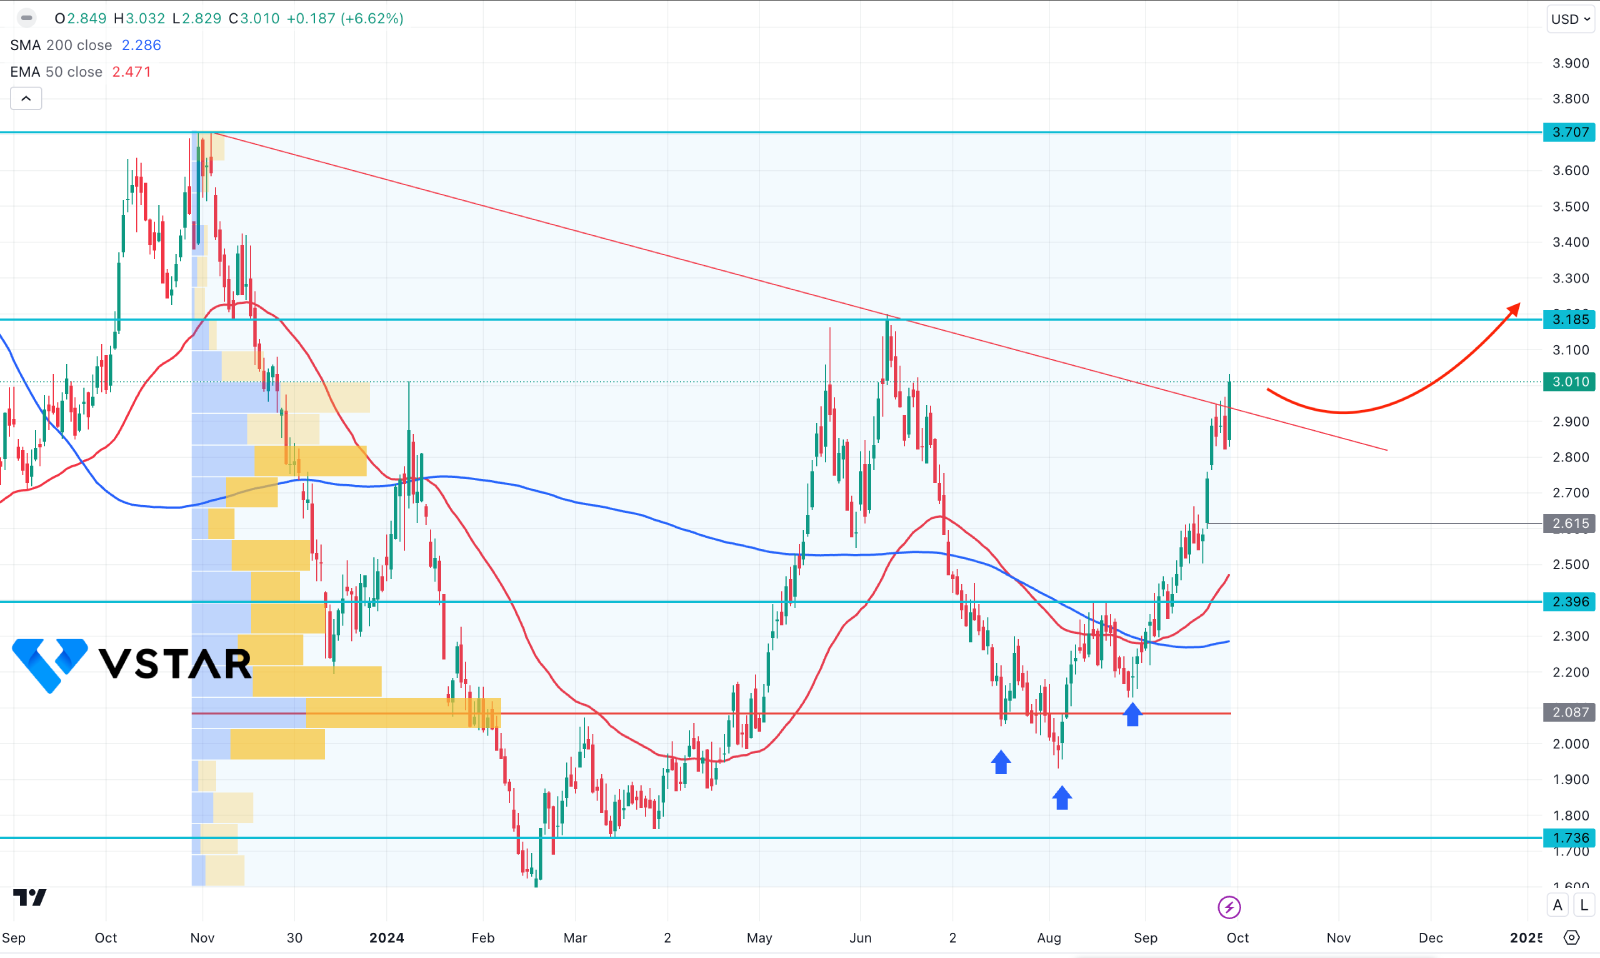
The Natural Gas (NG) price has jumped to a high of three and a half months, signaling a potential upward continuation. Moreover, weekly EIA natural gas stocks increased less than anticipated on Thursday, which provided carryover support for rising natural gas prices.
Additionally, the purchase of commodities funds helped to sustain the price of natural gas. Last Friday, the November natural gas contract became the leading edge month, which led dealers and hedgers to turn over their October natural gas holdings into the November contracts.
Natural Gas Demand From Output
Based on BNEF, lower-48 region dry gas output reached 100.2 bcf/day (-0.6% y/y). According to BNEF, the lower-48 state's demand for gas on Friday turned out 68.3 bcf/day (-1.7% y/y). According to BNEF, the total LNG flow to US LNG export facilities on Friday totaled 12.6 bcf/day (+1.9% w/w).
Utility companies' use for natural gas is positively impacted by a rise in US electricity production. The US power output for the 52 weeks ending September 21 increased by +1.66% y/y to 4,149,047 GWh (gigawatt hours), according to a report released by the Edison Electric Institute on Wednesday. The US output of electricity for the week ended September 21 increased by +9.23% y/y to 83,729 GWh (gigawatt hours).
Natural Gas Stocks' Movement On Higher NG Demand
With natural gas stocks rising by +47 bcf for the week ending September 20, significantly under the 5-year average rise of +88 bcf for this period of year and below estimates of +52, Thursday's every week EIA report was optimistic for nat-gas rates.
Natural gas stockpiles from September 20 were +4.1% y/y and +7.1% higher than their seasonal median over the previous five years, indicating abundant gas supplies. On the 22nd of September, gas storage in Europe was 94% full, higher than the typical seasonal level of 89% filled for this period of the year for the previous five years.
According to data released by Baker Hughes on Friday, there were 99 active natural gas drilling equipment in the US as of the weekend of September 27, an increase of +3 rigs from the 3-1/3 year low of 94 rigs from September 6. From reaching a five-year record of 166 rigs in September 2022—up from a record-low level of 68 rigs set during the pandemic era in July 2020—active rig counts have decreased (data since 1987).
Natural Gas (NG) Technical Analysis
In the daily chart of NG, ongoing buying pressure is seen. The current price is under extended upward pressure from the inverse Head and Shoulders breakout.

In the main chart, a bullish crossover is seen among the dynamic 50-day EMA and 200-day SMA, suggesting a Golden Cross formation. However, the gap between the current price and the high volume has extended, signaling a sufficient downside correction.
In this structure, investors should monitor how the price trades at the trendline area. As per the current reading, a bullish breakout is seen with a daily close, where now validation is visible whether it is a solid breakout or a trendline liquidity sweep.
The ideal buying approach would be to wait for a profit-taking opportunity and find long signals from the 2.700 to 2.396 zone. In that case, a high-probability long opportunity might appear, aiming for the 3.707 level.
On the bearish side, any immediate buying pressure with a struggle to overcome the 3.185 high could be a challenging factor for bulls, which might lower the price toward the 2.200 area.


