
The NZDUSD pair is losing momentum for the fourth day in a row, before this week's important economic reports, such as the Nonfarm Payrolls (NFP) and ISM Services PMI, which could provide hints about the scope of the Fed's possible interest rate cuts this month.
US Dollar Index (DXY) Outlook
The decline in Treasury yields is undermining the US currency. The current yield on US Treasury bills is 3.86% for 2-year notes and 3.83% for 10-year notes. However, the ISM Manufacturing PMI, which showed a minor increase from 46.8 in July to 47.2 in August, gave the Greenback more traction.
Technically, the US dollar index (USDX) reached its yearly low and created buying pressure. However, more clues are needed before validating the bottom and initiating a bull run to USD bulls.
RBNZ's Comment on Rate Decision
In the meantime, the ANZ Commodity Price Index in New Zealand increased by 2.1% in August, following a 1.7% decrease in July. Director of S&P Global Ratings Martin Foo voiced worries on Wednesday, pointing out that more narrowing of New Zealand's current account deficit is required. Although Foo expressed broad optimism regarding the country's sovereign rating outlook, he also pointed out the persistent difficulties in funding the current account deficit and the sluggish rate of economic growth.
China's Economic Outlook
Because of their close trading ties, China's Services PMI fell from 52.1 in July to 51.6 in August, further putting pressure on the New Zealand Dollar.
Furthermore, Bank of America (BoA) updated its estimate of China's economic growth in 2024, lowering it from 5.0% to 4.8%. Additionally, the growth estimate for 2026 remained at 4.5%, while the growth estimate for 2025 was cut to 4.5%.
NZDUSD Technical Analysis
In the daily chart of NZDUSD, sideways momentum is visible. The current monthly candle is trading bullish, with a possible close as an engulfing bar. Meanwhile, the price is under pressure from bulls taking profit after a long upside pressure, which could lower the price in the coming hours.
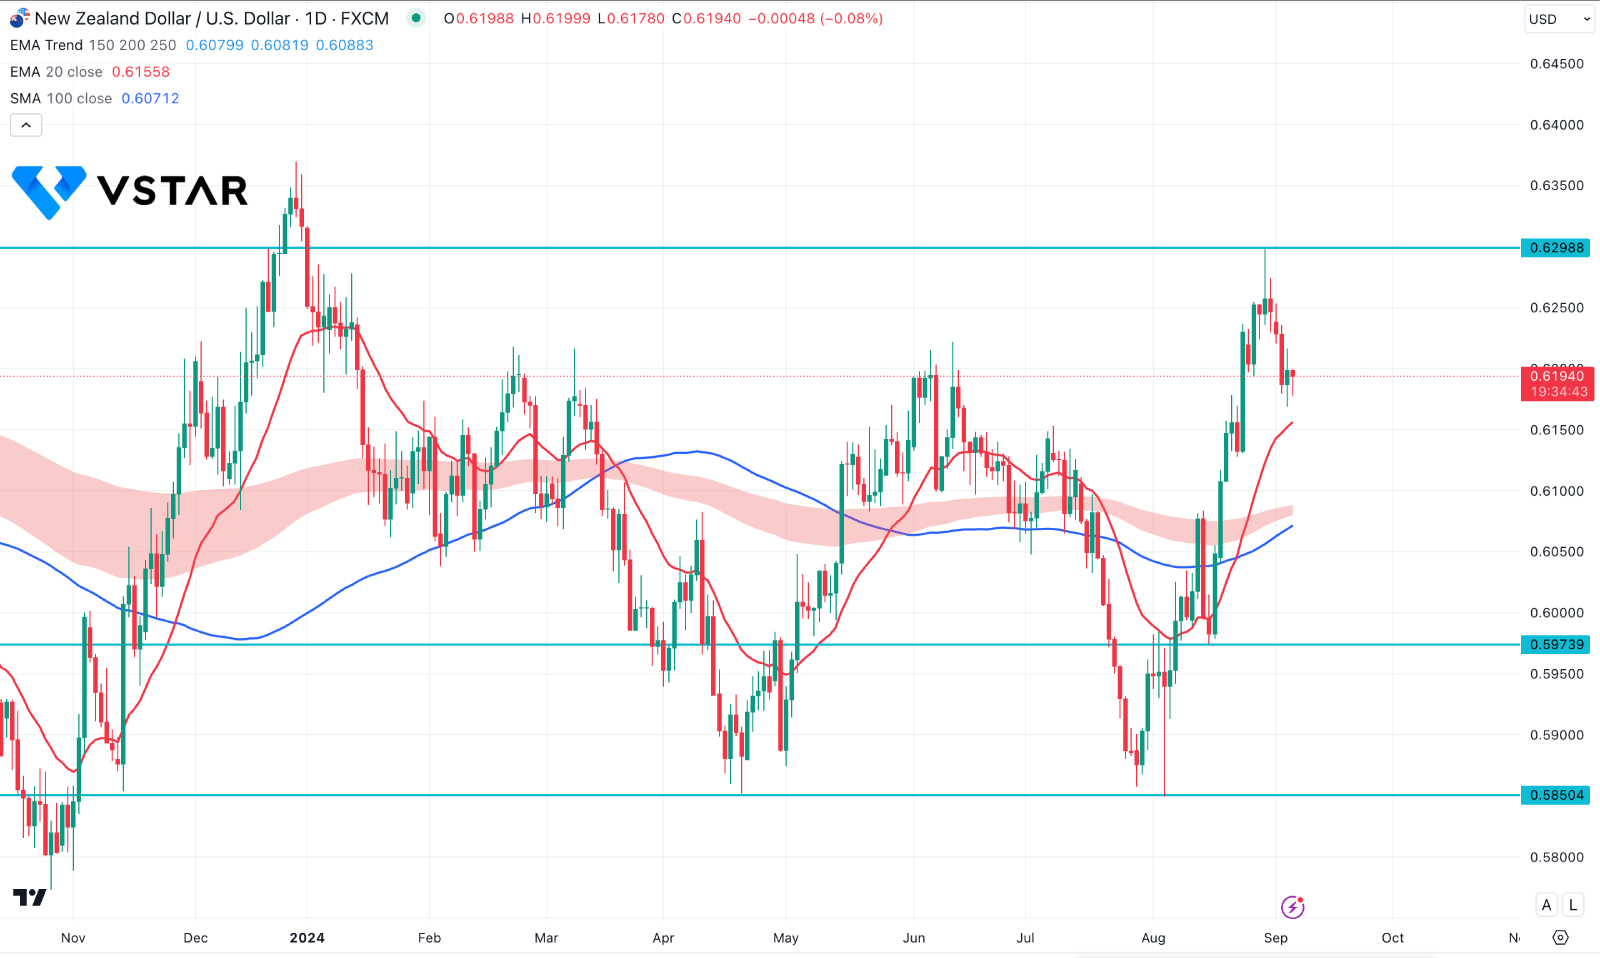
In the main chart, the 100-day Simple Moving Average is the major support, as the current price is hovering above this line. Moreover, the MA wave, consisting of EMA 150 to 250, is still working as a confluence support just above the 100-day SMA.
In this context, we may consider the buying pressure to come as long as the 100-day SMA is protected. However, the prolonged buying pressure with a bullish break of structure above 0.6221 signals a sufficient pending downside correction.
In this context, a valid bullish reversal from the MA wave zone could signal a bullish continuation opportunity, targeting the 0.6400 area.