Whenever you examine price charts, there's always a basic method for interpreting them. They can be either ranging or trending.
Ranging markets usually don't interest investors and traders because they can't tell where the price is going.
Conversely, trending periods are usually the best times to enter the market. The price moves in one direction for an extended period of time without much resistance.
Bullish vs Bearish
When the price moves up (uptrend), it is called a bullish market, but when it moves down (downtrend), it is called a bearish market.
Bulls and Bears
Bulls are positive and bullish while bears are negative and bearish on markets and asset prices. Their competing perspectives drive investment strategies and influence market dynamics.
Bull markets are characterized by optimism and confidence. Bear markets are dominated by pessimism and caution.
Bulls vs Bears: The competing outlooks and behaviors of bulls and bears drive market dynamics such as prices, volatility, trading activity and investor sentiment. Understanding the two mindsets is key for investors and traders.
Determining the type of market (bullish vs bearish) and understanding difference between bull and bear market is usually the first step in price analysis. You need to understand how it should influence your decisions and executions.
Understanding Bullish Markets
What is a bull market
One popular explanation is the symbolic way bulls (aggressive, muscular animals) attack their opponents. They typically use their horns to propel their opponents into the air, similar to the upward movement of the price.
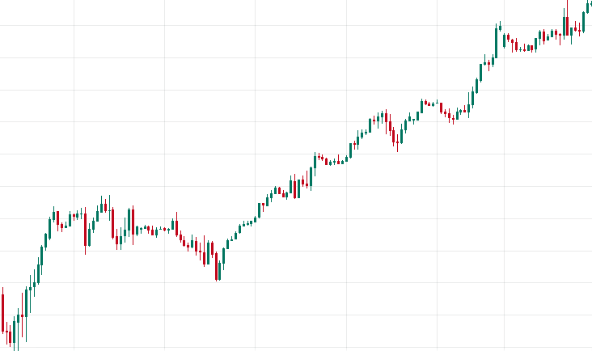
Below are examples of a bullish market in different asset classes:
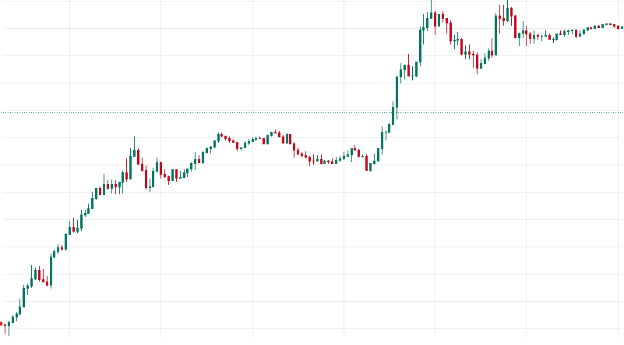
There may be retracements (temporary pullbacks) now and then. However, the price generally moves higher and easily breaks through resistance levels.
Characteristics of Bullish Market
As a trader, bullish market should be one of your most anticipated conditions for several reasons. They are relatively easy to spot on the charts and can last for long periods of time.
Such markets usually have the following characteristics:
Rising prices of assets or currency pairs
A bullish condition always means that the price of an underlying asset is rising. This can be a particular stock, some commodities, or equities.
They become more valuable as the price rises, which usually attracts investors.
However, it is a bit more complex with currency pairs in Forex.
A rising exchange rate means that the value of the quote currency is increasing in relation to the base currency.
For example, assume the exchange rate of USD/CAD is 1.34420.
1 US dollar will be worth 1.34 Canadian dollars. Hence, 100 US dollars will be equal to 134 Canadian dollars.
However, when the rate increases to 1.4187 in a bullish market, 1 US Dollar will cost 1.4187 Canadian dollars. Therefore, 100 US dollars will be worth 142 Canadian dollars.
The value of the US dollar is fixed against the Canadian dollar in this pair.
High Investor Confidence and Buying Activity
Usually, investors keep investing in a market when they are confident that a bullish condition will last. Such funding fuels the upward trend even more due to the increased demand for the assets and its steady or lower supply.
Positive economic reports are the main reason for the increased investor confidence.
For example, announcements of better GDP growth and lower inflation & unemployment rates are excellent for an economy. Investors will seek bullish market during the period, believing that they will be sustainable.
They won't worry about taking on more risk because of the potential for much greater gains.
You can detect the increased buying activity as higher volumes in the trading platforms.
Opportunity for Long Positions
As a beginner, you've probably heard that it's always best to trade with the trend. The chances of your trades being profitable are higher, and it's not hard to spot such runs.
Thus, bullish market provide the best opportunities to open long positions. Your buy orders will be placed at a lower price and held for a longer period of time until the price rises.
The positive economic factors and confident investors, as discussed, should back your hopes for higher prices.
However, you must always be aware of the potential risks involved in any trade.
No one can be 100 percent certain about the next price direction. Hence, always obey your risk management strategies.
Lower Volatility
Generally, bullish market tend to have the lowest volatility. This is a huge advantage for investors and traders who can relax knowing that large price swings won't fill their stop orders.
The main reasons for this are:
● The relatively stable economy
● Greater investor confidence
● Favorable monetary policy
However, this is not the case for some asset classes.
For example, commodities tend to be more volatile than currencies. Hence, you should expect more price fluctuations in such markets even when they are bullish.
Always follow your risk management rules for added security.
An Overview of Bearish Markets
A bearish market is the direct opposite of a bullish market.
It is a condition in which the price moves in a downtrend for an extended period of time, easily breaking through support levels.
The word "bearish" comes from the word "bear", partly because animals attack their prey/enemy with their face down, like the downward price movement.
However, people also link it to the middle ages when intermediaries, known as "bears," would sell the animals' skins even before receiving them from the trappers.
They would hope that the price would drop after the earlier agreement so that they can profit from the difference between the cost price and the selling price. This describes the desire to expect the price to go down in today's financial markets.
Bears definition: Bears are investors who are pessimistic about the markets and expect prices to fall.
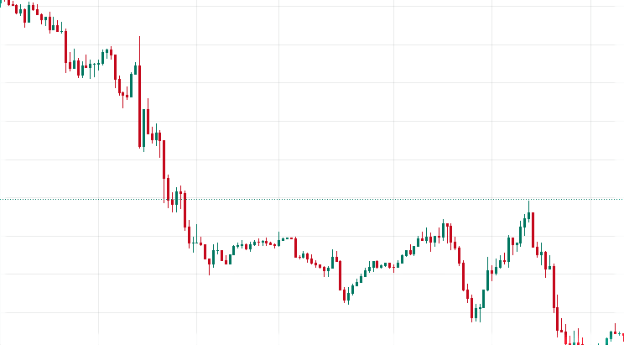
Below are examples of bearish conditions:
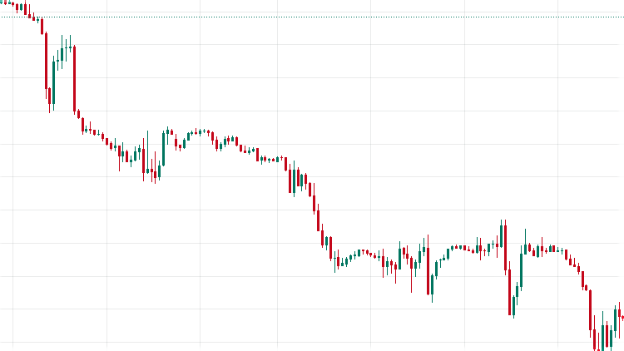
Even in long-term bearish markets, there are short- and intermediate-term retracements that you'll find mostly on the lower timeframes.
Characteristics of Bearish Markets
You can interpret bearish conditions in several ways, depending on the financial market and your trading method(s). However, the following are the most important characteristics you need to know.
Decreasing Prices of Assets or Currency Pairs
In a bearish market, a financial product, like equity, stock, or commodity, usually becomes less valuable.
Its price continues falling for an extended period of time, which is generally pessimistic for traders and investors.
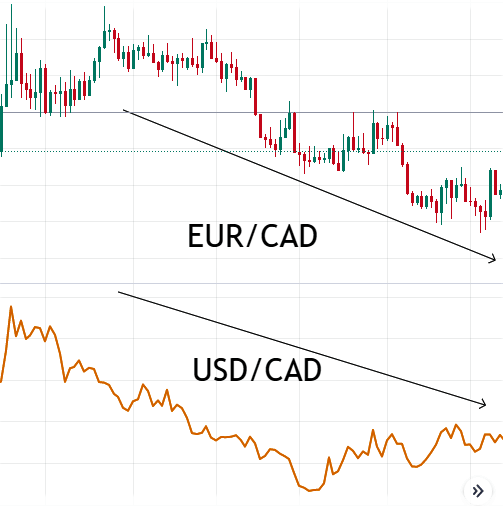
As discussed, due to the design of currency pairs, a bearish condition is mostly only negative for the quote currency. The base currency is always a constant value compared to it.
Therefore, when the exchange rate falls, the second currency in the pair usually feels the impact.
The bearish condition may still be present in other forex charts where such a currency is also in the quote position.
Weaker Economy
The state of a country's economy affects its financial markets. Therefore, if prices are falling (as seen in bearish conditions), the economy is likely to be in poor shape.
Economic indicators may indicate any of the following to confirm such weakness:
● Low GDP growth
● Rising unemployment
● Rising inflation
● Declining consumer spending
For example, the Consumer Price Index (CPI) provides insight into a country's inflation. It is the average change in the price of some goods and services over time.
Hence, an increasing CPI indicates higher inflation and vice-versa.
Interestingly, a weaker economy doesn't always result in falling prices for all currency pairs.
On the currency's index chart, the price may be falling. However, the exchange rate of a currency pair, if it is in the quote position, is likely to rise.
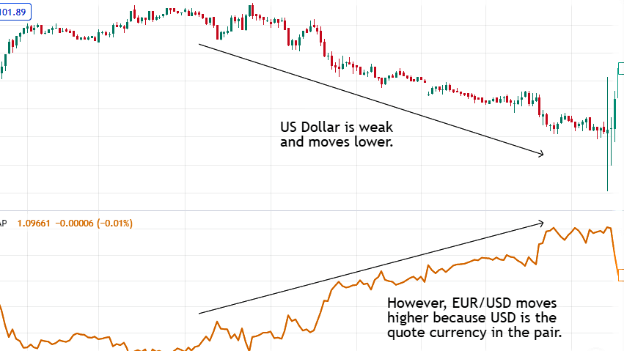
If it is the base currency, the prices will fall.
Low Investor Confidence and Selling Activity
The general sentiment is usually negative in a bearish market. Hence, investors will keep selling their assets, expecting the price to continue lower.
The willingness to sell their holdings weakens the affected market even more because there will be less demand.
Negative economic reports, as discussed earlier, are the primary driving force behind low investor confidence.
Markets move based on the strength of an economy. Thus, news suggesting its weakness never encourages more investments.
Some other factors leading to low investor confidence include:
● Political tensions, such as elections
● Unfortunate events, e.g., global pandemics
● Industry-related factors, like less production of crude oil impacting the commodity
Opportunity for Short Positions
As a CFD trader, bearish markets are the best periods to open short positions. The difference between your trade entry (above) and exit (below) should help you remain profitable.
However, be careful if you prefer to trade Forex CFDs.
When a weaker currency is in the quote position of a pair, the exchange rate may rise (not fall). On the contrary, it's okay to expect falling prices when it is the base currency.
Regardless, be careful and aware of the risk involved in CFD trading.
There's always a chance for the price to retrace above, even in a bearish market. Thus, calculate your risk tolerance and be prepared for possible unfavorable outcomes.
Identifying Bullish vs Bearish Markets
Expecting and profiting from trending conditions is one thing. Identifying them is another.
Beginners may struggle to identify bullish and bearish markets. However, there are several ways, depending on your preferred analysis method.
Technical Analysis Techniques for Identifying Market Trends
Technical analysis involves using charting tools to read the market. By understanding how the price has moved in the past, you can anticipate future movements.
Thus, these are popular ways to identify market trends:
Moving Average(s)
A Moving Average (MA) is a technical analysis indicator that calculates an asset's average price over a certain period. You can use it to identify market trends by comparing them to the current price.
For example, when the price is above the MA, it may indicate a bullish market.
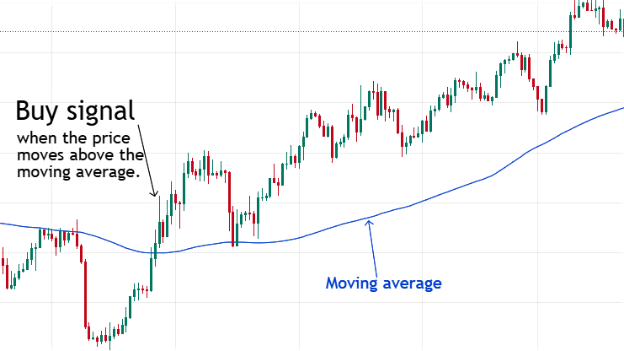
Conversely, when it is below it, it can indicate an upcoming downtrend.
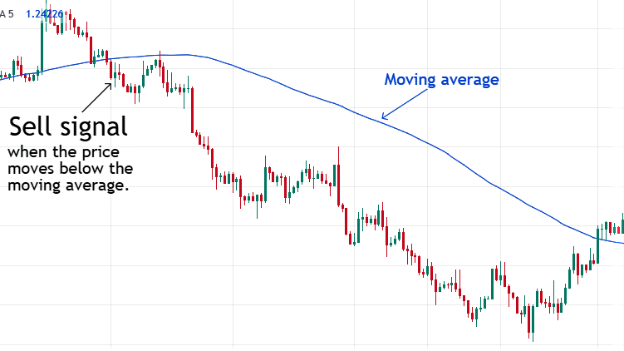
You can also use two Moving Averages of longer and shorter periods to identify the market.
Consider it a bullish signal if the shorter-term MA moves above the longer-term one.
However, when the shorter-term Moving Average crosses the longer-term MA below, it may signal a bearish market.
Relative Strength Index (RSI)
As a technical analyst, you may find the Relative Strength Index (RSI) useful in identifying price trends.
For example, when it is overbought (70-100), expect an upcoming bearish market. Conversely, you can treat it as a bullish signal when the RSI is oversold (0-30).
Another way traders use the RSI is to look for divergences between it and the market price.
When the RSI makes higher lows when the price makes lower lows, it can signify a bullish market. On the contrary, bearish conditions may be approaching when it makes lower highs while the price makes higher highs.
Price Action Trading
Instead of using indicators or oscillators, price action trading involves studying price movements with simple charting tools.
You can use any of the following methods to identify trends:
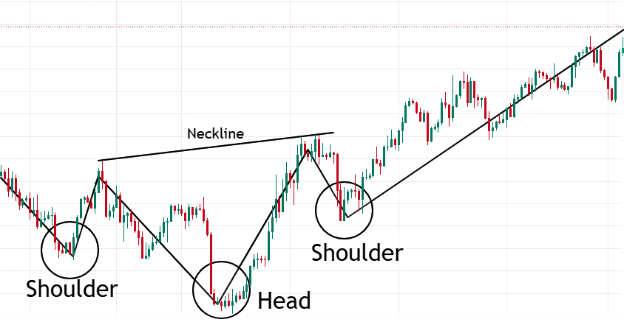
Finding chart patterns: Patterns like head and shoulders, double tops, and double bottoms signify possible trend reversals.
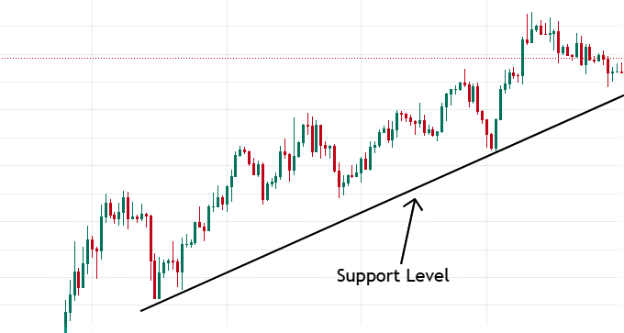
Drawing trend lines: You can draw diagonal lines to identify up or down trends. Uptrends will have higher highs and higher lows, while downtrends have lower lows and lower highs.
Seeking support & resistance levels: There are significant levels that the price respects on the charts. Thus, finding them may provide insights into trend reversals.
Fundamental Analysis Techniques for Identifying bullish vs bearish Market Trends
Fundamental analysis mostly requires studying real-life factors that affect the financial markets. Such conditions can cause increased volatility or rising or falling prices.
Hence, here are ways to identify market trends with them:
Analyzing Economic News and Data
Economic news reports are some of the best indicators of the overall strength of a country's economy.
They will influence the financial markets in several ways. Hence, staying up-to-date and understanding them helps you anticipate possible bullish or bearish periods.
For example, investors become less confident about the markets when a nation's GDP is lower than expected on its release. Most will look to sell their holdings as quickly as possible, resulting in a price decline.
You may have studied and anticipated this far earlier during the news release.

Economic calendars are essential for this.
Political News and Events
Like economic news, political events can influence market prices and force them into long-term trends.
They may be unexpected, like geopolitical disputes, or anticipated, like state or presidential elections. However, study how such events affect market sentiment (positive or negative) to determine the most likely trend.
For example, assume an election candidate who has always supported the need to use crude oil for a better economy wins. You can expect changes in government policies that will improve the oil industry.
Hence, the commodity's prices will likely increase over time.
Central Bank Announcements
Studying central bank announcements is essential to identify periods of possible price trends.
For example, one of their most important reports is the interest rates. They affect the markets in many ways, so learn from past data how they will affect the assets you are interested in.
In Forex, higher interest rates have generally strengthened currencies, while lower rates have weakened them.
On the contrary, existing bond and stock prices will fall when interest rates rise and vice versa.

The Importance of Identifying bearish vs bullish Market Trends Before Trading
Identifying market trends before trading shouldn't be a debate.
It is the first step in any analysis to help you make informed decisions. Otherwise, you run the risk of trading against the trend, which is highly criticized by experts.
Here are some more reasons why you should determine them on time:
- It provides information about market sentiment, which influences prices.
- It helps you identify the best entry and exit points for your trades.
- It helps you manage risk by avoiding trading against the trend.
Strategies for Trading Bullish vs Bearish Markets
Once you have identified a bullish or bearish market, what should you do next? How can you use the information to trade? Do you need to do any further analysis or calculations?
You can follow your trading plan after determining the market trend. However, below are some common market executions during bullish or bearish periods.
Strategy for Trading Bullish Market
Try to keep your decisions on the positive side of the market when it's bullish.
Like any trader, you may never know when the price will retrace or completely reverse. However, it is much safer to trade with the uptrend.
1. Long Positions
Generally, your market or limit orders during bullish conditions should focus on moving higher. You can look for entry techniques based on your trading plan and hope that the price fills your take profit.
Sometimes traders open short positions when they anticipate a significant pullback. However, they greatly reduce their risk by going against the underlying trend.
2. Protective Stop-loss Orders
The fact that it is a bullish market doesn't mean prices will smoothly move higher without retracing.
Occasionally, you will see retracements of different degrees. Hence, always have a protective stop-loss order on all your trades.
The order's position will depend on your risk tolerance.
3. Trailing Stop-loss Orders
In a bullish market, trailing stop-losses allow you to lock in profits and protect against retracements.
It seems more complex to set than a stop-loss order. Regardless, it is highly beneficial if you place it well.
As a general rule, set it at a position that guarantees you a decent profit, but allows the price to fluctuate reasonably.
Strategy for Trading Bearish Markets
1. Short Positions
In CFDs, your market or limit orders in a bearish market should be to "sell" the asset. It will be easier to profit from falling prices, especially if it is a long-term trend.
If you're an investor who owns an asset in a bearish market, try to sell it quickly. You never know how long the downtrend will last, so don't take the risk of holding on.
2. Protective Stop-loss Orders
Since you're taking sell trades on CFDs when it's bearish, make sure you protect them with the stop-loss orders mentioned above.
This is an essential risk management technique because bear markets are typically volatile.
Therefore, you may never be able to predict the length of a retracement, which can have serious consequences, especially in a small trading account.
3. Trailing Stop-loss Orders
You can also use trailing stop-loss for protection. It is most useful when you can't be there to manually adjust a stop-loss order.
It will protect your short positions from sudden pullbacks while maximizing profits when the price moves in your direction.


Final Thoughts
Bullish vs bearish markets are the best trading conditions because the price moves in one direction for a long time.
They aren't like a ranging market where there is uncertainty.
In a bullish environment, the price moves higher with ease. Conversely, when bearish, the price is in a prolonged downtrend.
By identifying the market trends, you can target your decisions to one side of the market to ensure profitable trades. Consider going long in an uptrend, but focus on opening short positions in a bullish market.
Also, implement risk management strategies such as placing stop-loss and trailing stop orders. Trends can retrace or reverse at any time.


