Toncoin bullish pressure is backed by multiple on-chain factors. Moreover, the rising upward pressure above crucial dynamic lines might offer a decent investment opportunity for traders.
Toncoin On-chain Metrics Analysis
The "90-day percentage return," which calculates the percentage variation in an asset's price over the previous ninety days, is the pertinent metric in this case. It usually provides information about the cryptocurrency's short-term pattern and momentum while tracking its performance over that time frame.
Records from CryptoQuant show that the Toncoin price's recent upward movement caused the TON 90-day percentage return to turn positive. In the past, when this indicator turned positive, the ensuing price movement typically had a lot of momentum.
Ultimately, this change in the 90-day percentage return indicates that investors are becoming more confident and inclined to keep their assets. Investors typically do this in anticipation of price hikes because they believe the bullish trend will continue.
The Quicktake analyst claims that the percentage shift in open interest is an additional on-chain indicator backing the bullish outlook. According to data from CryptoQuant, the on-chain metric is also currently positive, indicating that the current optimistic trend will continue.
TON Coin Whale Activity Analysis
Almost 72 percent of its overall addresses are profitable, indicating a bullish outlook for the market. The Toncoin whales, however, are taking significant action. According to data from IntoTheBlock, the number of TON big transactions has increased by 110% in the past day alone. This high-value trade order flow suggests that the market is very confident.
Additionally, the increase in whale activity will create more buying pressure, which is necessary to raise the price of TON above its breakout quantities and the present resistance. The rise in whale activity is consistent with the overall market turbulence, indicating that key players are setting up for Toncoin's next big move.
Toncoin Price Prediction Technical Analysis
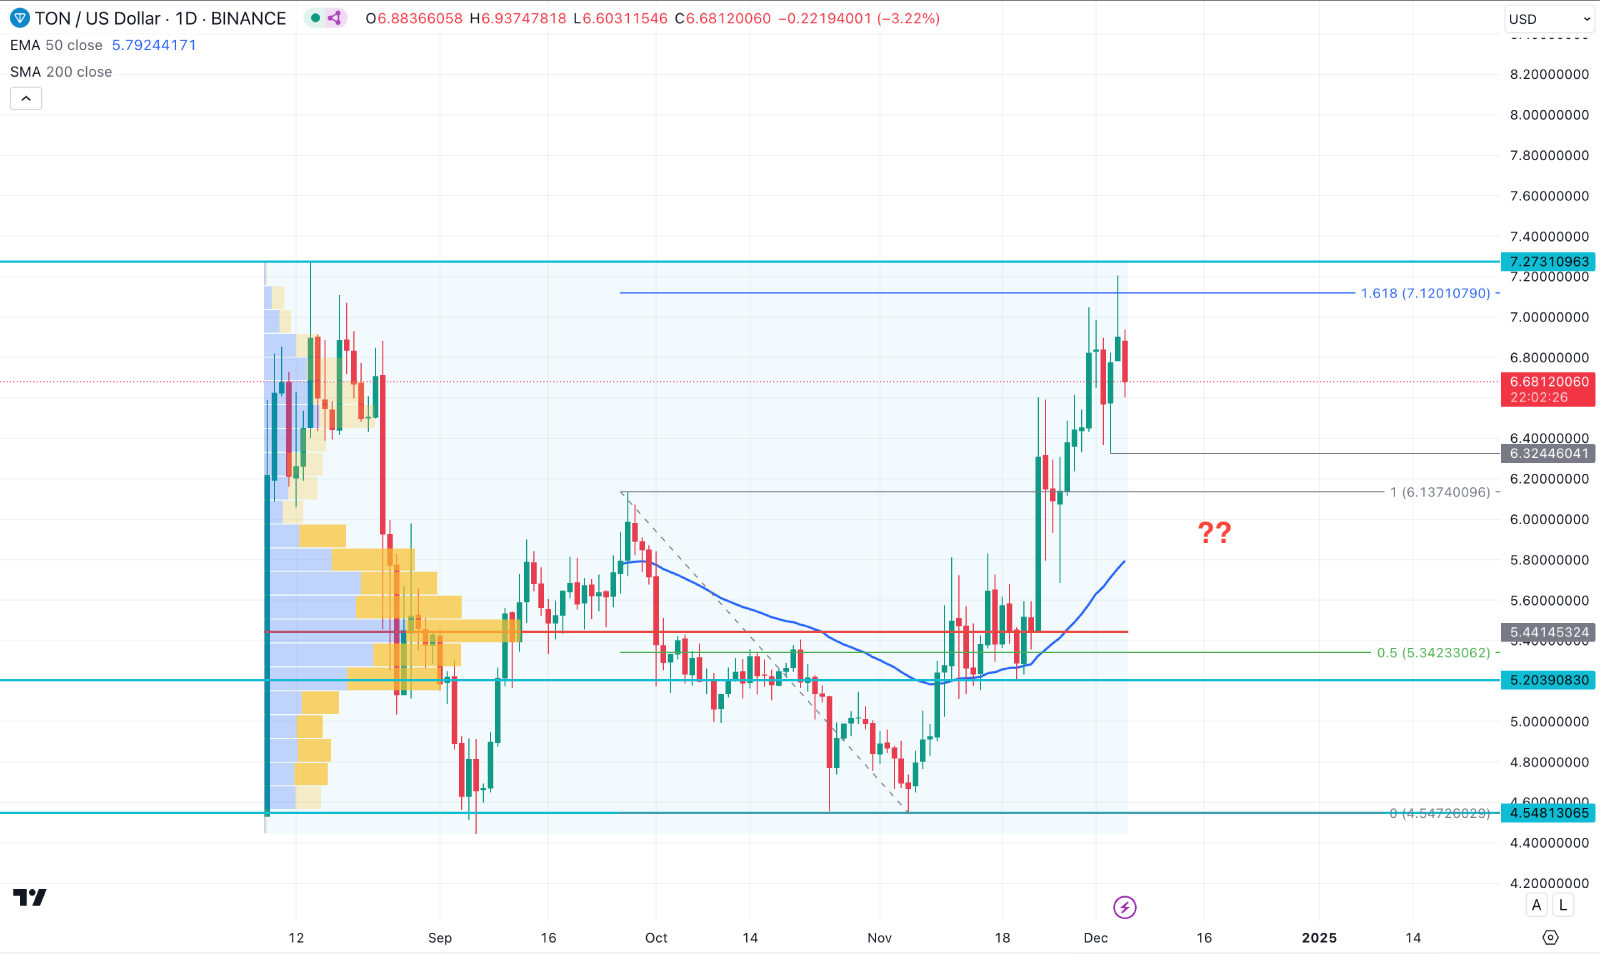
In the daily chart of TON coin price, the recent price showed a strong bullish recovery and reached the crucial all-time high area. However, the price became volatile, and instead of making a new swing high, it signaled a struggle for bulls.

The 50-day EMA line in the daily chart shows bullish market momentum. Moreover, the highest activity level since the beginning is at 5.441, which is also below the current price.
Based on the current market momentum, the higher volatility at the top with a price gap from the high volume line signals a possible downside correction in this pair. A bearish daily candle below the 6.320 support level could be a highly probable short opportunity in this pair, targeting the 5.441 level.
However, near-term price inefficiency is visible at the 5.674 to 5.580 zone, from which a strong bullish recovery could resume the existing bullish trend.


