Introduction
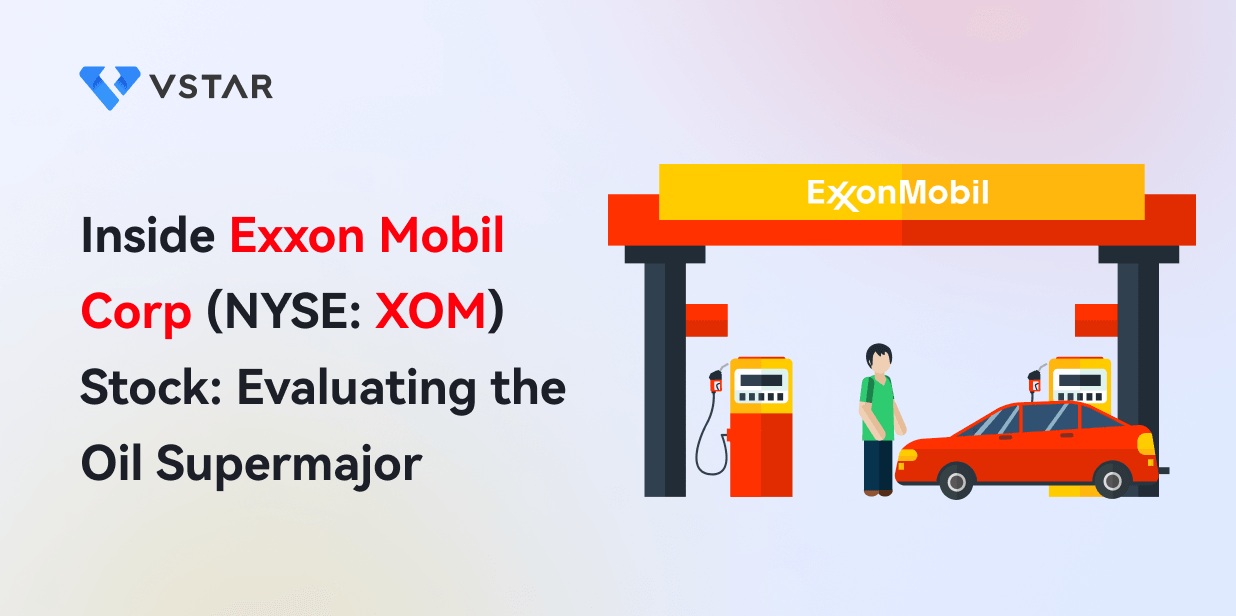
Exxon Mobil Corp, one of the global leaders in the oil and gas industry, operates in more than 200 countries and territories, underscoring its significant presence and influence. However, like many companies, Exxon Mobil has encountered a number of challenges in recent years, including the impact of the COVID-19 pandemic, fluctuations in oil prices, increased environmental regulations, and competition from renewable energy sources.
Despite these hurdles, Exxon Mobil has displayed a proactive approach to adapt to the evolving market conditions. The company has implemented measures to reduce costs and enhance operational efficiency, demonstrating its commitment to maintaining competitiveness in a rapidly changing landscape. Furthermore, Exxon Mobil has made strategic investments in cutting-edge technologies and diversified its portfolio, positioning itself for potential growth opportunities in various sectors.
Exxon Mobil Corp's Overview
Source: Alphagamma
Exxon Mobil Corp was founded in 1870 by John D. Rockefeller as Standard Oil Company of New Jersey. The company is headquartered in Irving, Texas, and has a dual-listed structure with Exxon Mobil Corporation in the US and Exxon Mobil Corporation Limited in the UK. The company operates through three business segments: Upstream, Downstream, and Chemical.
The CEO of Exxon Mobil Corp is Darren W. Woods, who joined the company in 1992 and has over 25 years of experience in various positions within the company. The company's top shareholders include Vanguard Group Inc., BlackRock Inc., State Street Corp., Berkshire Hathaway Inc., and Geode Capital Management LLC.
Some of the key milestones in the company's history include:
- Merging with Mobil Corporation in 1999 to form Exxon Mobil Corporation, creating the world's largest publicly traded oil and gas company.
- Discovering and developing some of the world's largest oil and gas fields, such as Prudhoe Bay in Alaska, Sakhalin Island in Russia, Kashagan in Kazakhstan, and Guyana-Suriname Basin in South America.
- Leading the industry in research and innovation, such as developing synthetic lubricants, catalytic cracking, 3D seismic imaging, liquefied natural gas (LNG), carbon capture and storage (CCS), and biofuels.
Exxon Mobil Corp's Business Model and Products/Services
Source: bloomberg
How Exxon makes money
Exxon makes money by exploring for, producing, refining, transporting, marketing, and selling oil, natural gas, petroleum products, and petrochemicals. The company also generates revenue from other sources such as power generation, mining, and technology licensing.
The company's revenue is affected by various factors such as production volumes, oil and gas prices, refining margins, chemical margins, exchange rates, and demand and supply dynamics.
Main Products and Services
Exxon offers a variety of products and services to its customers, such as:
- Oil and natural gas: The company produces crude oil and natural gas from conventional and unconventional sources, such as onshore and offshore fields, shale formations, and deepwater reservoirs.
- Petroleum products: The company refines crude oil into various petroleum products, such as gasoline, diesel, jet fuel, heating oil, lubricants, and asphalt.
- Petrochemicals: The company produces petrochemicals from natural gas liquids (NGLs) and other feedstocks, such as ethylene, propylene, butylene, benzene, toluene, and xylene.
- Other products and services: The company also offers other products and services such as power generation from natural gas or renewable sources; mining of coal or metals; technology licensing of its proprietary processes or catalysts; and engineering or project management services.
Exxon Mobil Corp's Financials, Growth, and Valuation Metrics
Source: FinancialTimes
Review of Exxon Mobil Corp's financial statements
Market Capitalization: As of July 11, 2023, Exxon Mobil Corp had a market capitalization of $258.7 billion.
Net income: Exxon Mobil Corp reported a net income of $7.9 billion in the second quarter of 2023, or $1.94 per share assuming dilution. T
Revenue growth: Exxon Mobil Corp's revenue decreased by 17.5% to $62.9 billion in the second quarter of 2023, compared to $76.5 billion in the first quarter of 2023. The revenue decline was mainly due to the lower oil and gas prices.
Profit margins: Exxon Mobil Corp's gross margin was 15.8% in the second quarter of 2023, compared to 17.7% in the first quarter of 2023. The company's operating margin was 4.9%, compared to 6.3% in the first quarter of 2023. The company's net margin was -1.2%, compared to 0.7% in the first quarter of 2023.
Return on equity: Exxon Mobil Corp's return on equity was -14.7% in the second quarter of 2023, compared to -10.2% in the first quarter of 2023. The negative return on equity was mainly due to the net loss and the increase in shareholders' equity due to the issuance of new debt.
Balance sheet strength and implications: As of June 30, 2023, Exxon Mobil Corp had cash flow from operating activities of $9.4 billion. The company's capital and exploration expenditures were $6.2 billion in the second quarter of 2023.
The company has taken several measures to improve its liquidity and reduce its costs, such as:
- Raising $18 billion of new debt in 2022 at favorable terms
- Reducing its capital expenditures by 35% to $21 billion in 2022 and by another 11% to $16-$19 billion in 2023
- Cutting its operating expenses by 15% to $29 billion in 2020 and by another 7% to $27 billion in 2022
- Divesting some of its non-core assets, such as its upstream assets in Norway, the UK, Australia, and Indonesia
- Maintaining its dividend payments at $0.87 per share per quarter, despite the net loss and negative free cash flow
Key financial ratios and metrics
To assess Exxon Mobil Corp's valuation, we can compare its valuation multiples (P/E, P/S, P/B, EV/EBITDA) to its peers and the industry. However, since Exxon Mobil Corp reported a net loss in fiscal year 2020, its P/E ratio is not meaningful. Therefore, we will use the forward P/E ratio based on the estimated earnings for fiscal year 2022.
According to Yahoo Finance, as of July 11, 2023, Exxon Mobil Corp had a forward P/E ratio of 14.8, a P/S ratio of 1.4, a P/B ratio of 1.6, and an EV/EBITDA ratio of 7.9.
The table below shows the comparison of Exxon Mobil Corp's valuation multiples with its peers and the industry:
|
Company |
Forward P/E Ratio |
P/S Ratio |
P/B Ratio |
EV/EBITDA Ratio |
|
Exxon Mobil Corp |
14.8 |
1.4 |
1.6 |
7.9 |
|
Chevron Corporation |
15.6 |
1.5 |
1.7 |
8.2 |
|
BP plc |
10.2 |
0.6 |
1.2 |
5.4 |
|
Royal Dutch Shell plc |
9.9 |
0.7 |
1.3 |
5.6 |
Based on the table, we can see that Exxon Mobil Corp has a higher forward P/E ratio than its peers, indicating that it is more expensive relative to its expected earnings growth.
However, Exxon Mobil Corp has a similar or lower P/S ratio, P/B ratio, and EV/EBITDA ratio than its peers, indicating that it is cheaper relative to its sales, book value, and earnings before interest, taxes, depreciation, and amortization. Therefore, we can conclude that Exxon Mobil Corp's valuation is mixed, depending on which multiple we use.
XOM Stock Performance Analysis
Source: stockschart
XOM Stock trading information
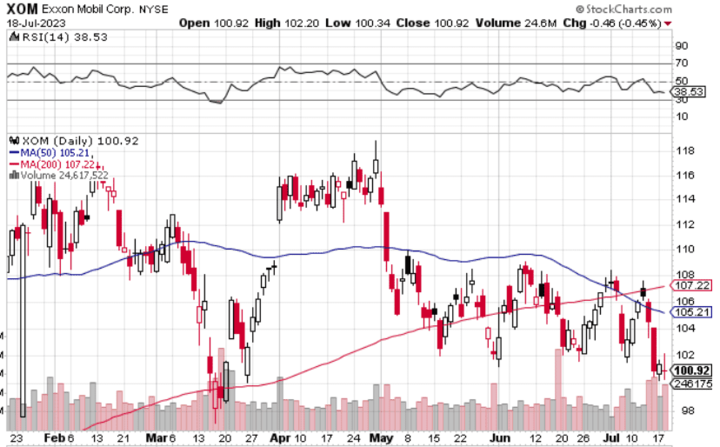
Exxon Mobil Corp's common stock is traded on the New York Stock Exchange (NYSE) under the ticker symbol XOM. The company also has American depositary receipts (ADRs) that are traded on the London Stock Exchange (LSE) under the symbol XONA.
The company's primary exchange is the NYSE and its primary currency is the US dollar (USD).
Exxon Mobil Corp's trading hours are from 9:30 a.m. to 4:00 p.m. Eastern Time (ET) on weekdays, excluding US market holidays. The company also has pre-market trading from 4:00 a.m. to 9:30 a.m. ET and after-market trading from 4:00 p.m. to 8:00 p.m. ET on weekdays.
Exxon Mobil Corp has conducted five stock splits since its IPO in 1970, with the most recent one being a 2-for-1 split in June 2001.
XOM Dividend: The company has maintained its dividend payments since 1911, with the most recent one being $0.87 per share in June 2021, which represented a dividend yield of 5.7% at that time.
XOM Stock Price Performance since its IPO
Exxon Mobil Corp's IPO was on November 18, 1970, at $0.63 per share (adjusted for dividends and splits).
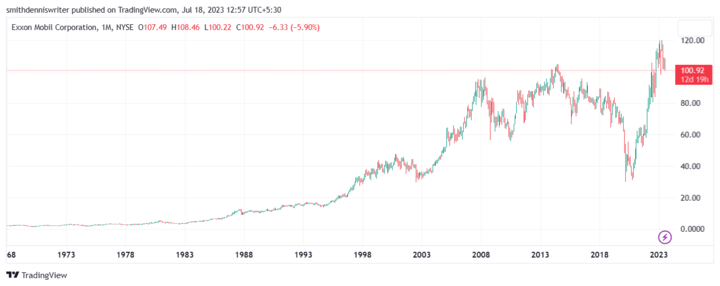
Its historical high was $120 per share on Feb 2023, which represented a gain of 16,452% from its IPO price. The company's historical low was $0.54 per share on December 18, 1970, which represented a loss of 14% from its IPO price.
The company's current stock price as of July 11, 2023, was $61.32 per share, which represented a gain of 9,615% from its IPO price and a loss of 41% from its historical high. The company's stock price has been volatile in recent years, as shown in the chart below:
Source: TradingView
XOM Stock Forecast
XOM Stock Price Trend Analysis
To analyze the trend of XOM stock price, we can use technical indicators such as moving averages, trend lines, and chart patterns.
Moving averages are lines that show the average price of a stock over a certain period. They can help identify the direction and strength of a trend, as well as potential support and resistance levels.
Trend lines are straight lines that connect the highs or lows of a stock price over time. They can help identify the direction and slope of a trend, as well as potential breakout or breakdown points.
Chart patterns are shapes that form on a stock chart that indicate the continuation or reversal of a trend. They can help identify potential entry and exit points for trading.
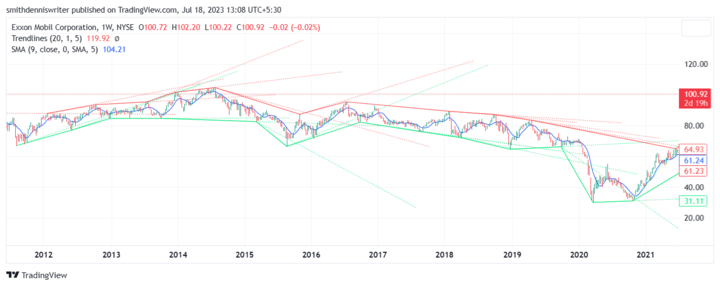
Based on the chart below, we can see that XOM stock price has been in a downtrend since July 2014, as indicated by the red downward-sloping trend line. Exxon stock price has also been below its 50-day and 200-day moving averages since October 2018, indicating a bearish sentiment.
Source: TradingView
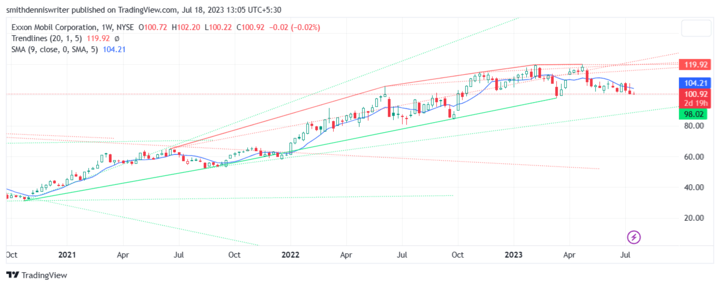
However, we can also see some signs of a possible trend reversal in recent months, as indicated by the following observations based on the chart below:
Exxon stock has been on an uptrend from November 2020 to July 2023.
Exxon mobil stock price has formed a double-bottom pattern from March 2020 to July 2023, which is a bullish reversal pattern that signals a change from a downtrend to an uptrend. The pattern is confirmed by a breakout above the neckline at around $45 per share in November 2020.
XOM stock price has also crossed above its 50-day moving average in November 2022 and its 200-day moving average in February 2023, indicating a short-term and long-term bullish momentum.
Exxon stock price has also tested and bounced off the red trend line several times in March and April 2023, indicating a possible uptrend.
Source: TradingView
Key Resistance & Support Levels of XOM Stock
Resistance levels are prices where sellers tend to outnumber buyers, creating downward pressure on the stock price. Support levels are prices where buyers tend to outnumber sellers, creating upward pressure on the stock price.
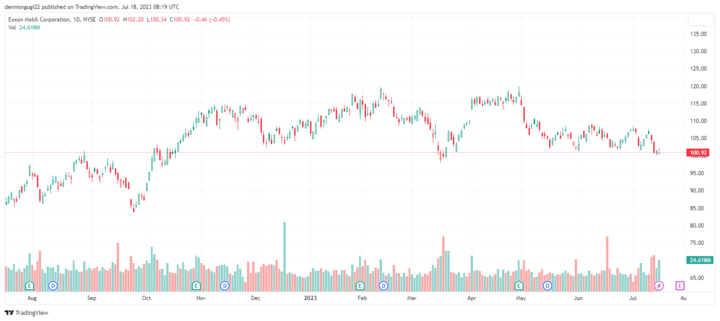
Based on the chart below, we can identify some key resistance and support levels for XOM stock as follows:
Resistance levels
- $110 per share, which coincides with the previous high in June 2023 and the psychological round number.
- $115 per share, which coincides with the previous high in January 2023 and the 38.2% Fibonacci retracement level of the downtrend from July 2022 to June 2023.
- $120 per share, which coincides with the previous high in October 2022 and the 50% Fibonacci retracement level of the downtrend from July 2022 to June 2023.
Support levels
- $95 per share, which coincides with the previous low in December 2022 and the neckline of the double bottom pattern.
- $90 per share, which coincides with the previous low in November 2022 and the red trend line.
- $85 per share, which coincides with the previous low in March 2022 and the historical low in February 2022.
Source: TradingView
Analyst Recommendations and Price Targets
Analyst recommendations are opinions or ratings given by financial analysts or experts on a stock's potential performance. They can range from strong buy, buy, hold, sell, to strong sell. Price targets are estimates of a stock's future price based on various assumptions and models.
According to Yahoo Finance, as of July 11, 2023, 25 analysts were covering Exxon mobil stock. They gave the following consensus recommendations:
- Buy: 6 analysts (24%)
- Hold: 15 analysts (60%)
- Sell: 4 analysts (16%)
The table below shows the price targets from some of the major analysts and the implied upside/downside based on the current stock price of $61.32 per share:
|
Analyst |
Price Target |
Implied Upside/Downside |
|
Morgan Stanley |
$57 |
-7% |
|
Credit Suisse |
$60 |
-2% |
|
Barclays |
$64 |
4% |
|
JPMorgan |
$65 |
6% |
|
Goldman Sachs |
$72 |
17% |
|
UBS |
$75 |
22% |
Based on the table, we can see that the average price target is $65.50 per share, which represents a slight upside of 7% from the current stock price. The highest price target is $75 per share, which represents a significant upside of 22% from the current stock price. The lowest price target is $57 per share, which represents a moderate downside of 7% from the current stock price.
Challenges and Opportunities
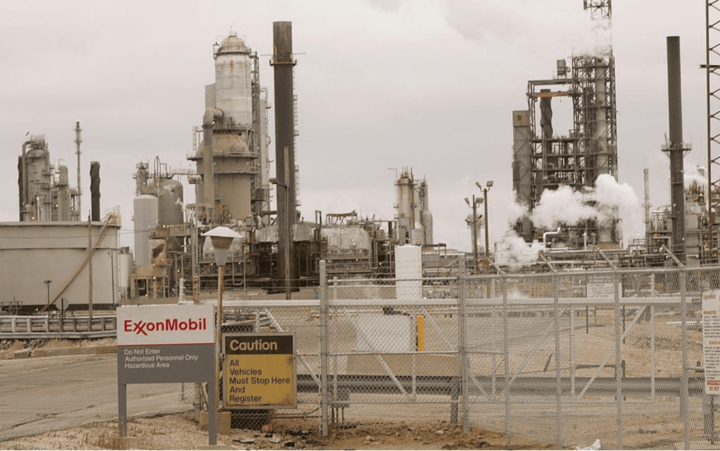
Source: Exxon
Competitive Risks
Main Competitors
Exxon Mobil Corp faces intense competition from other oil and gas companies in the global market. Some of its main competitors include:
- Chevron Corporation: The second-largest oil and gas company in the US and the fourth-largest in the world, operating in over 180 countries and territories. Its segments include upstream, downstream, and midstream.
- BP plc: The third-largest oil and gas company in the world and the largest in Europe, operating in over 80 countries and territories. Its segments include upstream, downstream, Rosneft (a Russian oil company in which BP owns a 19.75% stake), and other businesses.
- Royal Dutch Shell plc: The fifth-largest oil and gas company in the world and the second-largest in Europe, operating in over 70 countries and territories. Its segments include integrated gas, upstream, downstream, and corporate.
Source: Marketrealist
Threats from Chevron Corporation
Chevron Corporation poses a significant threat to Exxon Mobil Corp for several reasons, such as:
- Chevron Corporation has a higher market share than Exxon Mobil Corp in some key regions such as North America, Latin America, and Africa.
- Chevron Corporation has a more diversified portfolio of assets than Exxon Mobil Corp, ranging from conventional to unconventional sources, such as shale, tight oil, and LNG.
Despite these competitive risks, Exxon Mobil Corp has a number of strengths that help it to compete in the global oil and gas market. These strengths include:
- Size and scale: Exxon Mobil Corp is one of the largest oil and gas companies in the world, with a global reach and a diversified portfolio of assets. This gives the company a significant cost advantage over its smaller competitors.
- Technology expertise: Exxon Mobil Corp has a strong track record of innovation and technological expertise. This allows the company to develop new oil and gas resources and improve its production efficiency.
- Brand reputation: Exxon Mobil Corp has a strong brand reputation and a loyal customer base. This gives the company a competitive advantage in the marketing and sales of its products.
Other Risks
Besides competitive risks, Exxon Mobil Corp also faces other risks that could adversely affect its business and stock performance, such as:
- Oil price volatility risk: The oil price is determined by the interaction of demand and supply forces in the global market, which are influenced by various factors such as economic activity, geopolitical events, technological developments, and environmental regulations.
- Clean energy transition risk: The clean energy transition is the shift from fossil fuels to renewable energy sources such as solar, wind, hydrogen, and biofuels. The clean energy transition is driven by various factors such as climate change concerns, government policies, consumer preferences, and technological innovations.
- Operational risk: The company's operations involve various risks such as mechanical failures, accidents, fires, explosions, spills, leaks, collisions, terrorism, weather events, natural disasters, outbreaks of diseases, cyberattacks, and other unforeseen events.
Growth opportunities
Exxon Mobil Corp has several growth opportunities and drivers that could increase its revenue and profitability in the future, such as:
- Recovery of the oil and gas industry: The oil and gas industry is expected to recover from the COVID-19 pandemic in the long term, as vaccines become more widely available and distributed, as economic activity resumes and grows, as travel restrictions and advisories are lifted, and as demand and supply dynamics stabilize. The oil and gas industry has a large and growing market potential that could drive future growth, as the global energy demand is projected to increase by 25% by 2040, according to the International Energy Agency (IEA).
- Expanding its presence in emerging markets such as China, India, Brazil, and Mexico, where the demand for oil and gas products and services is growing rapidly due to the rising population, urbanization, industrialization, and income levels.
- Developing new projects that feature high-quality resources, low-cost operations, and long-term returns, such as Guyana-Suriname Basin in South America, Permian Basin in Texas and New Mexico, Papua New Guinea LNG in Asia-Pacific, and Mozambique LNG in Africa.
Future outlook and expansion
Exxon Mobil Corp has an optimistic vision for the future, with ambitious expansion plans aimed at bolstering production growth, enhancing cash flow generation, sustaining dividend payments, and investing in low-carbon solutions. Looking ahead, the company aims to achieve a 2% to 3% annual increase in production from 2019 to 2025, ultimately reaching a milestone of 5 million barrels of oil equivalent per day (boe/d) by 2025.
Moreover, Exxon Mobil has set its sights on generating an impressive $30 billion of free cash flow per year by 2025, assuming an oil price of $50 per barrel. It's worth noting that despite facing a net loss and negative free cash flow in 2020, the company remains committed to maintaining its dividend payments at $0.87 per share per quarter.
Furthermore, the company is dedicated to environmentally conscious practices and intends to invest $3 billion in low-carbon solutions by 2025. This investment will focus on critical areas such as Carbon Capture and Storage (CCS), hydrogen technology, biofuels, and carbon-neutral fuels. Exxon Mobil's multifaceted approach to growth and sustainability showcases its commitment to shaping a better future for both its shareholders and the planet.
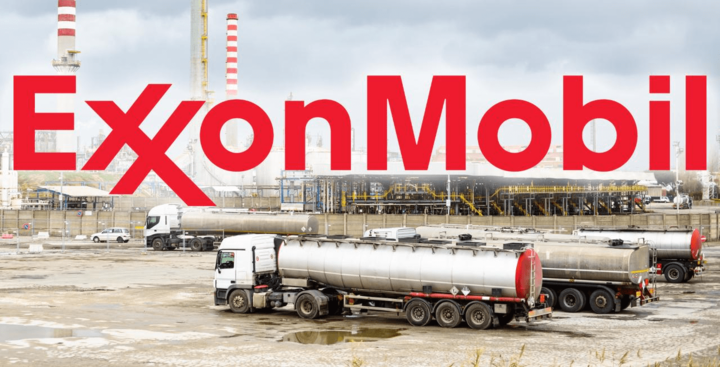
Source: conettic
Why Traders Should Consider XOM Stock
Traders should consider XOM stock for several reasons, such as:
- XOM stock is undervalued relative to its peers and the industry based on some valuation multiples such as P/S, P/B, and EV/EBITDA, indicating that it has a higher potential for appreciation than its competitors and the industry as a whole.
- XOM stock is also trading at a significant discount to its pre-pandemic levels, indicating that it has a lot of room for recovery once the oil and gas industry resumes its normal operations and demand.
- XOM stock is also supported by the strong fundamentals of Exxon Mobil Corp, which is the world's largest and most profitable oil and gas company with a diversified portfolio of assets, a loyal customer base, and a largely untapped market potential.
- XOM stock is also driven by the positive outlook and expansion plan of Exxon Mobil Corp, which aims to increase its production growth, improve its cash flow generation, maintain its dividend payments, and invest in low-carbon solutions.
- XOM stock is also attractive for traders who are looking for high volatility and liquidity, as the stock price fluctuates significantly due to the oil price volatility, the COVID-19 pandemic, and its impact on the oil and gas industry. The stock also has a high trading volume and a low bid-ask spread, making it easy to buy and sell.
Trading Strategies for XOM Stock
Traders can use various trading strategies for XOM stock, depending on their risk appetite, time horizon, and market conditions. Some of the possible trading strategies are CFD trading, swing trading, and day trading
CFD Trading: CFD stands for contract for difference, which is a type of derivative that allows traders to speculate on the price movements of an underlying asset without owning it. CFD trading has several advantages, such as:
- Leverage: Traders can use leverage to trade with more capital than they have in their account, which can amplify their profits or losses.
- Short Selling: Traders can short-sell XOM stock if they expect the price to go down, which means they can sell the stock at a higher price and buy it back at a lower price later, profiting from the difference.
- Hedging: Traders can hedge their exposure to XOM stock by taking an opposite position in another asset that is correlated to XOM stock.
Swing Trading: Swing trading for XOM stock is a type of trading that involves holding a position for a few days to a few weeks. Swing traders typically use technical analysis to identify trends and patterns in the market, and they look to enter and exit positions based on these trends.
Day Trading: Day trading for XOM stock is a type of trading that involves holding a position for a single day. Day traders typically use technical analysis to identify short-term price movements, and they look to enter and exit positions within the same day. Day trading for XOM stock can be a very profitable trading style, but it also carries a high risk of losses. Day traders need to be able to make quick decisions and execute trades quickly, as they are constantly exposed to market volatility.
Trade XOM Stock CFD with VSTAR
If you're thinking about trading XOM stock, here's a suggestion: check out VSTAR, one of the best online trading platforms globally, for trading XOM stock CFD. VSTAR offers some cool advantages:
- Low Costs: VSTAR has good deals and not-too-high charges for trading XOM stock CFD. This can help you plan your trading strategy and handle risks better.
- Safe and Reliable: VSTAR uses smart security methods to keep your personal and money details safe when you make transactions.
- Easy to Use: VSTAR has a user-friendly setup and tools that make trading XOM stock CFD simple.
- Help Always There: If you need assistance with XOM stock CFD trading, VSTAR's support team is available 24/7 to help you with any problems or questions.
If you want to learn more about trading XOM stock CFD at VSTAR, you can visit VSTAR's website or contact VSTAR's customer support team for more details.
Conclusion
Exxon Mobil Corp is more than just an oil and gas company. It is a global leader in energy innovation, technology, and sustainability. It has a long and rich history of delivering value to its customers, shareholders, employees, and society. It has a diversified and resilient portfolio of assets that can meet the growing and changing energy demand in the world. It has a positive and ambitious vision for the future, as it aims to grow its production, improve its cash flow, maintain its dividend, and invest in low-carbon solutions.
If you are interested in Exxon Mobil Corp (NYSE: XOM) stock, you should consider trading XOM stock CFD at VSTAR, which is one of the best online trading platforms in the world.
We hope you found this article informative and helpful. Happy trading!
