Here are today's directional views from the global research desks of Trading Central! These are starting points for your own research to identify opportunities that make sense for you. Like what you see? Feel free to forward this to a friend!

Market Wrap: Stocks, Bonds, Commodities
On Tuesday, the U.S. stock market was closed for Independence Day.
Meanwhile, the U.S. Federal Reserve will release its latest FOMC meeting minutes later today, while factory orders are estimated to be up 1.5% on month in May.
European stocks were broadly lower. The Dax 40 fell 0.26% and the Cac 40 dropped 0.23% and the FTSE 100 was down 0.10%.
WTI Crude Future rose $1.4 to $71.23.
Spot gold was up $4 to $1,925.
Market Wrap: Forex
The U.S. dollar index was relatively stable at 103.00 amid thin holiday trading.
EUR/USD dropped 17 pips to 1.0895. Germany's trade surplus totaled 14.4 billion euros in May, compared with 19.1 billion euros expected.
GBP/USD rose 27 pips to 1.2720.
USD/JPY lost 16 pips to 144.52 and USD/CHF fell 1 pip to 0.8962.
AUD/USD gained 23 pips to 0.6696. The Reserve Bank of Australia kept its benchmark rate unchanged at 4.10%, while some have expected a rate hike of 25 basis points. The central bank said "some further tightening of monetary policy may be required to ensure that inflation returns to target in a reasonable timeframe, but that will depend upon how the economy and inflation evolve".
USD/CAD dipped 24 pips to 1.3226. Canada's S&P Global Manufacturing purchasing managers index slipped to 48.8 in June from 49.0 in May, above 48.4 estimated.
Bitcoin traded lower to $30,931.

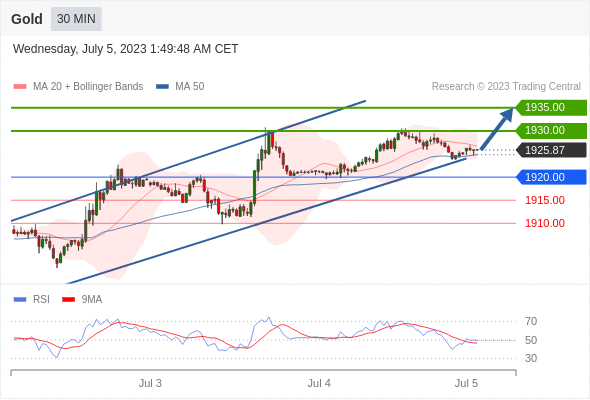
Gold Intraday: supported by a rising trend line.
Pivot:
1920.00
Our preference:
Long positions above 1920.00 with targets at 1930.00 & 1935.00 in extension.
Alternative scenario:
Below 1920.00 look for further downside with 1915.00 & 1910.00 as targets.
Comment:
The RSI is mixed with a bullish bias.

Crude Oil (WTI) (Q3) Intraday: the bias remains bullish.
Pivot:
70.50
Our preference:
Long positions above 70.50 with targets at 71.35 & 71.75 in extension.
Alternative scenario:
Below 70.50 look for further downside with 70.10 & 69.70 as targets.
Comment:
Even though a continuation of the consolidation cannot be ruled out, its extent should be limited.

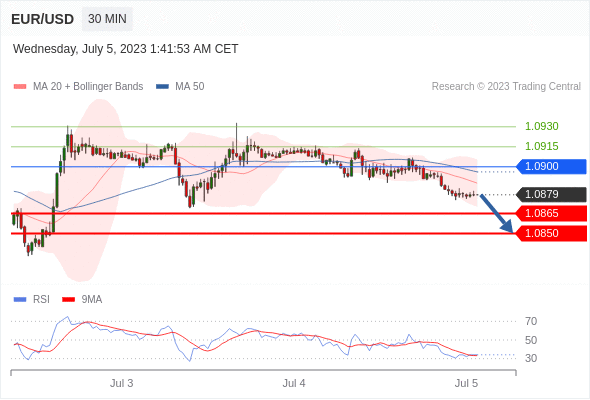
EUR/USD Intraday: towards 1.0850.
Pivot:
1.0900
Our preference:
Short positions below 1.0900 with targets at 1.0865 & 1.0850 in extension.
Alternative scenario:
Above 1.0900 look for further upside with 1.0915 & 1.0930 as targets.
Comment:
The RSI is bearish and calls for further downside.

Bitcoin / Dollar intraday: the downside prevails as long as 31120 is resistance
Our pivot point stands at 31120.
Our preference:
the downside prevails as long as 31120 is resistance
Alternative scenario:
The upside breakout of 31120, would call for 31550 and 31800.
Comment:
The RSI is below 50. The MACD is below its signal line and negative. The configuration is negative. Moreover, the price is trading under both its 20 and 50 period moving average (respectively at 30966 and 31056).

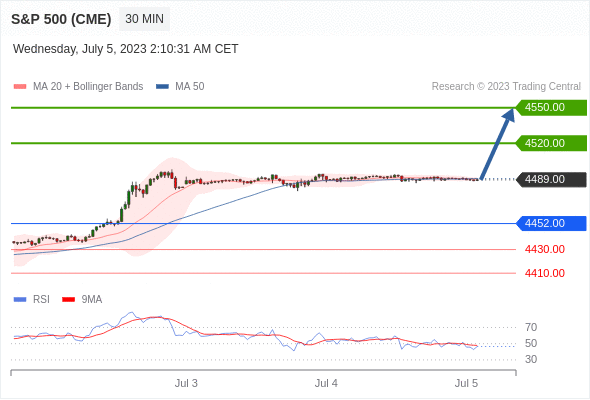
S&P 500 (CME) (M3) Intraday: bullish bias above 4452.00.
Pivot:
4452.00
Our preference:
Long positions above 4452.00 with targets at 4520.00 & 4550.00 in extension.
Alternative scenario:
Below 4452.00 look for further downside with 4430.00 & 4410.00 as targets.
Comment:
Intraday technical indicators lack momentum.

Tesla intraday: the RSI is overbought
Our pivot point stands at 273.4
Our preference:
The upside prevails as long as 273.4 is support.
Alternative scenario:
Below 273.4, expect 265.2 and 260.4.
Comment:
The RSI is trading above 70. This could mean that either prices are in a lasting uptrend or just overbought and that therefore a correction could shape (look for bearish divergence in this case). The MACD is positive and above its signal line. The configuration is positive. Tesla is trading above both its 20 and 50 period moving average (respectively at 270.38 and 262.44).

*Disclaimer: The content of this article is for learning purposes only and does not represent the official position of VSTAR, nor can it be used as investment advice.


