When Accenture (ACN) reports its financial results for November 2024, it is anticipated to show a year-over-year rise in profits on higher revenues. Although this well-known consensus outlook well represents the company's profit picture, comparing the actual results to these projections is a significant factor that could affect the stock value shortly.
ACN Earnings Forecast
Wall Street analysts predict that Accenture (ACN) will report quarterly profits of $3.38 per share in its upcoming report, a 3.4% year-over-year increase. Revenues are expected to rise 5.9% from the corresponding quarter a year ago to $17.18 billion.
Over the last 30 days, the consensus EPS projection for the preceding quarter has been revised downward by 0.4%, reaching its current level. This indicates how the reporting analysts have collectively revised their initial projections over this period.
ACN Revenue Segment Analysis
Analysts expect the 'Revenue-Type of Work-consulting' to reach $8.81 billion. The estimate shows a +4.1 % change from the previous year's quarter.
Analysts estimate the 'Revenue-Type of Work-Managed Services' to be $8.33 billion on average, a change of +7.3% from year to year.
The 'Revenue-Industry Groups-Product' consensus projection is $5.07 billion. According to the estimate, the change from the previous year's quarter was +4.3%.
The analysts' collective conclusion is that 'Revenue-Industry Groups-Health & Public Service' ought to rise to $3.54 billion. The estimate shows a +4.9 % change from the previous year's quarter.
Accenture Stock (ACN) Technical Analysis

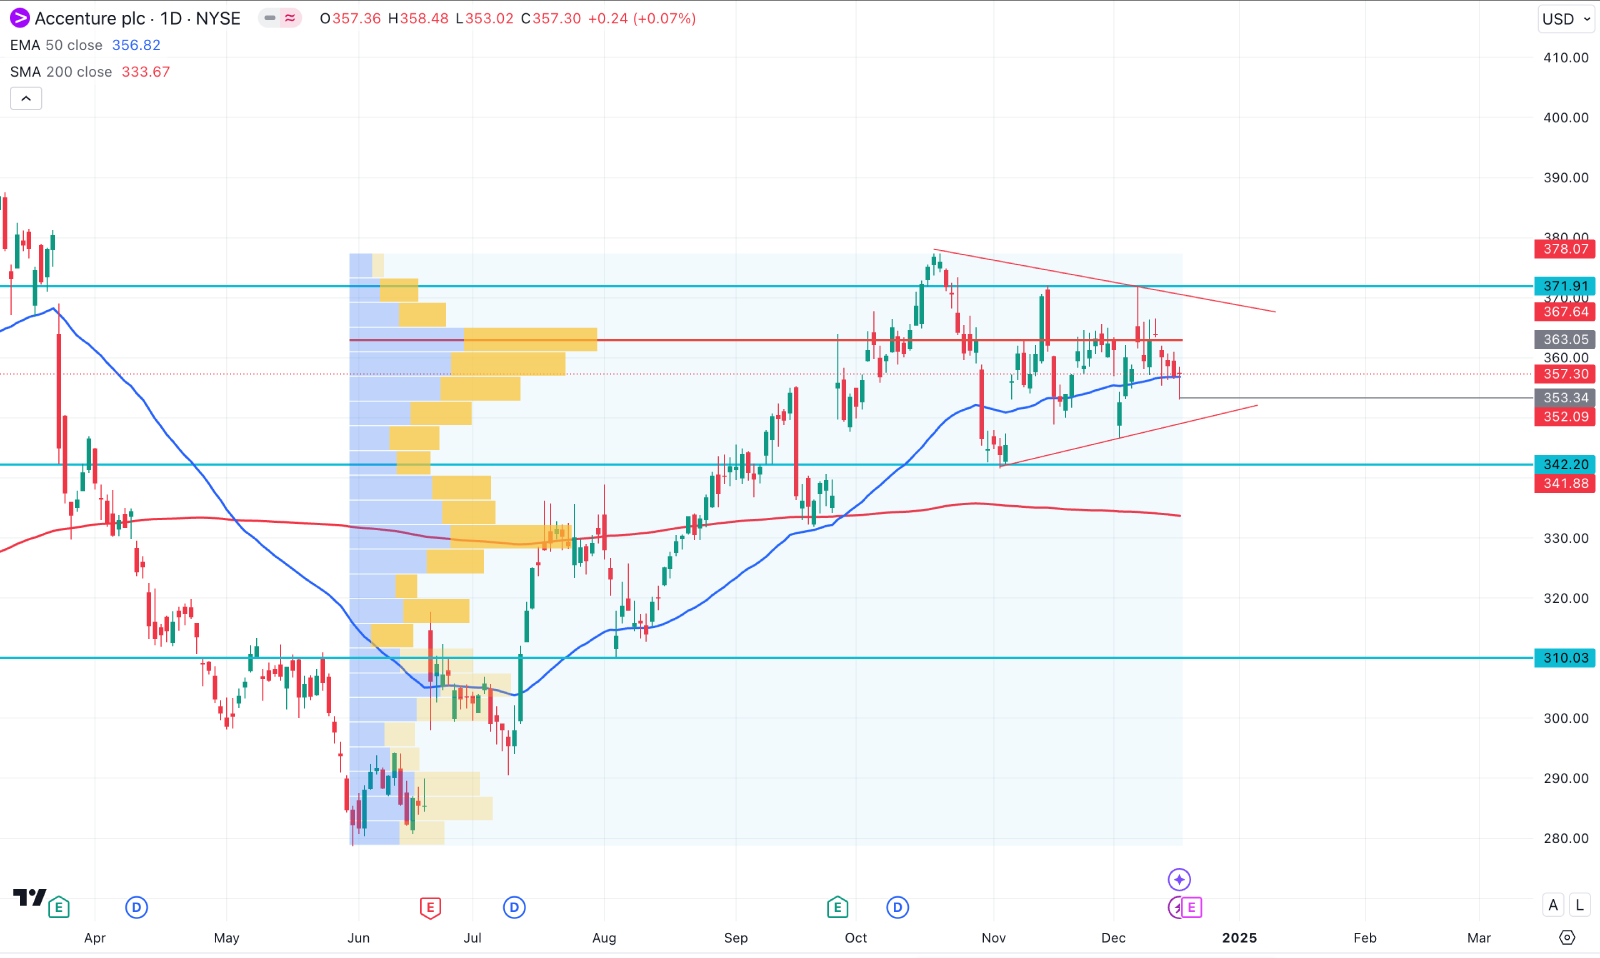
In the daily chart of ACN stock price, the most recent price showed a strong bullish recovery from the June 2024 bottom. However, the most recent price remains sideways with the violation of the near-term dynamic line.
The high volume line since June 2024 is just above the current Accenture stock price, signalling a strong bearish pressure. Primarily, we may expect a downside continuation until the high volume line is breached.
The 200 day SMA is acting as a major support, and we may expect a bullish continuation as long as this level is protected.
Based on this outlook, a symmetrical triangle breakout could signal a bullish continuation in this pair. A valid daily candle above the 371.91 line could increase the possibility of extending the upward pressure above the 400.00 area.
Alternatively, a bearish break below the 353.34 low might extend the selling pressure toward the 200 day SMA line before forming any bull setup.


