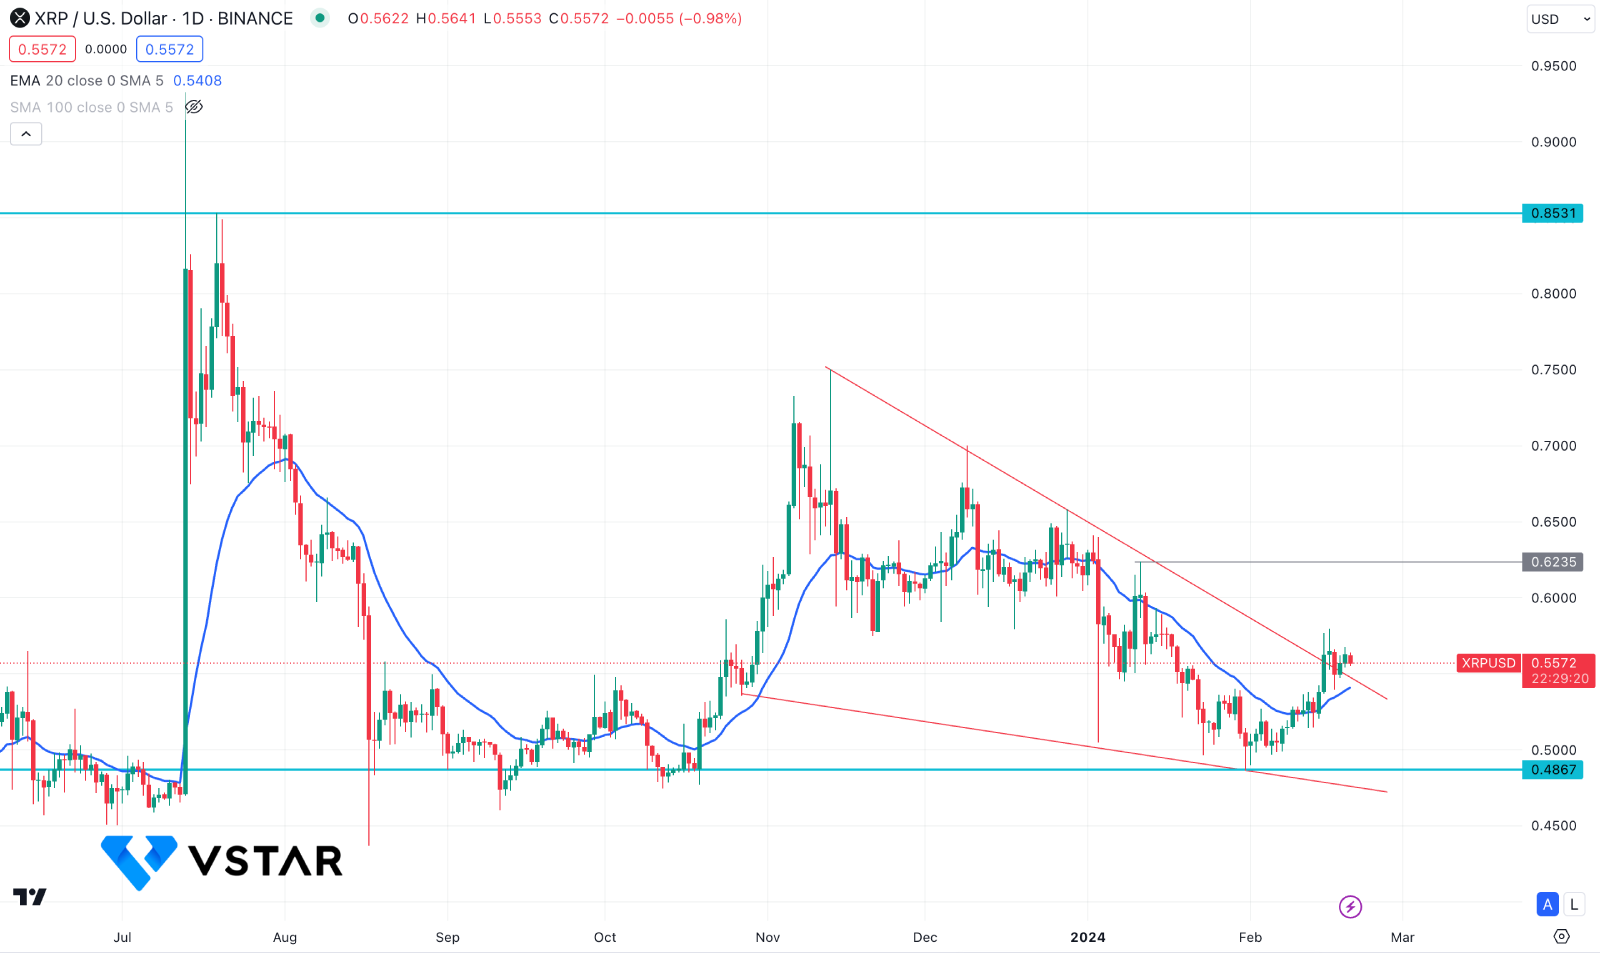
XRPUSD trades with a weekly increase of approximately 6% recently, while the broader market trades sideways within a wedge pattern. A sharp price movement depends on how the lawsuit decision comes with a proper breakout in the technical chart.
Investors Await For Lawsuit Decision
With the presiding judge granting Ripple an additional week to complete discovery about the remedies, the remedies-related phase of the lawsuit is scheduled to conclude on February 20. This time extension provides Ripple with further time to gather the required information concerning institutional sales. Today is a critical juncture in the lawsuit, as XRP holders anxiously await the progression of the legal proceedings.
Ripple's sale of XRP to institutional investors was deemed a violation of Section 5 of the US Securities Act by Judge Analisa Torres in July. The ruling underscored the potential ramifications of penalties on the company's operations. The case is further complicated by the SEC's appeal against the Programmatic Sales of XRP ruling, which may have implications for the regulatory status of XRP.
An ongoing investigation into SEC conflicts of interest and the SEC v. The Coinbase case has the potential to modify the SEC v. Ripple lawsuit substantially. The potential consequences of these events could impact the SEC's position regarding the appeal of the Programmatic Sales decision and its overarching regulatory strategy regarding the cryptocurrency industry.
Whale Activity Suggests A Bull Run
Based on on-chain metrics, large wallet holders reveal a steady growth in XRP price, which implies an optimistic outlook.
Santiment's Network Realized Profit/Loss metric reveals a lower whale transaction valued at $100,000 or more during the previous week. This decline suggests that large wallet investors have slowed their profit-taking. The combination of these on-chain metrics suggests that the price of XRP is poised to increase in the near future.
XRPUSD Technical Analysis

In the daily chart of XRPUSD, the recent price trades sideways within a falling wedge pattern. Moreover, multiple bullish daily candles are visible above the dynamic 20-day EMA, while the Relative Strength Index (RSI) hovers above the 50.00 neutral line.
On the bullish side, investors should closely monitor how the price reacts to the wedge resistance. A valid buying pressure with a daily candle above the 0.6000 mark could validate the bullish breakout. In that case, the price might extend toward the 0.8531 resistance level in the coming days.
On the bearish side, investors should monitor how bulls hold the price above the 0.5000 static level. A bearish daily candle below the 0.4860 level could lower the price towards the 0.3000 area.


