Xinyi Glass (XINYI) provided massive buying pressure in recent trading days, creating a potential long opportunity. The stable position for value investors, while a technical breakout could be a confluence buying signal.
Xinyi Glass Key Ratio Analysis
Xinyi Glass (XINYI) grabbed massive investors attention by maintaining a stable revenue growth for the last few years. The stock's current price-to-earnings (P/E) ratio is 5.63, whereas the industry average is 5.74. The Forward P/E ratio for XYIGF fluctuated between 5.33 and 18.58 over the previous year, with a mean of 8.35.
Additionally, investors ought to be aware that XYIGF has a P/B ratio of 1.04. The P/B ratio compares a stock's market value to its book value, which is calculated by subtracting the total liabilities from the total assets. This stock's P/B ratio appears favorable in comparison to the industry average of 1.33. XYIGF's P/B has fluctuated between 1.92 and 0.82 over the past year, with a mean of 1.23.
Is Xinyi Glass Good For Value Investors?
Among these trends, value investing stands out as a perennial favorite. This approach seeks out companies that the broader market undervalues. Value investors rely on fundamental analysis and traditional valuation metrics to identify stocks they believe are priced lower than their intrinsic worth.
Although these are only a few of the metrics that value investors typically consider, they indicate that Xinyi Glass is probably undervalued. Given these factors and the positive trajectory of its earnings projections, XINYI is an excellent value stock.
Xinyi Glass (XINYI) Technical Analysis
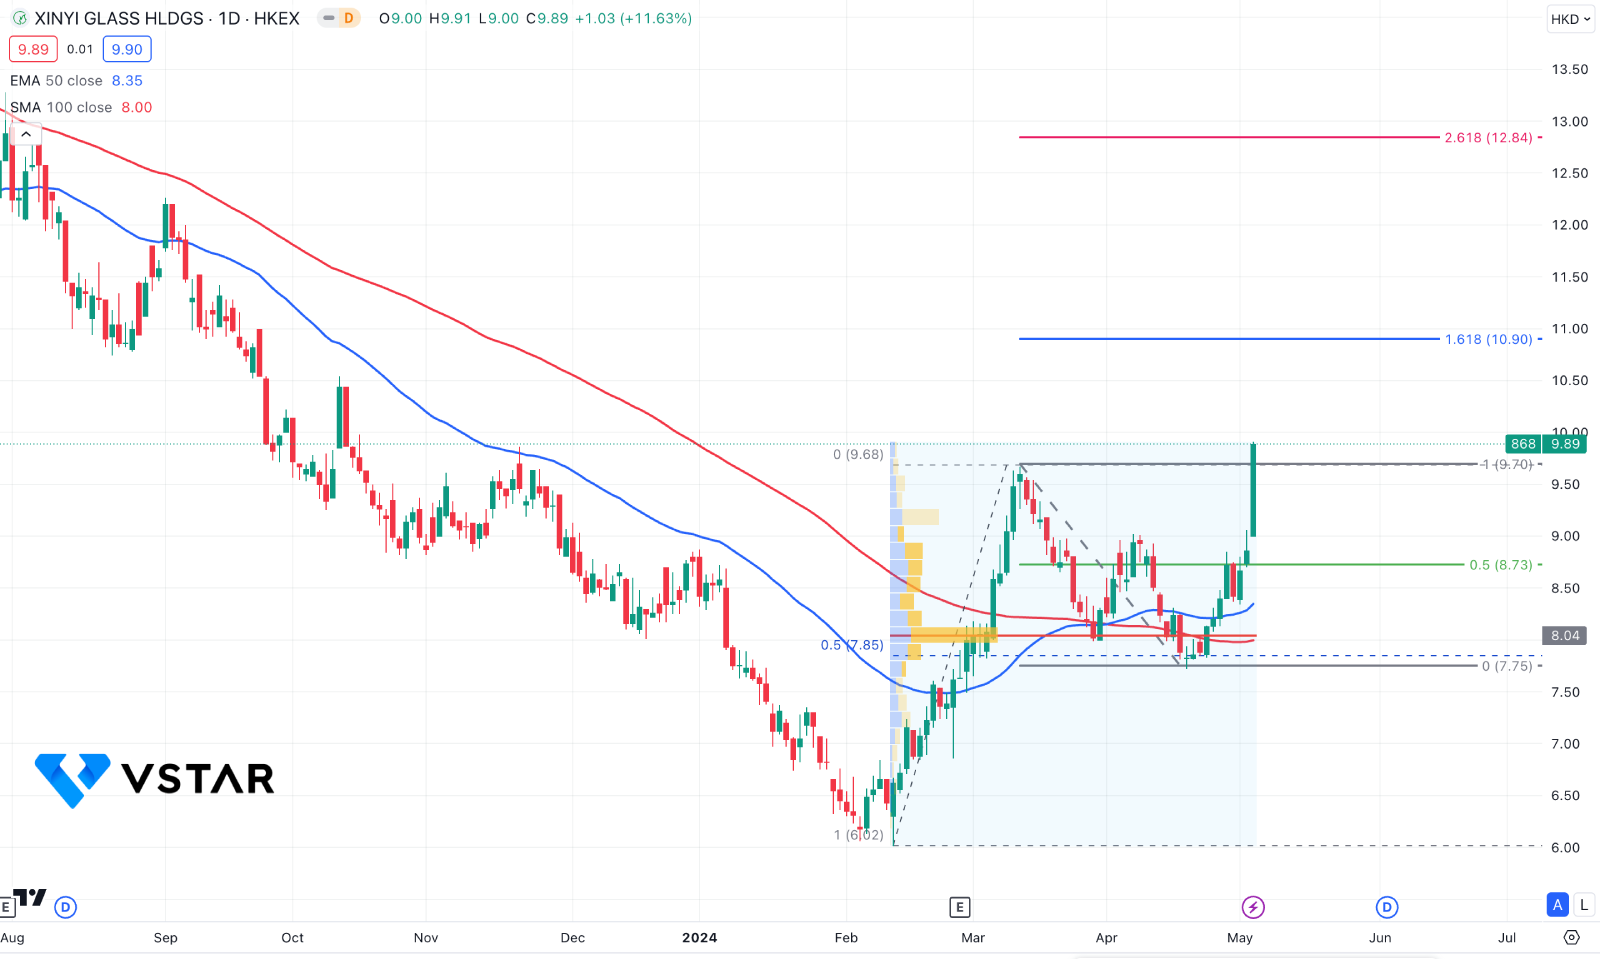
In the daily chart of Xinyi Glass stock price, a strong bullish possibility is seen as the recent price formed a range breakout from the crucial Fibonacci Retracement level. Moreover, a bullish breakout is visible above the dynamic 20-day EMA line, suggesting a confluence of bullish factors.
In the volume structure, the highest volume level since February 2024 is at 8.04 level, which is above the current price. The trading approach from the volume structure is to look for long trades only, as long as the price holds above the 8.00 level.
Based on the broader market structure, the ongoing buying pressure is visible above the 100-day Simple Moving Average level. In that case, any minor downside correction towards the dynamic 20 EMA with a valid bullish rejection could be a long signal, targeting the 12.50 to 15.00 zone.
On the bearish side, a failure to hold the price above the 8.00 level with a bearish daily close could be a potential bearish opportunity.