
Although there were indications that wheat was at least forming a bottom, the three U.S. wheat futures exchanges were trading close to some of their lowest points in recent memory.
US Wheat Harvest Outlook
The winter wheat harvest in the United States is ending, but harvest activities in France and Germany were postponed due to unseasonal rains in Europe. The amount of French wheat produced this growing season may be the lowest in the previous forty years due to excessive moisture prior to the season. The underwhelming wheat production in Russia and Ukraine further paved the way for North American wheat shipment in the 2024–2025 marketing year.
The rainy harvest season in Europe also affected the crop's quality. Wheat cultivation in Germany and France yields low, and a large amount of the crop is unfit for export, which further reduces the crop's potential market.
Wheat Export Outlook
Based on the most recent data, exported wheat from Russia and Europe in combination may have decreased by approximately 11 million tonnes this year. This cut should help to balance wheat markets and rebalance the world wheat supply.
Data from the Canadian Grain Commission shows that in 2023–2024, Canada shipped 21.15 million tonnes of wheat, an increase from 19.67 million tonnes the year before. However, there was less durum movement, from 5.10 million in 2022–2023 to 3.45 million now.
A spring wheat graph shows that in mid-August, the Minneapolis December agreement was trading slightly above US$6 per bushel of grain. It has repeatedly tested that important chart point, but it hasn't closed lower. The December agreement level to monitor in the more engaged Chicago soft wheat marketplace is $5.40 per bushel of grain.
Wheat Prices Technical Analysis
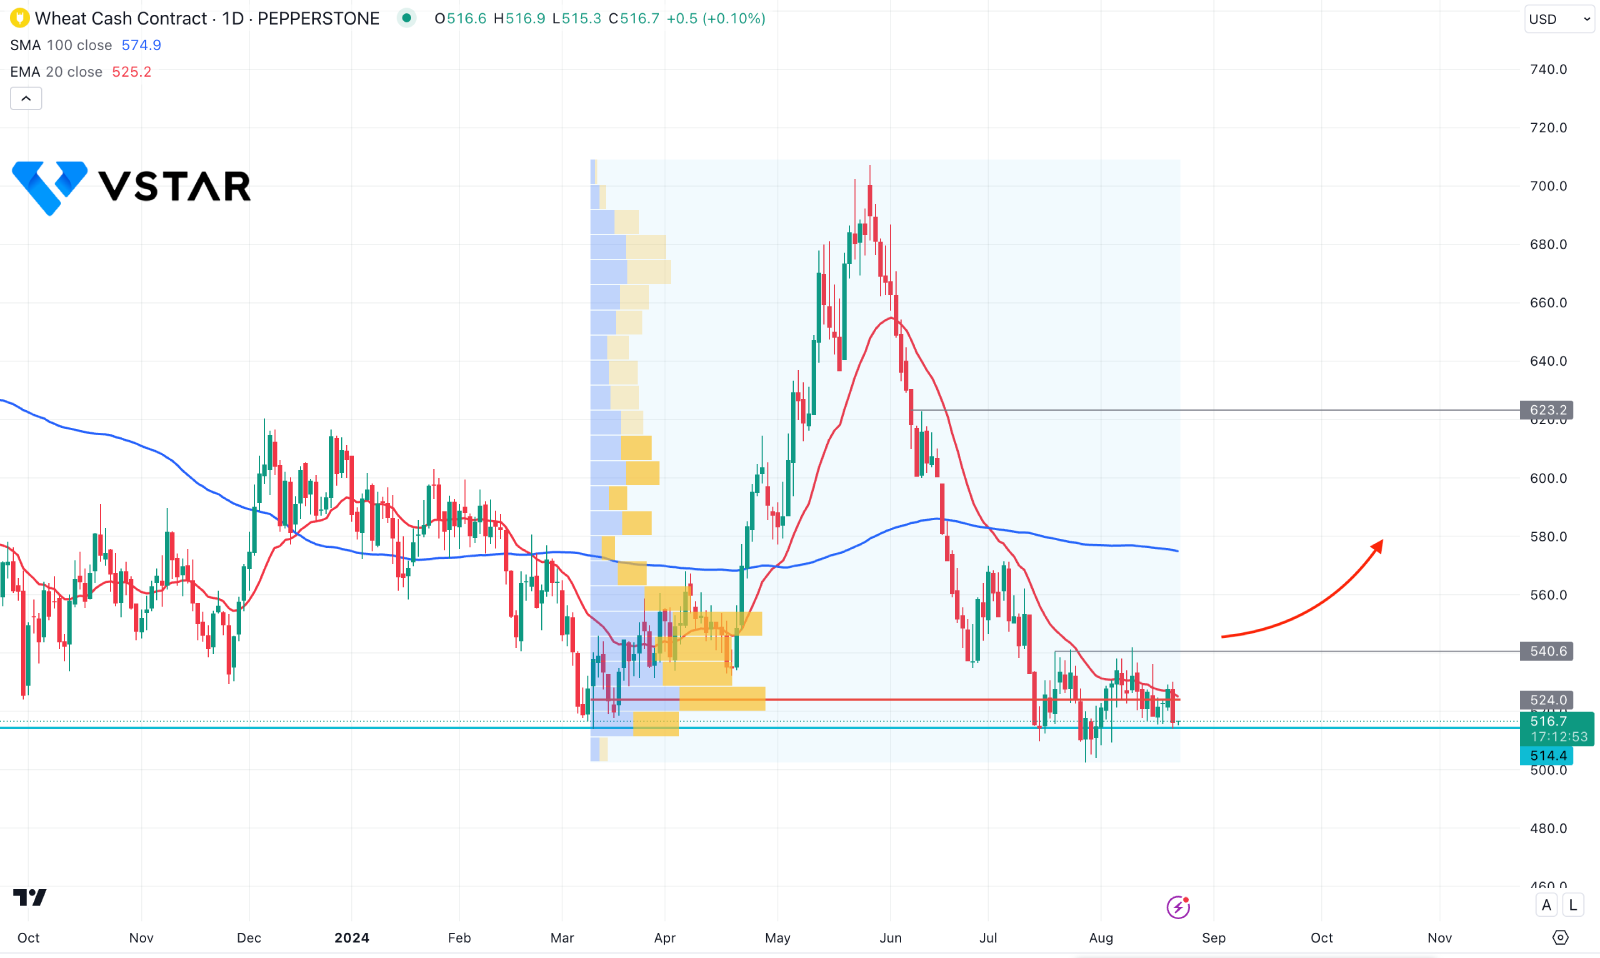
In the daily chart of Wheat price, a massive selling pressure is visible and found support at the 514.40 static line. In that case, the primary outlook for this instrument will be bearish until there is a strong failure.
In the main chart, the recent price trades below the 100-day Simple Moving Average, suggesting a major bearish trend. Also, the high volume line since March 2024 is closer to the current price, suggesting institutions' involvement in the selling pressure.
Based on the current market outlook, the bearish daily candle below the 500.00 psychological line could resume the bearish trend aiming for the 450.00 area.
On the other hand, the current range bound market might find a hope by having a breakout above the 540.60 level could increase the possibility of aiming higher and reach the 600.00 area.