


After rebounding from the two-month low, the USDCAD pair currently trades with a corrective downward pressure. This decline is due to the June US inflation readings, which were softer than anticipated. This has increased the likelihood of a Federal Reserve (Fed) rate cut in September, placing pressure on the US Dollar.
The US Inflation Reached The Multi-year Low
The Labour Department's report released on Thursday indicated that the United States' Consumer Price Index (CPI) experienced a 0.1% month-over-month decline in June. This represents the lowest level of inflation in more than three years. The headline CPI increased by 3.0% year-over-year in June, lower than the market consensus of 3.1% and lower than the 3.3% increase in May.
In contrast to the 3.4% increase in May and market expectations, the core CPI, which excludes volatile food and energy prices, increased by 3.3% year-over-year in June.
A Rate Cut Is Possible By The Fed
As a result of this data release, investors in the fed funds futures market have increased their wagers on a rate cut by the US Federal Reserve commencing in September. The odds of a September rate cut have increased from 73% on Wednesday to nearly 89%, according to the FedWatch Tool of the CME Group.
In addition, the U.S. weekly Initial Jobless Claims for the week ending July 6 decreased to 222,000 from 239,000 the previous week, the lowest level since June 1. This figure exceeded the anticipated 236,000.
Weaker Employment Influenced CAD Bears
The probability of additional interest rate cuts by the Bank of Canada (BoC) has increased due to the economy's loss of 1,400 jobs in June and the rise in the unemployment rate to 6.4% in Canada. The weaker Canadian labor market data may impact the Canadian dollar (CAD), which could also support the USDCAD pair.
Nevertheless, the return of crude oil prices could potentially mitigate CAD's losses, as Canada is a significant crude oil exporter to the United States.
USDCAD Forecast Technical Analysis
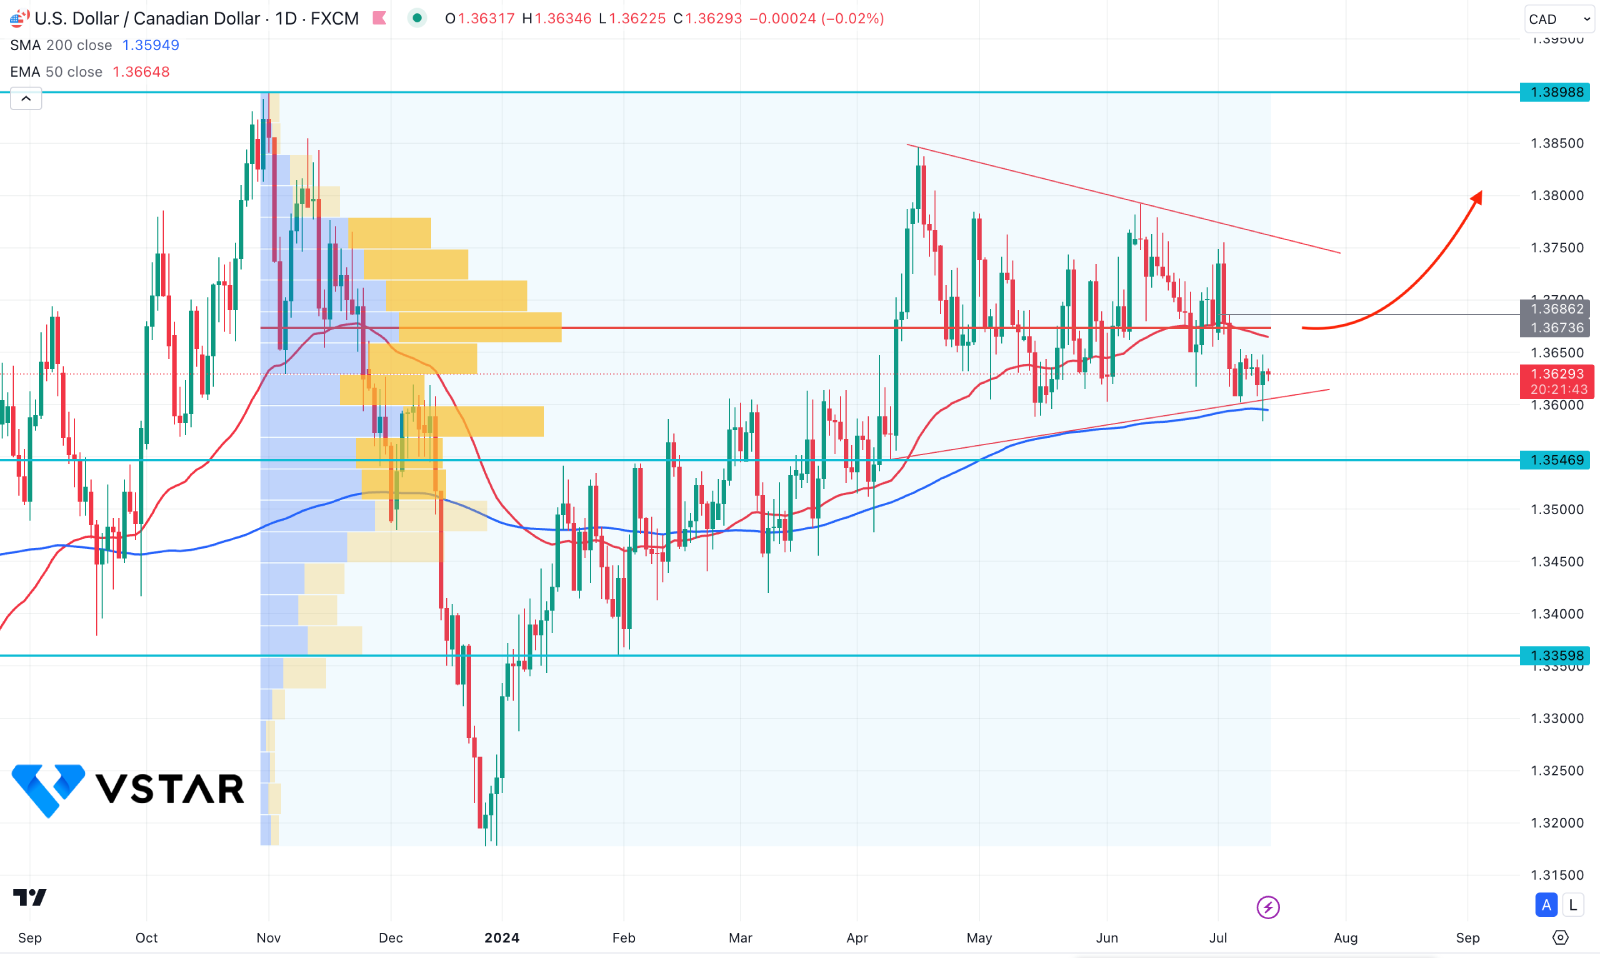
In the daily chart of USDCAD, the recent price trades sideways after having counter-bullish impulsive pressure since the beginning of 2024. As the current situation remains sideways and within a bullish trend, we may expect the buying pressure to extend.
Looking at the volume structure- the most active level since November 2023 is at 1.3873 level, which is above the current price. The most recent price trades below this line with a corrective momentum. Therefore, a strong bullish reversal is needed above the high volume line, anticipating the trend continuation.
The 200-day Simple Moving Average is the immediate support, while the dynamic 50-day EMA is above the current price. Moreover, a symmetrical triangle formation is visible, with the current price hovering at the trendline support.
Based on this outlook, a bullish continuation is possible, where the main aim is to test the triangle resistance. In that case, a stable break above the 1.3686 resistance level could signal an early sign of a bullish reversal, aiming for the 1.3850 level.