Solid U.S. economic data released on Tuesday confirmed predictions that the US Federal Reserve will lower interest rates cautiously, causing the dollar to gain. The US Dollar Index (USDX) reached a record high and is currently hovering near the 109.00 level with no sign of a recovery.
What To Expect From The US Job Market?
While the ISM services index gained more than anticipated in December and revealed a strong increase in input prices, U.S. job vacancies reached a six-month record high in November. According to a report by Francesco Pesole of ING, the data decreased the market's likelihood of a rate reduction by the Fed in March.
The ADP Non-Farm Employment Change showed a weaker result, coming at 122K, down from 146K in the previous month. It signals that job opportunities in the United States surprisingly increased in November, layoffs were minimal, activity in the service industry expanded in December, and an indicator of input costs hit a two-year peak, potentially signaling inflation. Alao, this result provides the possible downside outcome for the Nonfarm payroll, which is scheduled to be released on Friday.
What To Expect From Trump's Inauguration?
In addition to the inauguration day on January 20, when Donald Trump is anticipated to launch the second term of the U.S. presidency amid a barrage of executive actions and policy statements, traders are nervous ahead of Friday's release of U.S. labor data.
The CBoE Volatility Index reached the weekly high and showed a sign of recovery after the FOMC meeting minutes.
Also, the 10-year yield (US10YT=TWEB) increased by over eight basis points to make it to an eight-month peak of 4.699%, whereas the 30-calendar year yield (US30YT=RR) increased by 7.4 basis points, falling fewer than nine basis points short of breaking 5%.
US Dollar Index (USDX) Technical Analysis

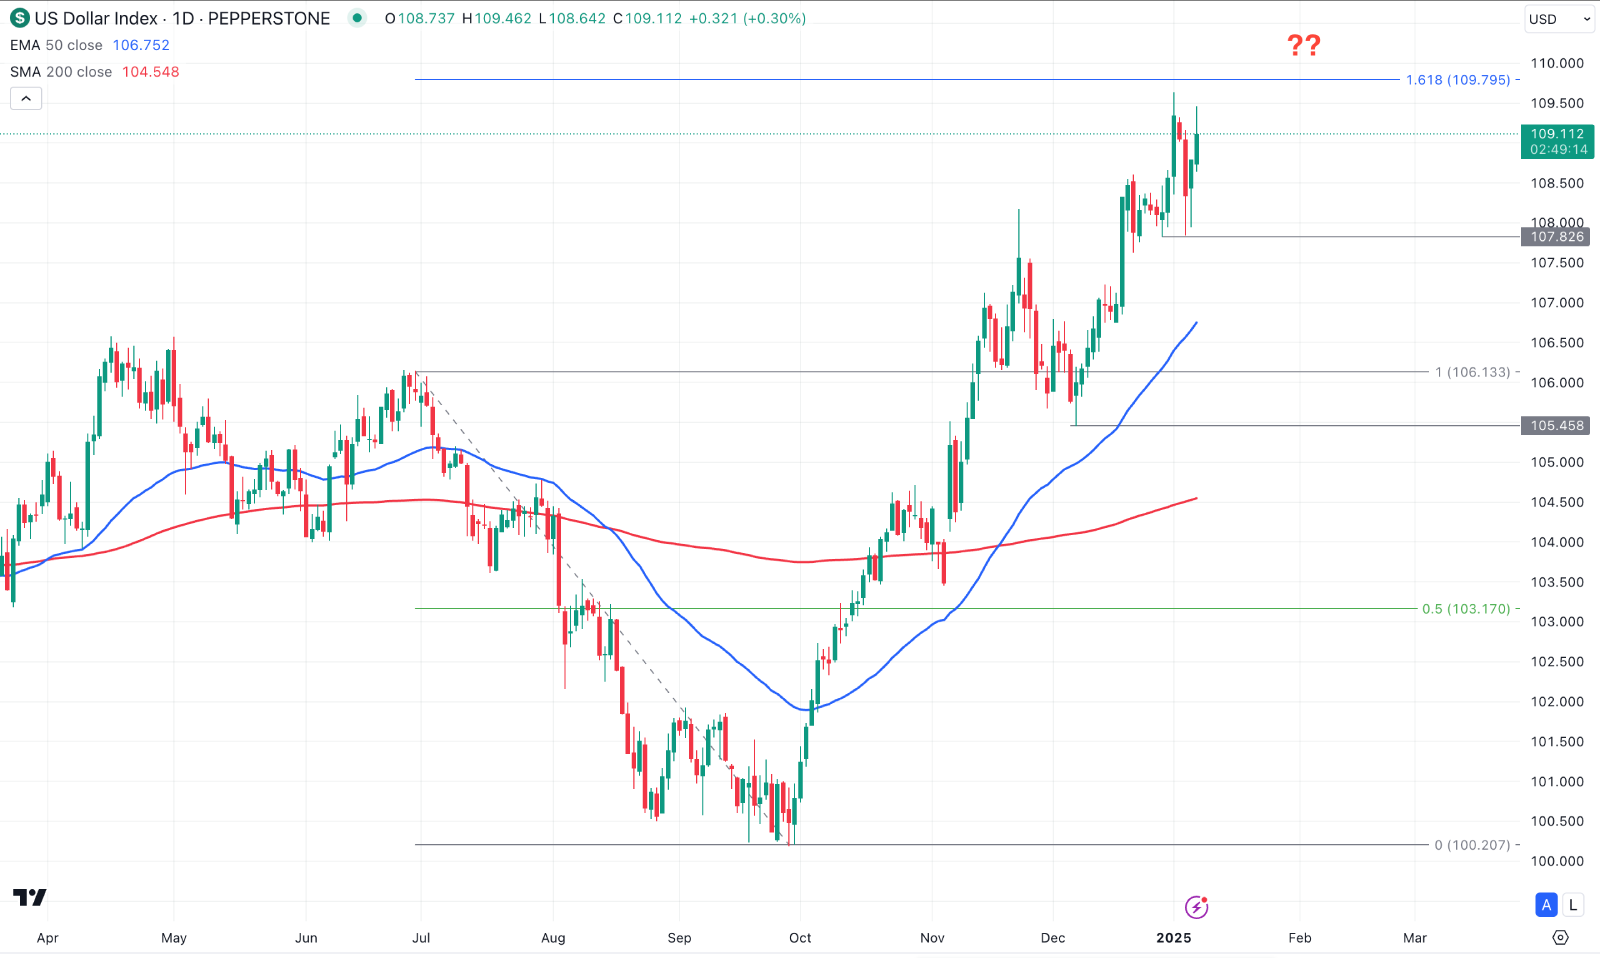
In the daily chart of USDX, the recent price shows an extended bullish pressure, taking the price to a record high level. However, the latest price is approaching the potential Fibonacci Extension level from the 2024 peak, from where a downside correction is possible.
In the broader context, the gap between the dynamic 200-day SMA and the current price is extended. It is a sign that the long-term market traders are still bullish in the market, from where a profit taking is pending. Moreover, the 50 day EMA is 2.2% down from the current price, signalling a pending downside correction..
Based on this outlook, the ongoing bullish pressure has no sign of a recovery yet but any sign of exhaustion at the top could be the early short opportunity. As of now, the price is bullish as long as it trades above the 107.81 support level. Breaking below this line could signal a valid top formation, which might lower the price towards the 105.46 support line before reaching the 100.00 level.


