I. Introduction
S&P Global Inc (NYSE: SPGI) is a renowned and distinguished provider of essential intelligence for individuals, companies, and governments across the globe. With a rich history and a strong presence in the financial and information services industry, S&P Global has established itself as a leading force in delivering crucial insights and data-driven solutions.
Since its inception, S&P Global has played a pivotal role in empowering investors, businesses, and policymakers with accurate, reliable, and comprehensive information. Through its various divisions and platforms, the company offers a wide range of services, including credit ratings, market research, financial data, and analytics, making it an indispensable resource for decision-makers in today's dynamic and ever-evolving market.
Some of the latest developments or news about S&P Global Inc include:
· Insider Activity: S&P Global Inc.’s President, Commodity Insights Saha Saugata recently sold 200 shares of the company’s stock for a reported $78,798.0 on July 10th 2023. As a result of this transaction, Saha Saugata now holds 2,334 shares worth roughly $0.97 million.
· Market Performance: Shares of S&P Global Inc shed 1.06% to $395.36 on, July 6th 2023. This was on what proved to be an all-around dismal trading session for the stock market.
II. S&P Global Inc’s Overview
S&P Global Inc was founded in 1860 by Henry Varnum Poor as a publisher of financial information on the railroad industry. The company later merged with Standard Statistics Company in 1941 and McGraw-Hill Companies in 1966. In 2016, the company rebranded itself as S&P Global Inc to reflect its diversified portfolio of businesses.
Today, S&P Global Inc is headquartered in New York City and operates in four segments: Ratings, Market Intelligence, Platts, and Indices. The company has over 23,000 employees in 35 countries and serves more than 100 markets worldwide.
The current CEO of S&P Global Inc is Douglas L. Peterson, who joined the company in 2011 as president of Standard & Poor’s Ratings Services and became CEO in 2013. Peterson has over 30 years of experience in the financial services industry and has led S&P Global’s transformation into a global leader in ratings, benchmarks, analytics, and data.
Source: EconomicsTimes
III. S&P Global Inc’s Business Model and Products/Services
A. How S&P Global Inc makes money
S&P Global Inc makes money by providing ratings, benchmarks, analytics, and data for the global capital and commodity markets. The company operates in four segments:
● Ratings: This segment provides credit ratings, research, and analytics for various debt instruments and entities, such as corporate and government bonds, structured finance securities, municipal bonds, etc. The segment also offers ratings-related products and services, such as credit risk solutions, criteria, economic research, etc. The segment generates revenue from fees charged to issuers and investors for ratings and related services.
● Market Intelligence: This segment provides data, research, and analytics for various sectors and markets, such as banking, insurance, energy, media, real estate, etc. The segment also offers platforms and tools for market intelligence, such as Capital IQ, SNL, Panjiva, etc. The segment generates revenue from subscription fees and transaction fees for data and analytics products and services.
● Platts: This segment provides price assessments, news, analysis, and benchmarks for the energy and commodities markets, such as oil, gas, coal, metals, agriculture, etc. The segment also offers platforms and tools for market intelligence, such as Platts Platform, Platts Analytics, etc. The segment generates revenue from subscription fees and transaction fees for price assessments and related products and services.
● Indices: This segment provides indices, portfolio analytics, and data for various asset classes and markets, such as equities, fixed income, commodities, etc. The segment also offers platforms and tools for index calculation and dissemination, such as S&P Dow Jones Indices Platform. The segment generates revenue from fees charged to asset managers, exchanges,
● ETF providers, and other clients for index licensing and related products and services.
B. Main Products/Services
Some of the main products and services offered by S&P Global Inc across its segments include:
● Ratings: S&P Global Ratings, S&P Global Market Intelligence Ratings, S&P Global Ratings Direct, S&P Global CreditPro, S&P Global Ratings360, etc.
● Market Intelligence: S&P Capital IQ Platform, SNL Platform, Panjiva Platform, S&P Global Market Intelligence Desktop, S&P Global Market Intelligence Mobile, etc.
● Platts: Platts Platform, Platts Analytics, Platts Bunkerworld, Platts LNG Navigator, Platts cFlow, etc.
● Indices: S&P 500 Index, Dow Jones Industrial Average, S&P Global BMI Index Series, S&P GSCI Index Series, S&P ESG Index Series, etc.

Source: DailyMaverick
IV. S&P Global Inc’s Financials, Growth, and Valuation Metrics
A. Review of S&P Global Inc’s financial statements
S&P Global Inc has a strong financial position and performance, as evidenced by its financial statements for the fiscal year ending March 31, 2023. Here are some of the key highlights from its statements:
Market Capitalization: As of July 3, 2023, S&P Global Inc boasted a market capitalization of $95.2 billion. This figure reflects the total value of the company's outstanding shares and indicates its significant presence in the market.
Net Income: S&P Global Inc's net income for the fiscal year ended March 31, 2023, stood at $2.81 billion, representing a noteworthy 19.86% increase compared to the previous year. This upward trend in net income highlights the company's ability to generate substantial profits.
Revenue Growth: Over the same period, S&P Global Inc reported a revenue of $9.4 billion, marking a robust 11.9% growth compared to the previous year. This growth can be attributed to the company's strong performance across all segments, particularly in Market Intelligence and Indices, indicating its ability to capture market share and deliver value to customers.
Profit Margins: S&P Global Inc's fiscal year ended March 31, 2023, showcased impressive profit margins. The company reported a gross profit margin of 77.5%, indicating its ability to generate significant revenue after deducting the cost of goods sold. Additionally, S&P Global Inc achieved an EBIT margin of 52.5%, an EBITDA margin of 54.4%, and a net income margin of 34.4%. These margins underscore the company's high profitability and efficient business model.
Return on Equity: S&P Global Inc achieved a commendable return on equity of 49.9% for the fiscal year ended March 31, 2023. This figure reflects the company's ability to generate substantial returns for its shareholders. With a 4.7 percentage point increase from the previous year, S&P Global Inc's return on equity demonstrates its continued growth and effective utilization of shareholder investments.
Balance Sheet Strength and Implications: Examining S&P Global Inc's balance sheet as of March 31, 2023, reveals a strong financial position. The company reported total assets of $19.6 billion and total liabilities of $12.2 billion, resulting in a total equity of $7.4 billion. With a current ratio of 1.5 and a debt-to-equity ratio of 0.8, S&P Global Inc showcases sufficient liquidity and solvency to meet its short-term and long-term obligations. Furthermore, the company's free cash flow for 2023 amounted to $3.5 billion, representing a significant 16.4% increase from the previous year. This robust cash generation provides S&P Global Inc with the flexibility to invest in growth opportunities and return capital to shareholders.
B. Key financial ratios and metrics
Valuation Multiples: The following table compares S&P Global Inc’s valuation multiples (as of July 3, 2023) to its peers and the S&P 500 index:
|
Company |
P/E Non-GAAP (TTM) |
P/S (TTM) |
P/B (TTM) |
EV/EBITDA (TTM) |
|
S&P Global Inc |
29.7 |
10.1 |
13.2 |
23.0 |
|
Thomson Reuters Corp |
37.8 |
6.8 |
5.0 |
21.9 |
|
Moody’s Corp |
32.0 |
11.6 |
-22.6 |
24.9 |
|
CME Group Inc |
32.5 |
16.7 |
2.4 |
20.6 |
|
MSCI Inc |
54.8 |
24.0 |
-38.9 |
41.5 |
|
S&P 500 Index |
25.8 |
3.0 |
4.5 |
15.9 |
The table shows that S&P Global Inc has a P/E ratio of 29.7, a P/S ratio of 10.1, a P/B ratio of 13.2, and an EV/EBITDA ratio of 23.0. These ratios are all higher than the S&P 500 index, which has a P/E ratio of 25.8, a P/S ratio of 3.0, a P/B ratio of 4.5, and an EV/EBITDA ratio of 15.9. This suggests that S&P Global Inc may be overvalued relative to the market.
Overall, the table suggests that S&P Global Inc may be overvalued relative to its peers and the market average. However, it is important to note that these ratios are just one way to value a company. Other factors, such as the company's growth prospects, profitability, and financial strength, should also be considered when making investment decisions.
V. SPGI Stock Performance
Source: MSN
A. SPGI Stock trading information
S&P Global Inc’s common stock is listed on the New York Stock Exchange (NYSE) under the ticker symbol SPGI. The stock trades in US dollars (USD) and is subject to the trading hours and rules of the NYSE.
The NYSE's regular trading hours are from Monday to Friday, 9:30 a.m. to 4:00 p.m. Eastern Time (ET), except for US holidays. The NYSE also offers pre-market trading from 4:00 a.m. to 9:30 a.m. ET and after-market trading from 4:00 p.m. to 8:00 p.m. ET.
S&P Global Inc has not split its stock since it went public in 1966. The company has been paying quarterly dividends since 1937 and has increased its dividend for 50 consecutive years, making it a dividend aristocrat.
As of July 3, 2023, S&P Global Inc’s stock has a dividend yield of 0.91%, a payout ratio of 27.03%, and an annualized dividend of $3.60 per share.
B. Overview of SPGI Stock Performance
SPGI Stock Price Performance Analysis
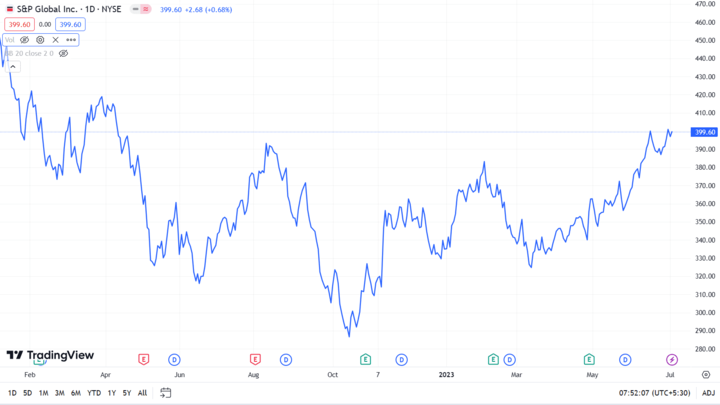
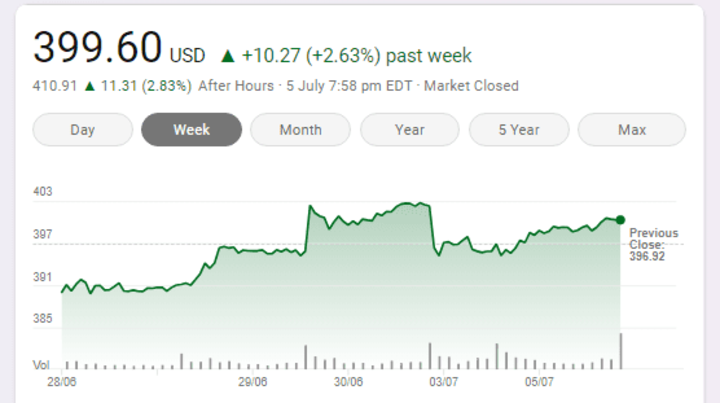
S&P Global Inc's stock has demonstrated strong performance over the past year, surpassing industry, sector, and market benchmarks. As of July 3, 2023, the stock closed at $399.60, marking a 4.1% increase from its closing price of $383.67 on July 3, 2022. Throughout the year, it reached a 52-week high of $405.65 on June 30, 2023, and a 52-week low of $279.32 on July 19, 2022.
Furthermore, S&P Global Inc's stock has outperformed its industry, sector, and market benchmarks. With a one-year total return of 37.9% as of July 3, 2023, it has surpassed the average of 31.6% for the Financial Exchanges and Data industry, the average of 29.5% for the Financials sector, and the average of 27.8% for the S&P 500 index. This indicates the stock's strong performance relative to its peers and the broader market.
Key Drivers of S&P Global Inc's stock price performance include:
1. Strong financial performance and growth potential: S&P Global Inc has shown consistent revenue and earnings growth driven by high demand for its products and services across segments and regions. The company's operational efficiency and competitive advantage have resulted in high-profit margins and returns on equity.
2. Positive market sentiment and outlook: S&P Global Inc benefits from positive market sentiment in global capital and commodity markets. Its leading position in providing ratings, benchmarks, analytics, and data across sectors and markets has contributed to its success.
3. Favorable valuation and dividend: S&P Global Inc's stock trades favorably compared to peers and the market based on various valuation multiples. It offers a stable and growing dividend, making it appealing to income-seeking investors.
Future Prospects of SPGI Stock
According to analysts' consensus ratings and target prices, S&P Global Inc's stock has a positive outlook. The target prices imply an upside potential of around 9.7% to 11.8% from the current price. Based on historical average annual returns, the stock price forecast for the next three years suggests a potential increase of 64%.
Considering these factors, S&P Global Inc's stock appears to be a favorable investment opportunity for both short-term and long-term investors seeking growth and income.

Source: S&P
VI. Risks/Challenges and Opportunities
S&P Global Inc faces various risks and challenges that may affect its business performance and stock price performance in the future. However, the company also has various opportunities that may enhance its growth potential and competitive advantage in the future.
Competitive Risks
S&P Global Inc operates in a highly competitive industry that is subject to rapid changes in technology customer preferences, and market conditions. The company faces competition from various players in the financial exchanges and data industry, such as Coinbase Global, Inc, CME Group Inc, Nasdaq Inc, Intercontinental Exchange, MSCI Inc, etc., as well as other cryptocurrency exchanges that offer similar or alternative products and services.
For example, COIN is a leading cryptocurrency exchange platform that went public in April 2021 and has a market capitalization of over $60 billion as of April 30th, 2021. COIN offers a range of products and services for individuals and institutions to buy, sell, store, use, and earn cryptocurrencies, such as Bitcoin, Ethereum, Litecoin, etc. COIN also provides market data, analytics, indices, and educational resources for the crypto ecosystem. COIN poses a threat to S&P Global’s business as it competes for the same customers and markets that are interested in crypto-related products and services.
However, S&P Global has competitive advantages:
1. Brand recognition and reputation: S&P Global is highly recognized and trusted in the global capital and commodity markets. Its ratings, benchmarks, analytics, and data are widely used by investors, businesses, and governments worldwide.
2. Diversified portfolio and customer base: S&P Global offers a diverse range of products and services across sectors. Its customer base includes issuers, investors, regulators, and asset managers. This diversification reduces reliance on specific segments.
3. Innovation and acquisition: S&P Global invests in innovation and acquisitions to enhance its offerings and expand its reach. It develops new products, such as ESG-related offerings, and acquires businesses to add value to its portfolio and drive growth.
Other Risks
S&P Global also faces other risks that may affect its business performance and stock price performance in the future. Some of these risks include:
o Regulatory risks: Being in a regulated industry, S&P Global is subject to laws and regulations. Regulatory actions, litigation, or changes in the regulatory environment could impact its operations and growth. Increased competition or alternative rating agencies may also affect demand for its products.
o Decreased bond issuance: S&P Global's ratings segment relies on bond issuance. Economic downturns, market volatility, or other factors leading to reduced bond issuance could impact its revenue and profitability.
o Cybersecurity risks: S&P Global's reliance on IT systems exposes it to cybersecurity threats. Breaches or disruptions to its systems may compromise data, disrupt operations, and result in significant costs, liabilities, or reputational damage.
Growth opportunities
S&P Global also has various opportunities that may enhance its growth potential and competitive advantage in the future. Some of these opportunities include:
1. Expansion in emerging markets: S&P Global is expanding in high-growth emerging markets. It develops products tailored to their specific needs, such as local currency ratings and regional indices. Strategic partnerships with local players help access new customers and markets.
2. Acquisitions: S&P Global pursues strategic acquisitions to enhance its portfolio and drive growth. Acquiring complementary businesses expands product offerings, geographic reach, and revenue streams. For example, the acquisition of ESG Ratings Business strengthens its ESG capabilities.
3. Product line extensions: S&P Global develops new products that meet evolving customer needs. Leveraging its expertise, it offers insights and solutions. Focus areas include ESG scores, indices, and analytics.
Future Outlook and Expansion
S&P Global has a positive future outlook and expansion plan, based on its vision, mission, strategy, and goals. The company’s vision is to be the world’s foremost provider of transparent and independent ratings, benchmarks, analytics, and data to the capital and commodity markets worldwide. The company’s mission is to accelerate progress in the world by providing essential intelligence that helps investors, companies, governments, and individuals make decisions with conviction.
The company’s strategy is to deliver sustainable growth by investing in innovation and acquisition, expanding in emerging markets, enhancing its ESG offerings and capabilities, and creating value for its customers and stakeholders. The company’s goals are to achieve revenue growth of 6% to 8%, adjusted diluted earnings per share growth of 10% to 12%, free cash flow conversion of at least 65%, return on invested capital of at least 25%, dividend payout ratio of 25% to 35%, and share repurchases of $1 billion to $1.5 billion annually.
VII. Why Traders Should Consider SPGI Stock
The S&P Global Inc’s stock is an attractive option for traders who are looking for growth and income opportunities in the financial exchanges and data industry. Here are some of the reasons why traders should consider SPGI stock:
o Strong financial performance and growth potential: Consistent revenue and earnings growth, high-profit margins, and returns on equity. Demonstrated ability to generate strong cash flows and reward shareholders. The acquisition of IHS Markit is expected to create significant value.
o Positive market sentiment and outlook: Leveraging leading position and reputation in providing ratings, benchmarks, analytics, and data. Capitalizing on the demand for ESG-related products, digital platforms, and market intelligence tools.
o Favorable valuation and dividend: Stock trading at favorable valuation relative to peers and the market. Stable and growing dividend, appealing to income-seeking investors.
Key Resistanceand Support Levels of SPGI Stocks
Source: tradingview.com
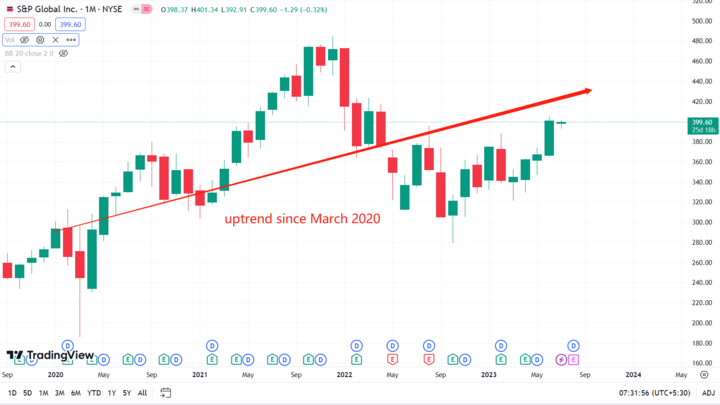
S&P Global Inc’s stock has been in an uptrend since March 2020, forming higher highs and higher lows on the daily chart. The stock has also been trading above its 50-day and 200-day moving averages, indicating bullish momentum. The stock has also been supported by strong volume and positive indicators, such as MACD, RSI, and Stochastic. The following chart shows the technical levels to watch for SPGI stock:
Source: tradingview.com
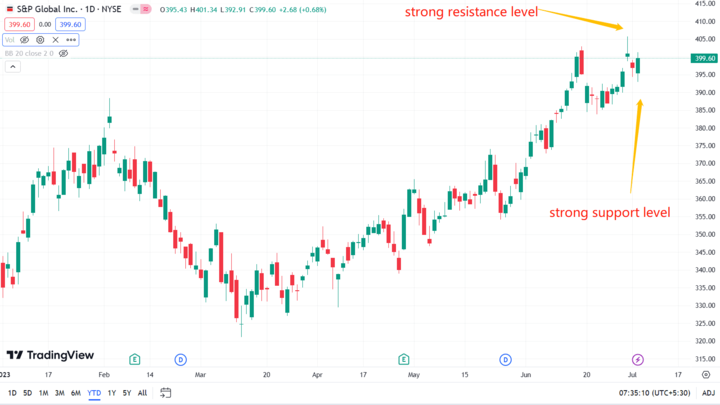
As of July 3, 2023, SPGI stock has a closing price of $399.60, which is near its 52-week high of $405.65. The stock faces strong resistance at the $405 level, which is also an all-time high. If the stock breaks above this level with high volume and positive indicators, it may signal a continuation of the uptrend and a potential target of $430, which is calculated by adding the height of the previous consolidation range ($25) to the breakout point ($405).
On the downside, SPGI stock has strong support at the $390 level, which is also the 50-day moving average. If the stock breaks below this level with high volume and negative indicators, it may signal a reversal of the uptrend and a potential target of $365, which is calculated by subtracting the height of the previous consolidation range ($25) from the breakdown point ($390).
Trading Strategies for SPGI Stock
Traders can use various trading strategies to take advantage of the price movements of SPGI stock. One of these strategies is CFD trading.
CFD Trading
CFD trading is a form of derivative trading that allows traders to speculate on the rising or falling prices of SPGI stock without owning or delivering the underlying asset. CFD trading offers some advantages over traditional stock trading, such as:
● Leverage: CFD trading allows traders to trade with leverage, which means they can open larger positions with a smaller initial deposit or margin. Leverage can magnify both profits and losses, so traders should use it with caution and risk management.
● Flexibility: CFD trading allows traders to trade both long and short positions, which means they can profit from both rising and falling prices of SPGI stock. Traders can also trade across different time frames, from minutes to months.
● Lower costs: CFD trading involves lower costs than traditional stock trading, as there are no commissions or stamp duty involved. Traders only pay the bid-ask spread and overnight financing fees if they hold their positions overnight.
Access: CFD trading allows traders to access global markets and instruments from one platform and account. Traders can trade SPGI stock CFD along with other financial instruments, such as forex, commodities, indices, crypto, etc.
To trade SPGI stock CFD, traders need to follow these steps:
● Choose a reliable and regulated CFD broker that offers SPGI stock CFD, such as VSTAR.
● Open and fund a trading account with the CFD broker.
● Analyze the market and decide whether to go long (buy) or short (sell) SPGI stock CFD, based on the technical levels, indicators, trends, news, etc.
● Place a trade order with the desired position size, entry price, stop loss, and take profit levels.
● Monitor and manage the trade until it reaches the exit point or is closed manually.

Source: YahooFinance
VIII. Trade SPGI Stock CFD at VSTAR
If you are interested in trading SPGI stock CFD, you may want to consider VSTAR as your online broker. VSTAR is a multi-regulated and reliable broker that offers CFD trading on various instruments, including forex, crypto, commodities, indices, and stocks.
Here are some of the advantages of trading SPGI stock CFD with VSTAR:
● Trade shares CFDs with leverage up to 1:200 depending on the instrument. This means you can trade with a smaller capital and participate in more trading opportunities.
● Lower trading costs to maximize your profit. VSTAR offers competitive spreads from 0.0 pips on major currency pairs and $0 commission on stock CFDs.
● Access global stock markets. VSTAR gives you exposure to a wide range of popular US and HK stocks, including SPGI, COIN, CME, NDAQ, etc. You can trade these stocks anytime during market hours with fast and reliable execution.
● Lightning-fast execution. VSTAR fills your orders at the best market prices and executes them within milliseconds.
● Easy-to-use platform and app. VSTAR provides you with a user-friendly and powerful platform and app that allows you to trade with ease and convenience.
● Risk-free demo account. VSTAR offers you a risk-free demo account with $100,000 virtual funds to practice your trading skills and test your strategies in a live environment.
IX. Conclusion
S&P Global Inc is a leading provider of ratings, benchmarks, analytics, and data for the global capital and commodity markets. The company has a strong financial performance, growth potential, and competitive advantage. The company’s stock is an attractive option for traders who are looking for growth and income opportunities. Traders can use CFD trading to trade SPGI stock with leverage, flexibility, lower costs, and access to global markets and instruments. VSTAR is a recommended broker for trading SPGI stock CFD, as it offers competitive trading conditions, fast execution, a user-friendly platform and app, a risk-free demo account, and more.
