The price of Solana (SOLUSD) has followed one of the most disappointing paths as volatility keeps gains at bay.
Solana Faces A Selling Pressure
In September, analysts suggest that SOL might have an extended corrective month as no sufficient fundamental support is seen to back bulls.
Normally, Solana price moves in tandem with Ethereum and Bitcoin, but recently, large investors have been exerting more of an impact. Sadly, because these investors have adopted a bearish attitude, their impact has been detrimental.
Analysts' Opinion on SOL
Massive wallet owners regularly withdraw their money in August. As of August 24, SOL had lost $34.3 million in value, making it the least popular cryptocurrency asset.
September will probably see more of these outflows. Griffin Ardern, the Head of BloFin Research & Options, supports this opinion, speculating that SOL may perform worse than Ethereum.
Ardern did, however, also point out that SOL, with its meme coins, offers more alluring stories and uses for investors than Ethereum. As a result, despite the present pessimistic outlook, its price efficiency may surpass Ethereum's.
Solana Price Prediction Technical Analysis
In the daily chart of SOLUSD, an extreme corrective momentum is visible, where the recent SOL price hovers above the prolonged rectangle bottom.
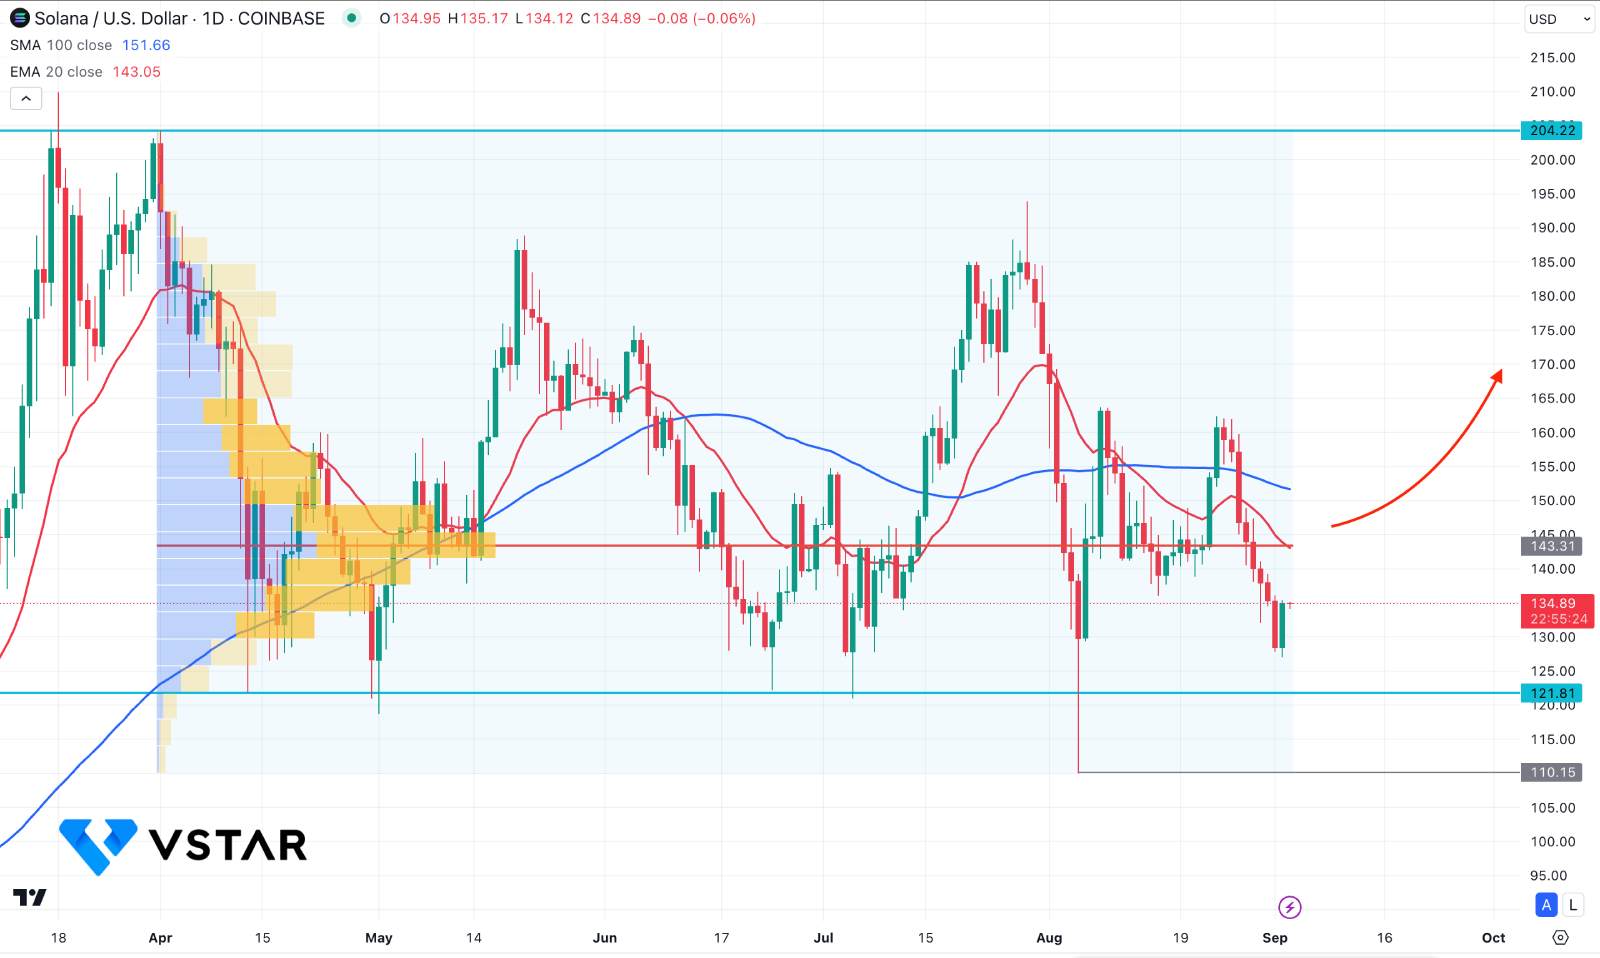
In the volume structure, the bullish possibility needs a push as the current high volume line is still above the current price. Moreover, the dynamic 100-day SMA and 20-day EMA are above the current price with a downward slope. It is a sign that bears are active in the market and a valid push from bulls are needed before opening a long position.
Based on the daily outlook, investors should monitor how the Solana price trades at the bottom. Although a bullish two-bar reversal is present, stable long momentum might come after overcoming the high volume line with a bullish daily candle.
On the other hand, the 121.81 to 110.15 zone would be a crucial price area as the buying possibility is valid above this zone. A break below this line might indicate a bearish rectangle breakout, opening the possibility of testing the 100.00 psychological line. On the bullish side, the near-term resistance is at 170.00 level, before reaching the 204.22 area.
*Disclaimer: The content of this article is for learning purposes only and does not represent the official position of VSTAR, nor can it be used as investment advice.