In the past month, the stock of the RTX Corporation (formerly Raytheon Technologies Corporation) has increased by 3.98%, lagging the 6.94 percent gain of the aerospace sector and the 5.28% increase of the S&P 500.
Raytheon Technologies Earnings Forecast
Investors await RTX's forthcoming earnings report before anticipating a stable trend. Analysts forecast EPS of $1.25, representing a decline of 1.57% compared to the prior year's corresponding quarter. Quarterly revenue of $19.75 billion is anticipated, representing a 9.17% increase over the same period last year.
Analysts project annual revenues of $74.1 billion and earnings of $5 per share, reflecting year-over-year changes of +10.47% and +4.6%, respectively.
Raytheon's Forward P/E Ratio is Positive
Recent fluctuations in analyst forecasts for RTX reflect transient business patterns. Positive adjustments indicate that analysts are optimistic about the future profitability and health of the company.
RTX is presently valued at 16.82 forward price per share (P/E), which is lower than the industry average of 18.42 and signifies a discount compared to its competitors. Notable is RTX's PEG ratio of 1.8, which considers anticipated earnings growth.
RTX Stock Technical Analysis

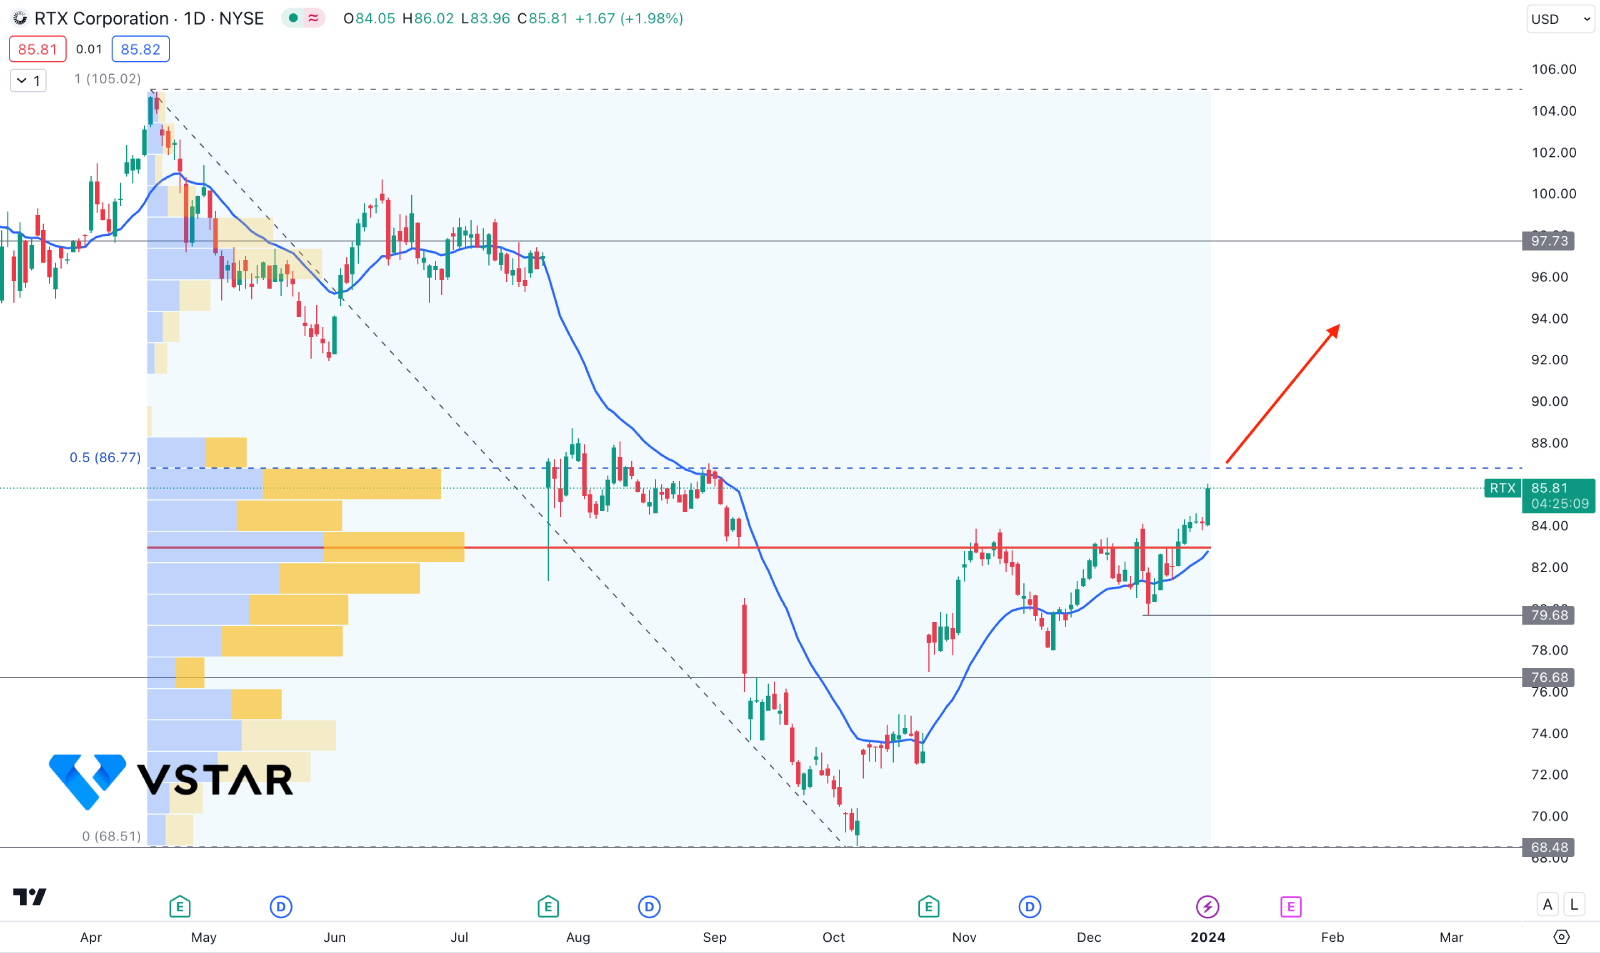
In the daily chart of RTX stock price, the recent price formed a strong bottom at the 68.48 level, from where a V-shape recovery came with an inverse Head and Shoulders breakout.
Looking at the volume structure, the activity level since April 2023 is at 82.97, which is just below the current price. Moreover, the bullish continuation is supported by the dynamic 20 EMA level, which reached the high volume level with a bullish slope.
Based on the daily outlook of Raytheon stock, the ongoing bullish pressure could extend towards the 96.00 level. Moreover, a daily close above the 86.77 high could work as another confluence bullish signal within the existing trend.
On the other hand, a bullish price from the 86.77 level with an immediate rebound below the dynamic 20 EMA could indicate a buy-side liquidity sweep. In that case, a bearish signal could lower the price towards the 76.78 support level.