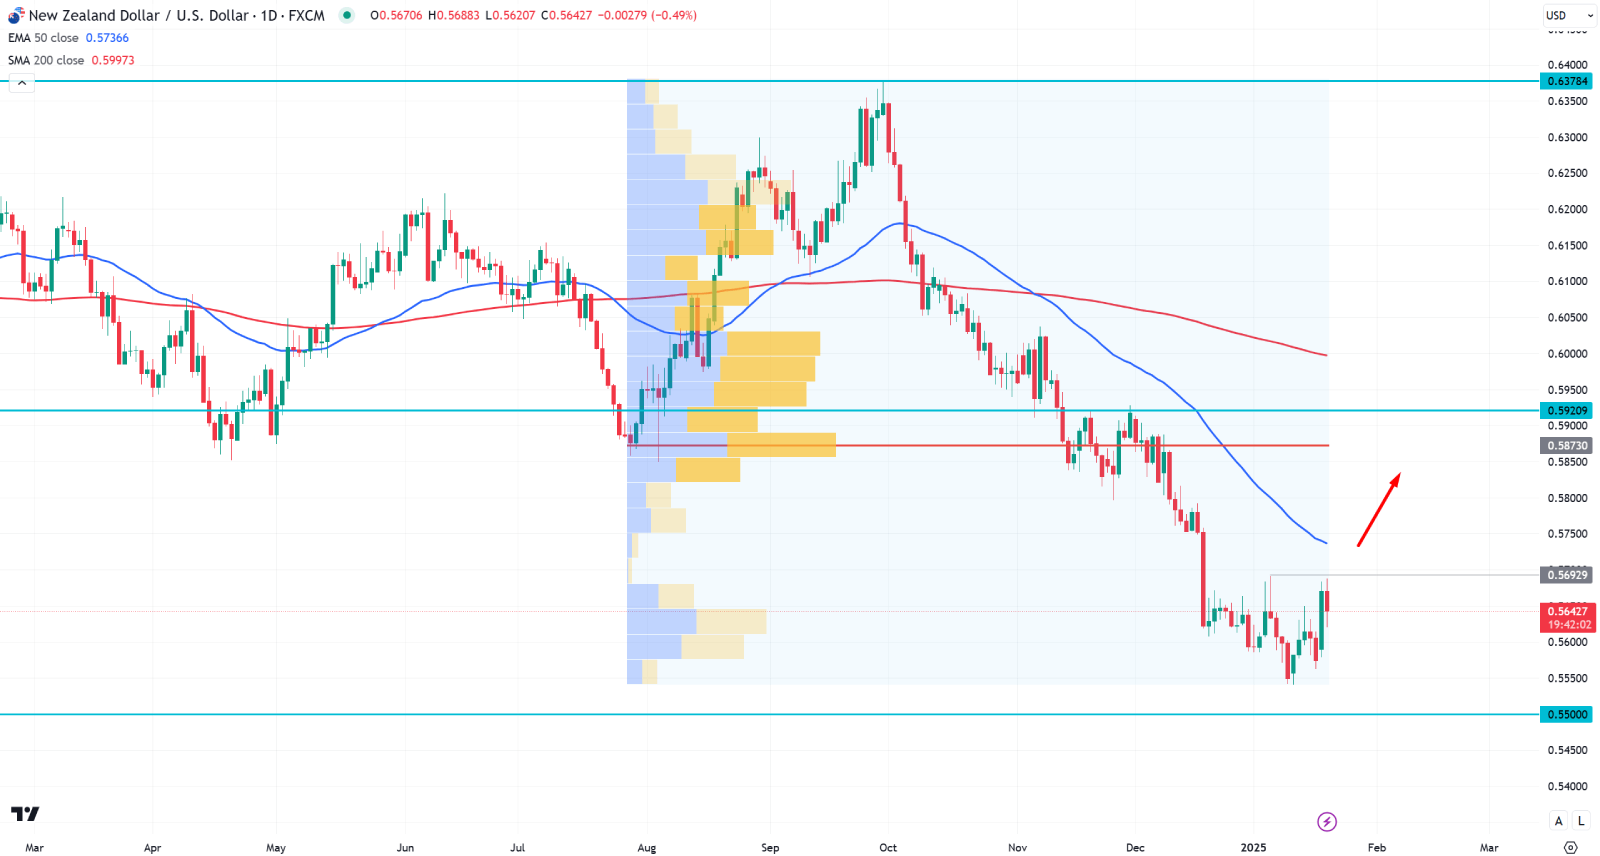
The NZDUSD pair trades at the 0.5648 level, halting its two-day dropping run. The weak US dollar (USD) and apprehensive market sentiment before President-elect Donald Trump's inauguration that follows the day are to blame for the pair's upward movement.
US Dollar Index (USDX) Outlook
As of this writing, the US Dollar Index (DXY), which measures how the USD performs about six other major currencies, is trading at about 108.40. Nevertheless, as the yields on the US Treasury climb due to worries about Trump's proposed policies—such as possible tariffs, longer tax reductions, and tougher immigration laws—the greenback receives some support.
According to analysts, the degree to which these restrictions are enforced may determine the Fed's (Fed) future rate of interest choices.
In the technical chart, the USDX shows a volatile structure after reaching the 110.00 level suggesting an indecision. Primarily, valid bearish pressure below the 107.82 level could validate the top before forming a bearish trend reversal.
Upbeat Chinese Data Helps The NZD
The People's Bank of China (PBOC) declared that it will not alter its Loan Prime Rates (LPRs). The prime rate for one-year loans is still 3.10%, while the prime rate for five-year loans is 3.60%. Any changes in China's economy could affect markets in the Antipodean region because New Zealand and China are strong trading partners.
The strong economic figures from China helped the NZD gain momentum as well. Following a 4.6% growth in the third quarter of 2024, China's GDP expanded 5.4% year-on-year in the fourth quarter. The data significantly outperformed the market expectation of 5% throughout the stated period.
Additionally, manufacturing came in at 6.2% compared to the prediction of 5.4% and November's 5.4%, while yearly December sales at retail climbed by 3.7% compared to the 3.5% projected and 3.0% previous.
NZDUSD Forecast Technical Analysis

In the daily chart of NZDUSD, the recent price showed a corrective pressure at the bottom, suggesting a potential bullish correction.
In the broader outlook, the 200-day SMA is above the current price, signaling a major selling pressure in the market. The 50-day EMA follows the same path, by remaining above the current price.
In the volume structure, the most active level since August 2024 is above the current price, signalling institutions' involvement in the selling pressure.
In this context, the gap between the current price and dynamic 200 day SMA has expanded, signalling a bullish possibility. Moreover, the possible inverse Head and Shoulders pattern is yet to form where a valid break above the 0.5692 level could increase the possibility to reach the 0.5850 level.
On the bearish side, the 50 day EMA is the immediate resistance. In that case, any rebound from the 0.5749 to 0.5674 imbalance zone could lower the price towards the 0.5500 psychological level.


