Since Monday is Martin Luther King Day and U.S. markets are closed, investors will be anticipating Tuesday's (January 21) trading period, which will include Netflix NFLX's Q4 data. NFLX stock has increased by more than 70% over the past 12 months.
NFLX Revenue Estimate
According to estimates, Netflix's Q4 revenues climbed 14% to $10.12 billion from $8.83 billion in the previous quarter. Even better, the streaming behemoth's Q4 EPS is predicted to increase 98% to $4.19 from $2.11 each share a year earlier.
With projected yearly earnings of $19.77 per share compared to $12.03 in 2023, Netflix is expected to close out the fiscal year 2024 with a 64% rise in earnings and a 15% increase in overall revenue to $38.86 billion.
In addition to surpassing revenue projections for five straight quarters, Netflix has also outperformed profitability forecasts in all three of its previous four quarterly statements, with a typical EPS amazement of 5.73%.
Netflix New Member Projection
Netflix is predicted to have added more than 7 million new members in Q4, reaching a total of $287.48 million, maintaining its position as the online king over rival Disney DIS.
This would represent a 10% increase compared to the firm's $260.28 million customers at the close of Q3 2024.
NFLX Key Financial Metrics
With a share price of over $860, NFLX has a 35.6X forward profits multiple, higher than the standard S&P 500's 22.2X and Disney's 19X.
NFLX is trading far below its five-year peak of 88.5X forward profits and at a tiny discount to the average of 37.4X throughout this time, which is remarkable given that Netflix stock has recently outperformed both Disney stock and the overall market.
Netflix Stock Forecast Technical Analysis

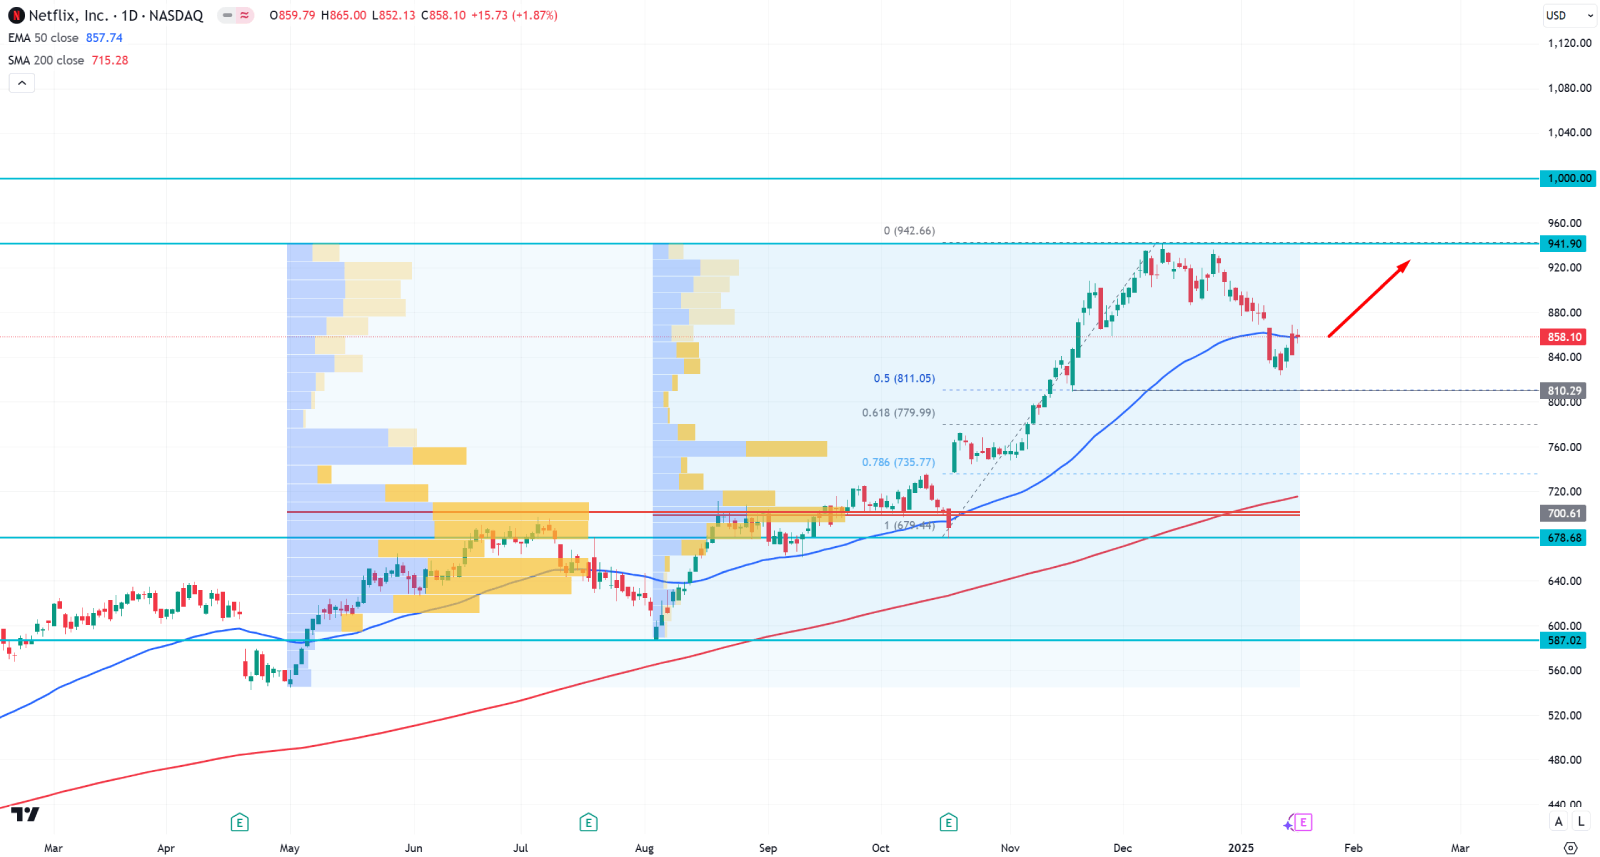
In the daily chart of NFLX stock price, the ongoing market momentum is bullish as shown in the above image. The current swing at the bottom is at the 678.78 low from where a bullish rebound has come with an impulsive pressure. However, the price went sideways after setting a top at the 941.90 high.
In the major structure, the most recent sideways pressure took the Netflix stock price below the 50-day Exponential Moving Average. However, the 200-day SMA is still below the current price, and it is working as a major support.
In the volume structure, the most active levels since May and August 2024 are below the current price, signaling an active institutions’ involvement on the bullish side.
Based on the daily market outlook of NFLX, the current price is hovering above the 50% Fibonacci Retracement of the existing swing. In that case, further selling pressure below the 810.29 level could attract bulls into the market. A valid bullish reversal from the 810.00 to 680.00 zone could extend the ongoing buying pressure towards the 1000.00 psychological line.
However, a failure to hold the momentum above the 700.00 line with a strong bearish daily candle might extend the selling pressure towards the 587.02 static level.


