- Natural Gas Data Overview: Storage surplus, regional price variations, and stable rig counts influence CFD prices.
- Market Trends: Henry Hub price rises, international LNG price dips, impacting domestic pricing.
- Supply-Demand Balance: Record production, increased consumption, and steady LNG exports affect price stability.
- Storage Comparison: Ample storage above averages moderates price volatility despite net withdrawals.
In the energy markets, the pricing dynamics of Natural Gas Contracts for Difference (CFDs) are impacted by EIA data on the continuum. Amidst storage fluctuations, market volatilities, and global shifts, deciphering the trajectory of CFD prices becomes a nuanced endeavor. The article explores the intricate interplay of myriad factors, this analysis unveils the potential drivers shaping the direction of Natural Gas CFD prices in the current week.
Natural Gas Storage Data Analysis
The natural gas storage data serves as a crucial indicator of the balance between supply and demand. The total natural gas storage as of December 15, 2023, stood at 3,577 billion cubic feet (Bcf), exhibiting a decline of 87 Bcf from the previous week's storage of 3,664 Bcf. This decrease indicates net withdrawals from storage.
Comparing the current storage levels with historical data, the inventory is higher than both the levels from a year ago (3,337 Bcf) and the five-year average (3,297 Bcf). The year-on-year increase in stocks by 7.2% and the 8.5% rise from the five-year average highlight a surplus in natural gas inventories.
A decrease in storage suggests higher demand or lower supply. Such reductions in inventory levels typically result in upward pressure on prices as markets anticipate potential shortages. The surplus in storage concerning both year-ago levels and the five-year average might mitigate immediate significant price spikes due to the ample supply cushion.

Source: EIA.gov
Market Highlights Analysis
The Henry Hub spot price rose from $2.33/MMBtu to $2.49/MMBtu, indicating a positive movement in immediate pricing. January 2024 NYMEX futures increased from $2.335/MMBtu to $2.447/MMBtu, and the 12-month strip averaging January 2024 through December 2024 futures contracts slightly rose to $2.564/MMBtu.
Northeast experienced price hikes due to temperature drops, while California saw declines due to warmer temperatures. Factors like temperature fluctuations influencing demand and consumption levels significantly impacted regional pricing. Decreased LNG prices in East Asia and TTF in the Netherlands compared to last year suggest global market shifts affecting international natural gas pricing dynamics.
The rise in Henry Hub spot and futures prices suggests a short-term positive market sentiment, likely influenced by immediate demand factors. Regional price fluctuations driven by weather changes might impact overall price direction as demand and consumption patterns vary across areas. Global market shifts in LNG prices could exert influence, possibly transmitting effects to domestic natural gas prices.
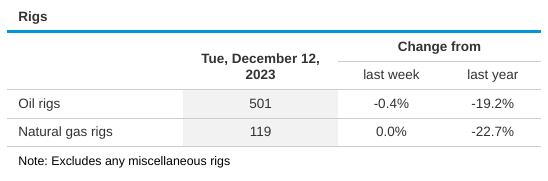
Rig Count Analysis
The rig count for natural gas remained stable at 119 rigs, indicating a consistent level of production activities. A steady rig count signifies sustained production, contributing to price stability unless unforeseen disruptions in supply occur.
Source: EIA.gov
Supply and Demand Dynamics Analysis
Supply
Total supply of natural gas increased by 0.6%, driven by a record high in dry natural gas production, averaging 105.8 Bcf/d. Average net imports from Canada also saw a slight increase of 2.2% compared to the previous week.
Demand
U.S. consumption of natural gas rose by 0.3%, with increased usage in the residential and commercial sectors.
Power generation witnessed a slight rise in natural gas consumption, while industrial sector usage decreased marginally.
A rise in natural gas supply, especially with record high production levels, might potentially limit significant price increases due to a more robust supply. Increased consumption in residential and commercial sectors suggests higher immediate demand, potentially influencing prices positively.
Liquefied Natural Gas (LNG) Analysis
Deliveries to U.S. LNG export terminals remained constant, indicating sustained demand for LNG exports.
LNG Vessels Movement. Departures and arrivals of LNG vessels at U.S. ports show ongoing trade activities with various destinations. The steady flow of LNG exports could contribute to maintaining or slightly elevating domestic prices if global demand remains consistent.
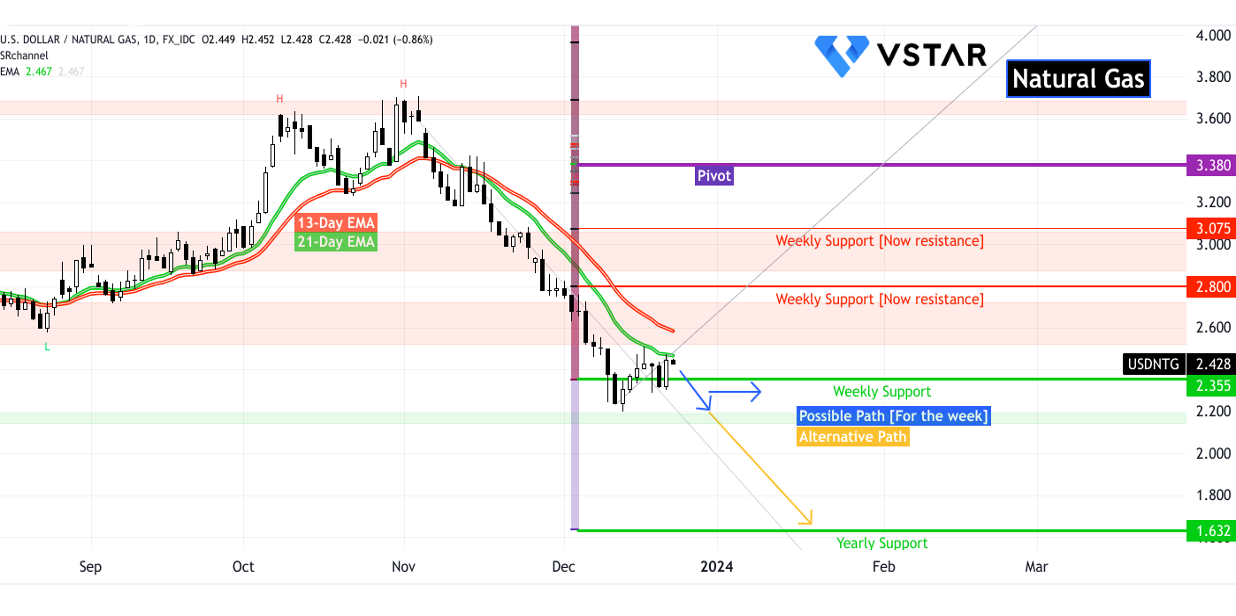
Natural Gas CFD: Technical Take
The prices of natural gas CFDs have taken support at $2.20 in the conclusive phase of the ongoing downtrend. Technically, the price is stabilizing in the range of $2.52–$2.20 (blue path). Although less likely, the current trend (price momentum and exponential moving averages) signals more downside to reaching yearly support at $1.63.
Source: tradingview.com
While storage surplus and stable supply mitigate extreme price swings, regional demand variations and international trends contribute to a dynamic pricing environment. Given the balanced market fundamentals, Natural Gas CFD prices might witness moderate fluctuations, likely influenced by short-term demand shifts. Overall, the trajectory leans towards a relatively stable price direction in the current week.