Melania Coin has failed to create a hype like the Trump Coin but the time is not ending now. Some observers have expressed issues over the coin's distribution, security of the website, and team management of the MELANIA meme coin since its launch.
Analysts Opinion On Melania Coin
According to blockchain analytics company Bubblemaps, almost 90% of MELANIA's token supply is kept in a single wallet, defying the project's assertions of a widely distributed distribution.
The website, which was made the day before the debut, has also drawn criticism for having badly written code that cryptocurrency developer "cigar" referred to as "half-assed" and for missing cybersecurity protection.
The funding of the creator wallet, which was connected to pump.fun, a Solana memecoin platform renowned for speculative endeavors, raised additional doubts. Despite Grogan's dismissal of the possibility of a "rug pull," questions remain over the project's professionalism and transparency.
Factors To See On Melania Coin Price
Politics, philanthropy, and cryptocurrency are all combined in MELANIA coin. high-profile political achievements, like Melania Trump's public endorsements or her appearances with Donald Trump at campaign rallies. These occurrences might increase market fervor and raise awareness of the token between Trump supporters and cryptocurrency enthusiasts.
On the other hand, MELANIA may face hazards due to its intimate ties to a certain political figure. Trader sentiment may be tempered by any issues or problems surrounding Donald Trump or Melania, such as court cases or negative press coverage.
Like many other meme coins, social media engagement can affect MELANIA's price. Viral campaigns, popular hashtags, and recommendations from well-known members of the cryptocurrency community may influence price increases.
However, progress can slow if social media engagement wanes or if attention is diverted to more recent coins.
Melania Coin Price Technical Analysis
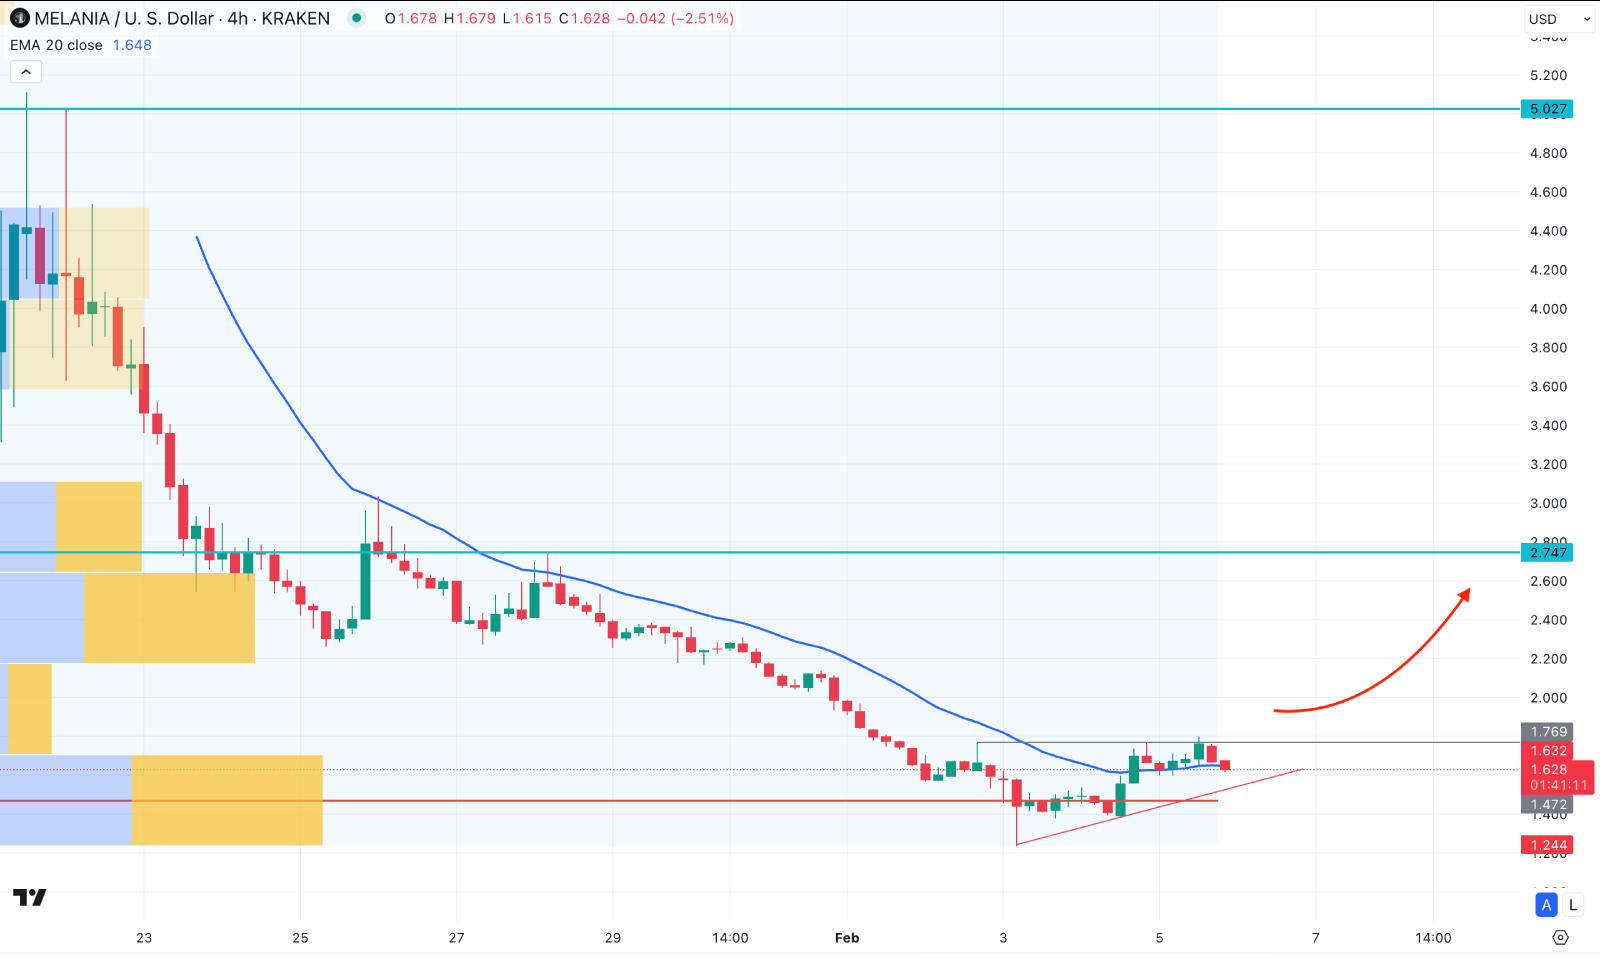
In the daily chart of MELANIAUSD an extended selling pressure is visible from the launch date, taking the price 80% down in a week. In the second week the momentum becomes slower, signalling a possible bottom formation.
In the daily chart, the price remained bearish with the corrective pressure with no sign of a bullish recovery. However the Internet intraday price shows a sideways momentum from the triangle pattern, from where a potential bullish break is seen at the 1.769 level. As the price failed to breach that line And formed a bearish recovery, investors might need more clues before opening a long position.
The 20 Exponential Moving Average is below the current price and working as a support from where one more push upside is needed to validate the low. Based on this outlook overcoming the 1.769 level could open the room for reaching the 2.747 resistance level before aiming for 5.000 psychological area.
However the triangle pattern is visible where sufficient sell side liquidity is present below the triangle support. In that case a bearish candle below the 1.472 line could lower the price towards the 1.0000 area.