Here are today's directional views from the global research desks of Trading Central! These are starting points for your own research to identify opportunities that make sense for you. Like what you see? Feel free to forward this to a friend!

Market Wrap: Stocks, Bonds, Commodities
On Tuesday, U.S. stocks closed lower as the S&P 500 fell 12 points (-0.28%) to 4,387, the Nasdaq 100 dropped 28 points (-0.19%) to 14,908 and the Dow Jones Industrial Average slid 175 points (-0.51%) to 34,288.
The Banks (-2.41%) and Semiconductors & Semiconductor Equipment (-1.7%) sectors led the decline, while the Technology Hardware & Equipment (+0.64%) and Telecommunication Services (+0.55%) sectors outperformed during the trading session.
Microsoft (MSFT), the software development company, rose 0.18% after the U.K. CMA opened a new phase 1 investigation into a new, restructured deal by the company to buy Activision (ATVI). Under the new deal, Microsoft will not acquire the cloud streaming rights to all current and future Activision games released during the next 15 years (excluding in the European Economic Area).
Charles Schwab (SCHW), an investment brokerage group, fell 4.95% as it plans to close some corporate offices and slash job cuts to save as much as 500 million dollars in costs.
Keycorp (KEY), a middle-market commercial bank, dropped 4.13% following S&P Global Ratings' downgrades on some U.S. banks.
Baidu (BIDU), the Chinese technology company, rose 2.75% on quarterly sales that topped estimates.
Zoom Video Communications (ZM), the leader in modern enterprise video communications, fell 2.14% despite second-quarter top and bottom-line figures that beat estimates while full year adjusted EPS guidance also topped expectations.
Macy's (M), the department store chain, plunged 14.05% after comparable sales were down significantly from a year ago.
AMC Entertainment (AMC), the theatrical exhibition company, sank 18.27% after a Delaware Supreme Court ruled that the company's preferred APE shares could be converted to common shares.
On the U.S. economic data front, existing home sales declined 2.2% month over month in July, against an initial drop of 0.5% expected, while the Richmond Fed Manufacturing Index improved to -7 in August from -9 in July, but lower than the forecasted -6.
The U.S. 10-year Treasury Yield slipped 1 basis point to 4.328%.
European stocks were broadly higher. The Dax 40 rose 0.66%, the Cac 40 gained 0.59% and the FTSE 100 added 0.18%.
WTI Crude Future (October) fell $0.48 (-0.60%) to 79.64. The American Petroleum Institute said that the U.S. crude inventories dropped 2.42 million barrels in the week ending August 18, compared with an expected draw of 2.90 million barrels.
Spot gold was up $3 to $1,898.
Market Wrap: Forex
The U.S. dollar index climbed 0.3% to 103.61.
EUR/USD declined 50 pips to 1.0846 and GBP/USD fell 26 pips to 1.2730.
USD/JPY dropped 29 pips to 145.93 while USD/CHF added 19 pips to 0.8804.
AUD/USD rose 9 pips to 0.6423 and NZD/USD was up 20 pips to 0.5946. Earlier today, official data showed that New Zealand's retail sales dropped 3.5% on year in the second quarter, compared with an estimated growth of 2.8%.
USD/CAD gained 12 pips to 1.3556. Later today, Canada's retail sales are expected to be down 0.1% on month.
Bitcoin extended its decline to $25,809.

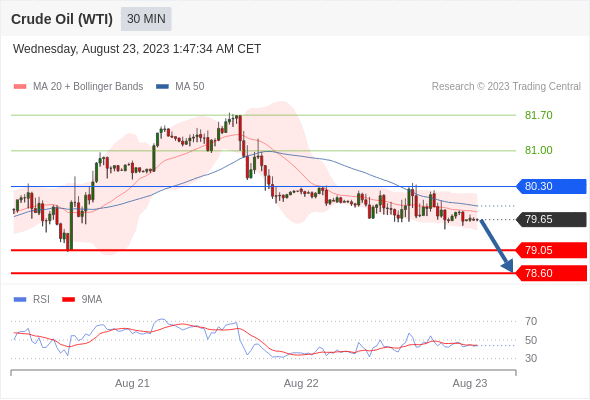
Crude Oil (WTI) (V3) Intraday: under pressure.
Pivot:
80.30
Our preference:
Short positions below 80.30 with targets at 79.05 & 78.60 in extension.
Alternative scenario:
Above 80.30 look for further upside with 81.00 & 81.70 as targets.
Comment:
The RSI is bearish and calls for further decline.
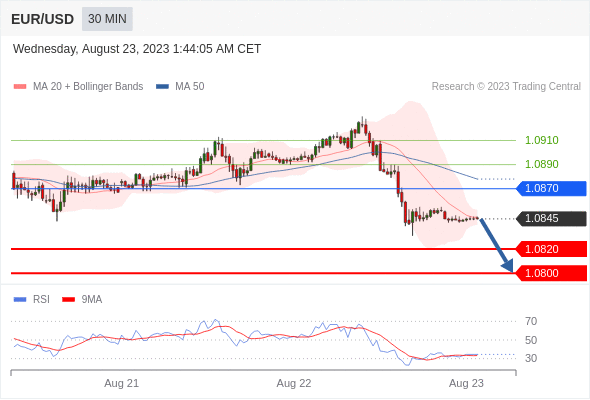
EUR/USD Intraday: under pressure.
Pivot:
1.0870
Our preference:
Short positions below 1.0870 with targets at 1.0820 & 1.0800 in extension.
Alternative scenario:
Above 1.0870 look for further upside with 1.0890 & 1.0910 as targets.
Comment:
The RSI calls for a new downleg.
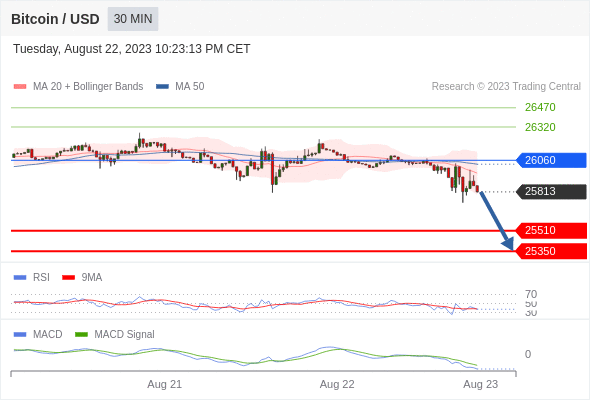
Bitcoin / Dollar intraday: the downside prevails as long as 26060 is resistance
Our pivot point stands at 26060.
Our preference:
The downside prevails as long as 26060 is resistance
Alternative scenario:
The upside breakout of 26060, would call for 26320 and 26470.
Comment:
The RSI is below 50. The MACD is negative and below its signal line. The configuration is negative. Moreover, the price stands below its 20 and 50 period moving average (respectively at 25959 and 26029).
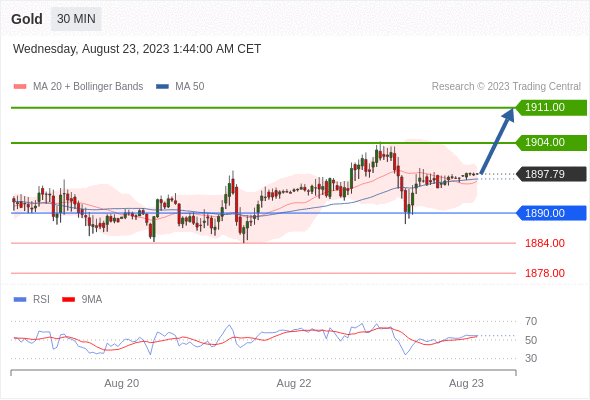
Gold Intraday: watch 1911.00.
Pivot:
1890.00
Our preference:
Long positions above 1890.00 with targets at 1904.00 & 1911.00 in extension.
Alternative scenario:
Below 1890.00 look for further downside with 1884.00 & 1878.00 as targets.
Comment:
The RSI calls for a rebound.
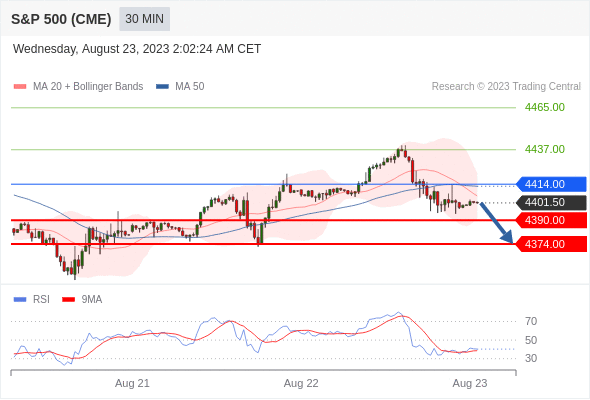
S&P 500 (CME) (U3) Intraday: under pressure.
Pivot:
4414.00
Our preference:
Short positions below 4414.00 with targets at 4390.00 & 4374.00 in extension.
Alternative scenario:
Above 4414.00 look for further upside with 4437.00 & 4465.00 as targets.
Comment:
The RSI is below its neutrality area at 50%
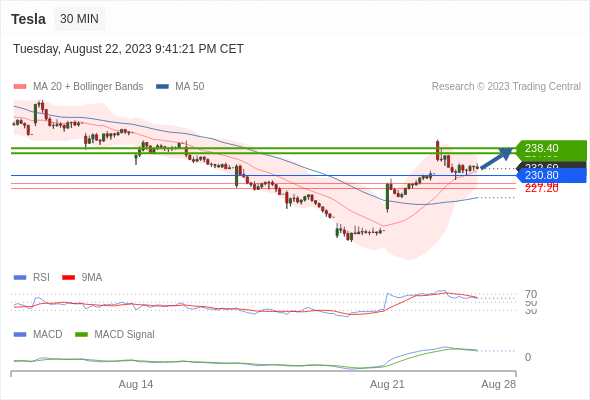
Tesla intraday: as long as 230.8 is support look for 238.4
Our pivot point stands at 230.8
Our preference:
As long as 230.8 is support look for 238.4
Alternative scenario:
Below 230.8, expect 228.6 and 227.2.
Comment:
The RSI is above its neutrality area at 50. The MACD is below its signal line and positive. The price could retrace. Tesla is trading above both its 20 and 50 period moving average (respectively at 231.99 and 224.64).
*Disclaimer: The content of this article is for learning purposes only and does not represent the official position of VSTAR, nor can it be used as investment advice.


.png)