Here are today's directional views from the global research desks of Trading Central! These are starting points for your own research to identify opportunities that make sense for you. Like what you see? Feel free to forward this to a friend!

Market Wrap: Stocks, Bonds, Commodities
On Tuesday, major U.S. indices were under pressure as the Chinese yuan slid to a 9-month low against the dollar, while Fitch ratings said it may have to slash the credit ratings of more U.S. banks. The S&P 500 declined 52 points (-1.16%) to 4,437, the Nasdaq 100 decreased 168 points (-1.10%) to 15,037 and the Dow Jones Industrial Average dropped 361 points (-1.02%) to 34,946.
The Banks (-2.75%), Automobiles & Components (-2.70%), and Energy (-2.44%) sectors underperformed the most during the trading session. JPMorgan Chase (JPM) fell 2.55%, Wells Fargo (WFC) slid 2.31%, Bank of America (BAC) dropped 3.2%, and US Bancorp (USB) lost 2.79%.
Meanwhile, PayPal (PYPL) slid 6.01% after Elliot Investment Management sold its stake in the online payment firm during the second quarter.
Tesla (TSLA), the electric-vehicle maker, dropped 2.84% as it revealed new, lower-priced base vehicles for its Model S and X lines.
Target (TGT), a leading general merchandise discount retailer, fell 3.38% ahead of its quarterly report, which is due Wednesday August 16th, as the company is expected to unveil its first sales decline in four years.
DR Horton (DHI) rose 2.89%, Lennar (LEN) gained 1.77%, and NVR (NVR) added 0.52% as a regulatory filing showed that Berkshire Hathaway (BRK/B) increased its stakes in those companies.
On the U.S. economic data front, July's retail sales grew 0.7% on month, above 0.3% estimated, and the Empire State Manufacturing Index was released at -19 for August, compared to 4.0 expected. Also, import prices rose 0.4% on month in July, above 0.2% anticipated, while business inventories were flat, compared with an expected increase of 0.2%.
The U.S. 10-year Treasury Yield gained 2.2 basis points to 4.213%, up for a fourth straight session.
European stocks were broadly lower. The Dax 40 fell 0.86%, the Cac 40 slid 1.10% and the FTSE 100 declined 1.57%.
WTI Crude Futures (September) lost $1.52 to $80.99. The American Petroleum Institute reported that the U.S. crude inventories dropped 6.20 million barrels in the week ending August 11, compared with an expected draw of 2.05 million barrels.
Spot gold was down $5 to $1,902.
Market Wrap: Forex
The U.S. dollar index was steady at 103.20. Later today, the Federal Reserve will release its latest FOMC meeting minutes.
USD/CNH jumped to a 9-month high at 7.3249. China's central bank lowered the rate on one-year medium-term lending facility loans by 15 basis points to 2.50%, the second time in three months. Meanwhile, China's industrial production grew 3.7% on year in July, below 4.7% expected, and retail sales were up 2.5%, below 4.6% estimated.
EUR/USD fell 3 pips to 1.0903. Germany's ZEW economic sentiment index was published at -12.3 in August, vs -15.0 expected, while the current conditions index was released at -71.3, against -61.0 expected.
GBP/USD gained 16 pips to 1.2699. In the U.K., the jobless rate for the April-June period rose to 4.2%, above 4.0% expected.
USD/JPY and USD/CHF were little changed at 145.57 and 0.8785 respectively.
Commodity-linked currencies were broadly under pressure against the greenback. AUD/USD dropped 33 pips to 0.6454 and NZD/USD slipped 21 pips to 0.5952, while USD/CAD climbed 40 pips to 1.3501. Canada's consumer price index climbed 3.3% on year in July, above 3.1% estimated and 2.8% in June.
Meanwhile, The Reserve Bank of New Zealand is anticipated to keep its benchmark rate unchanged at 5.50% later in the day.
Bitcoin traded lower to $29,176.

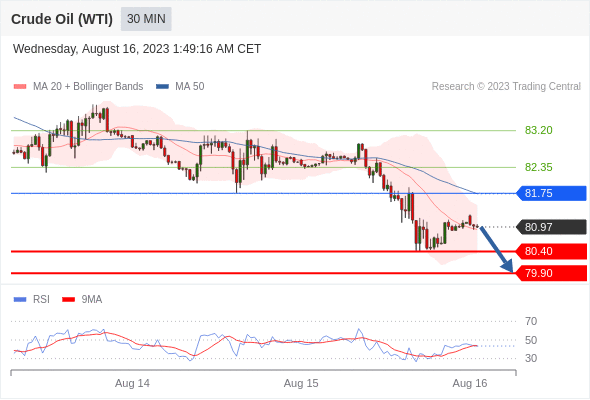
Crude Oil (WTI) (U3) Intraday: key resistance at 81.75.
Pivot:
81.75
Our preference:
Short positions below 81.75 with targets at 80.40 & 79.90 in extension.
Alternative scenario:
Above 81.75 look for further upside with 82.35 & 83.20 as targets.
Comment:
Technically the RSI is below its neutrality area at 50.
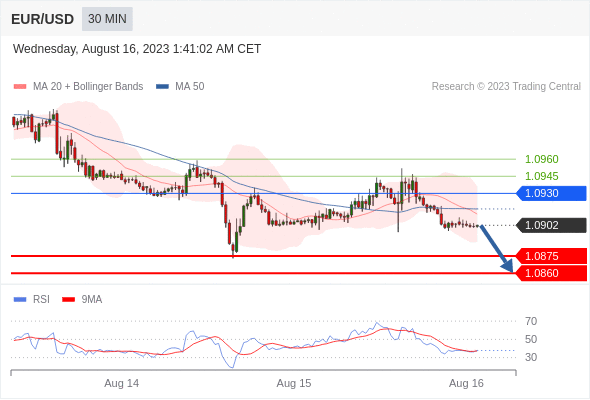
EUR/USD Intraday: the downside prevails.
Pivot:
1.0930
Our preference:
Short positions below 1.0930 with targets at 1.0875 & 1.0860 in extension.
Alternative scenario:
Above 1.0930 look for further upside with 1.0945 & 1.0960 as targets.
Comment:
The RSI is bearish and calls for further decline.
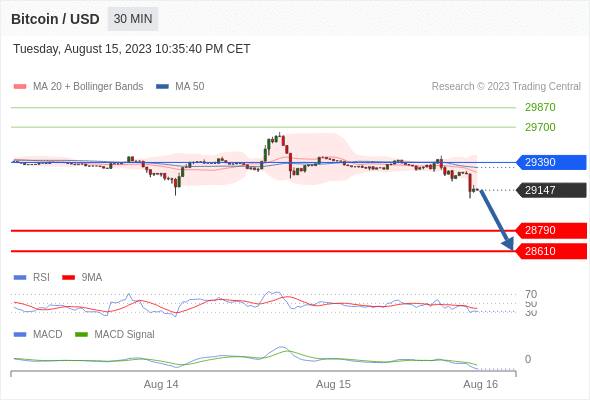
Bitcoin / Dollar intraday: the downside prevails as long as 29390 is resistance
Our pivot point stands at 29390.
Our preference:
The downside prevails as long as 29390 is resistance
Alternative scenario:
The upside breakout of 29390, would call for 29700 and 29870.
Comment:
The RSI is below 50. The MACD is below its signal line and negative. The configuration is negative. Moreover, the price stands below its 20 and 50 period moving average (respectively at 29302 and 29345).
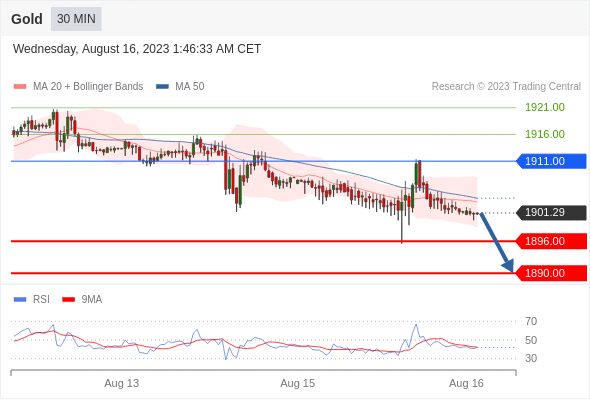
Gold Intraday: key resistance at 1911.00.
Pivot:
1911.00
Our preference:
Short positions below 1911.00 with targets at 1896.00 & 1890.00 in extension.
Alternative scenario:
Above 1911.00 look for further upside with 1916.00 & 1921.00 as targets.
Comment:
As long as 1911.00 is resistance, look for choppy price action with a bearish bias.
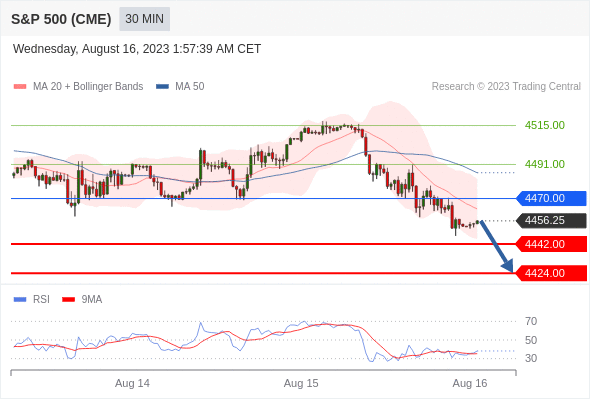
S&P 500 (CME) (U3) Intraday: the downside prevails.
Pivot:
4470.00
Our preference:
Short positions below 4470.00 with targets at 4442.00 & 4424.00 in extension.
Alternative scenario:
Above 4470.00 look for further upside with 4491.00 & 4515.00 as targets.
Comment:
The RSI is below its neutrality area at 50%
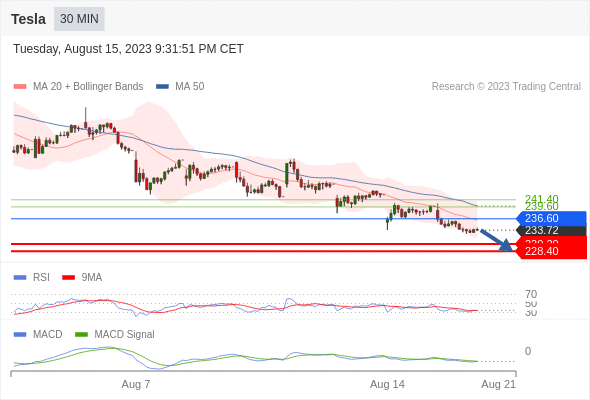
Tesla intraday: the downside prevails as long as 236.6 is resistance
Our pivot point stands at 236.6
Our preference:
The downside prevails as long as 236.6 is resistance
Alternative scenario:
Above 236.6, look for 239.6 and 241.4.
Comment:
The RSI is below its neutrality area at 50. The MACD is below its signal line and negative. The configuration is negative. Tesla is trading under both its 20 and 50 period moving average (respectively at 236.31 and 239.83).
*Disclaimer: The content of this article is for learning purposes only and does not represent the official position of VSTAR, nor can it be used as investment advice.


.png)