Here are today's directional views from the global research desks of Trading Central! These are starting points for your own research to identify opportunities that make sense for you. Like what you see? Feel free to forward this to a friend!

Market Wrap: Stocks, Bonds, Commodities
On Wednesday, U.S. stocks fell ahead of closely-watched inflation data due later on Thursday. The Dow Jones Industrial Average fell 191 points (-0.54%) to 35,123, the S&P 500 dropped 31 points (-0.70%) to 4,467, and the Nasdaq 100 was down 171 points (-1.12%) to 15,101.
The Nasdaq 100 index has crossed below its 50-day moving average for the first time since March.
The U.S. 10-year Treasury yield eased 1.4 basis points to 4.008%.
Apple (AAPL) fell 0.90%, Microsoft (MSFT) dropped 1.17%, Meta Platforms (META) lost 2.38%, Tesla (TSLA) declined 3.01%, and Nvidia (NVDA) slid 4.72%.
ROBLOX (RBLX) plunged 21.94%. The online video game platform reported 65.5 million daily active users for the second-quarter, against 65.8 million expected.
Rivian Automotive (RIVN) dropped 9.88% despite a raised production outlook to 52,000 vehicles.
Lyft (LYFT) slid 10.03% on sluggish sales growth.
European stocks closed higher. The Dax 40 rose 0.49%, the CAC 40 climbed 0.72%, and the FTSE 100 was up 0.80%.
U.S. WTI crude futures added $1.30 to $84.25 a barrel.
The U.S. Department of Energy reported an addition of 5.85 million barrels in crude-oil stockpiles (vs an addition of 0.57 million barrels expected).
Gold price sank $10 to $1,914 an ounce.
Market Wrap: Forex
The U.S. dollar index was stable at 102.50.
EUR/USD rose 17 pips to 1.0973.
GBP/USD dropped 28 pips to 1.2720.
USD/JPY climbed 32 pips to 143.70. This morning, Japan's data showed that producer-price growth slowed to 3.6% on year in July (vs 3.7% expected).
AUD/USD lost 12 pips to 0.6532.
USD/CHF increased 17 pips to 0.8773.
USD/CAD added 6 pips to 1.3425. Canada's data showed that building permits rose 6.1% on month in June (vs -1.3% expected).
Bitcoin failed to hold the key level of $30,000 retreating to $29,420.

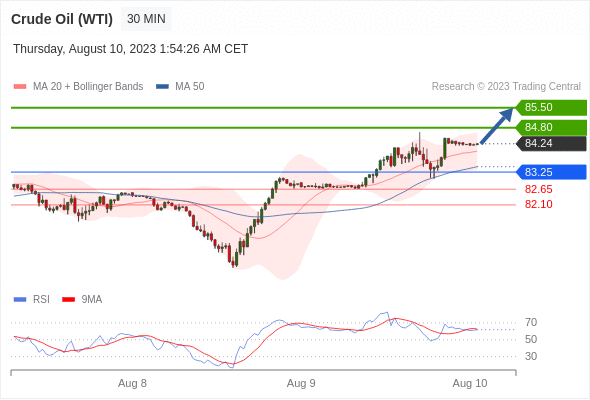
Crude Oil (WTI) (Q3) Intraday: intraday support around 83.25.
Pivot:
83.25
Our preference:
Long positions above 83.25 with targets at 84.80 & 85.50 in extension.
Alternative scenario:
Below 83.25 look for further downside with 82.65 & 82.10 as targets.
Comment:
he next resistances are at 84.80 and then at 85.50.

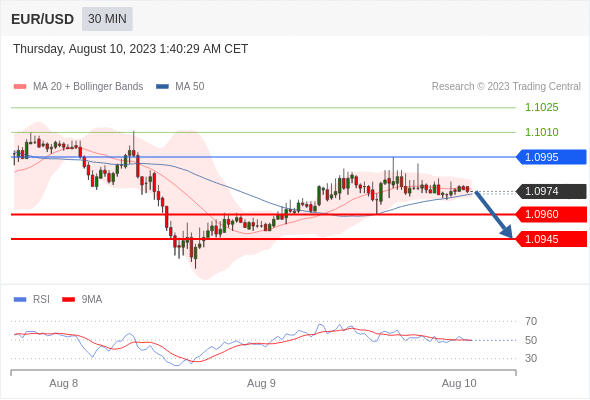
EUR/USD Intraday: towards 1.0945.
Pivot:
1.0995
Our preference:
Short positions below 1.0995 with targets at 1.0960 & 1.0945 in extension.
Alternative scenario:
Above 1.0995 look for further upside with 1.1010 & 1.1025 as targets.
Comment:
As long as the resistance at 1.0995 is not surpassed, the risk of the break below 1.0960 remains high.

Bitcoin / Dollar intraday: the downside prevails as long as 29760 is resistance
Our pivot point stands at 29760.
Our preference:
The downside prevails as long as 29760 is resistance.
Alternative scenario:
The upside breakout of 29760, would call for 30080 and 30280.
Comment:
The RSI is below 50. The MACD is below its signal line and negative. The configuration is negative. Moreover, the price is trading under both its 20 and 50 period moving average (respectively at 29712 and 29760).

Gold Intraday: key resistance at 1924.00.
Pivot:
1924.00
Our preference:
Short positions below 1924.00 with targets at 1912.00 & 1907.00 in extension.
Alternative scenario:
Above 1924.00 look for further upside with 1932.00 & 1937.00 as targets.
Comment:
Even though a continuation of the technical rebound cannot be ruled out, its extent should be limited.

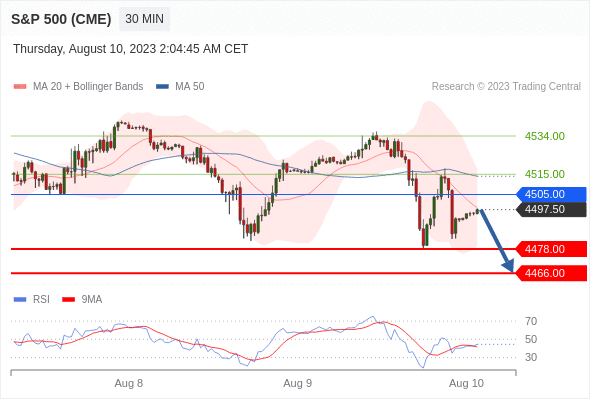
S&P 500 (CME) (U3) Intraday: under pressure.
Pivot:
4505.00
Our preference:
Short positions below 4505.00 with targets at 4478.00 & 4466.00 in extension.
Alternative scenario:
Above 4505.00 look for further upside with 4515.00 & 4534.00 as targets.
Comment:
The RSI is mixed with a bearish bias.

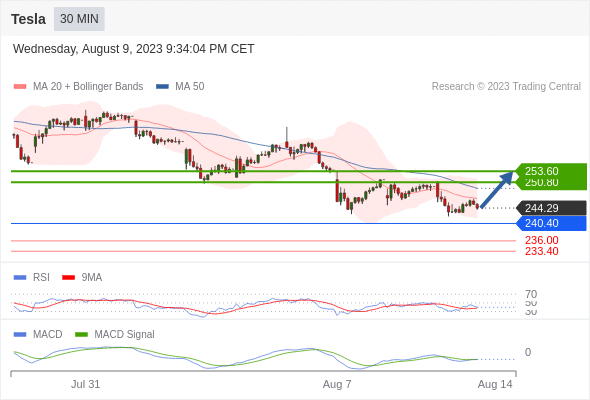
Tesla intraday: short term rebound towards 253.6
Our pivot point stands at 240.4
Our preference:
Short term rebound towards 253.6
Alternative scenario:
The downside breakout of 240.4 would call for 236 and 233.4.
Comment:
The RSI is below its neutrality area at 50. The MACD is above its signal line and negative. The configuration is mixed. Tesla is trading under both its 20 and 50 period moving average (respectively at 246.68 and 249.26).

*Disclaimer: The content of this article is for learning purposes only and does not represent the official position of VSTAR, nor can it be used as investment advice.


.png)