Here are today's directional views from the global research desks of Trading Central! These are starting points for your own research to identify opportunities that make sense for you. Like what you see? Feel free to forward this to a friend!

Market Wrap: Stocks, Bonds, Commodities
On Tuesday, major U.S. stock indexes closed mixed. The Dow Jones Industrial Average rose 71 points (+0.20%) to 35,630, while the S&P 500 declined 12 points (-0.27%) to 4,576, and the Nasdaq 100 was down 38 points (-0.25%) to 15,718.
Top-performing stock sectors were capital goods (+0.62%), commercial & professional services (+0.31%), and insurance (+0.24%), while automobiles (-1.92%), telecom services (-1.41%), and utilities (-1.26%) stock sectors under-performed.
Arista Networks (ANET) surged 19.68%. The high-speed network provider reported better-than-expected quarterly earnings.
On the other hand, after posting quarterly results, ZoomInfo Technologies (ZI) slumped 26.98%, Uber Technologies (UBER) declined 5.68%, Norwegian Cruise Line (NCLH) fell 12.05%, and Carnival (CCL) dropped 4.51%.
Gap Inc (GPS) rose 3.11%, and American Eagle Outfitters (AEO) gained 4.27%. Both stocks were upgraded to "overweight" at Barclays.
In after-market hours, Advanced Micro Devices (AMD) gained 2% after posting higher-than-expected earnings and giving upbeat revenue forecast. Meanwhile, Starbucks (SBUX) declined 1%, and Pinterest (PINS) slid over 3%.
The U.S. 10-year Treasury yield rose 7.8 basis points to 4.037%.
Regarding U.S. economic data, the ISM manufacturing purchasing managers index posted at 46.4 for July (vs 48.0 expected).
European stocks closed lower. The DAX 40 fell 1.26%, the CAC 40 slid 1.22%, and the FTSE 100 was down 0.43%.
U.S. WTI crude futures retreated $0.43 to $81.37 a barrel.
Gold price sank $20 to $1,944 an ounce.
Market Wrap: Forex
AUD/USD plunged 104 pips to 0.6613, the biggest daily fall since March, after Australia's central bank kept its key rate unchanged at 4.10%, against wide expectations of a hike of 25 basis points.
Also, China's Caixin manufacturing purchasing managers index dropped to 49.2 in July (vs 50.1 expected).
EUR/USD eased 15 pips to 1.0982, and GBP/USD was down 61 pips to 1.2774.
USD/JPY jumped a further 105 pips to 143.34, the highest level since July 6.
USD/CHF gained 35 pips to 0.8754, and USD/CAD climbed 90 pips 1.3281.
Bitcoin saw volatile trading, sinking down to $28,480 before bouncing back to $29,490.

Crude Oil (WTI) (Q3) Intraday: further upside.
Pivot:
81.30
Our preference:
Long positions above 81.30 with targets at 83.00 & 83.60 in extension.
Alternative scenario:
Below 81.30 look for further downside with 80.70 & 80.10 as targets.
Comment:
The RSI shows upside momentum.

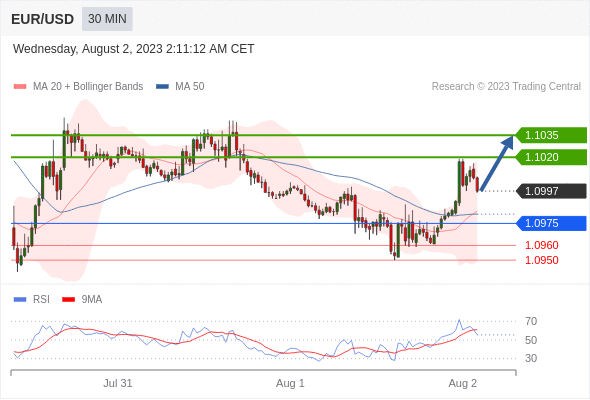
EUR/USD Intraday: bullish bias above 1.0975.
Pivot:
1.0975
Our preference:
Long positions above 1.0975 with targets at 1.1020 & 1.1035 in extension.
Alternative scenario:
Below 1.0975 look for further downside with 1.0960 & 1.0950 as targets.
Comment:
Technically the RSI is above its neutrality area at 50.

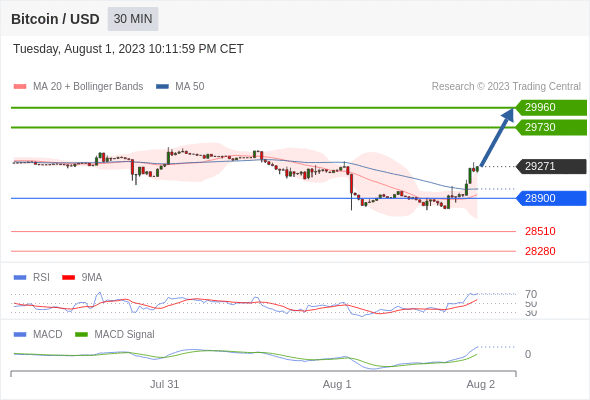
Bitcoin / Dollar intraday: above its upper Bollinger band
Our pivot point stands at 28900.
Our preference:
The upside prevails as long as 28900 is support.
Alternative scenario:
Below 28900, expect 28510 and 28280.
Comment:
The RSI is above 70. It could mean either that the price is in a lasting uptrend or just overbought and therefore bound to correct (look for bearish divergence in this case). The MACD is above its signal line and positive. The configuration is positive. Moreover, the price is above its 20 and 50 period moving average (respectively at 28942 and 29009). Finally, the Bitcoin / Dollar has crossed above its upper Bollinger band (29232).

Gold Intraday: rebound in sight.
Pivot:
1941.00
Our preference:
Long positions above 1941.00 with targets at 1960.00 & 1966.00 in extension.
Alternative scenario:
Below 1941.00 look for further downside with 1935.00 & 1929.00 as targets.
Comment:
The RSI is bullish and calls for further upside.

S&P 500 (CME) (U3) Intraday: under pressure.
Pivot:
4604.00
Our preference:
Short positions below 4604.00 with targets at 4572.00 & 4560.00 in extension.
Alternative scenario:
Above 4604.00 look for further upside with 4620.00 & 4634.00 as targets.
Comment:
The RSI advocates for further decline.

Tesla intraday: the downside prevails as long as 267.8 is resistance
Our pivot point stands at 267.8
Our preference:
The downside prevails as long as 267.8 is resistance
Alternative scenario:
The upside breakout of 267.8, would call for 274.8 and 279.2.
Comment:
The RSI is below its neutrality area at 50. The MACD is below its signal line and negative. The configuration is negative. Tesla stands below its 20 and 50 period moving average (respectively at 264.11 and 264.07).

*Disclaimer: The content of this article is for learning purposes only and does not represent the official position of VSTAR, nor can it be used as investment advice.


.png)