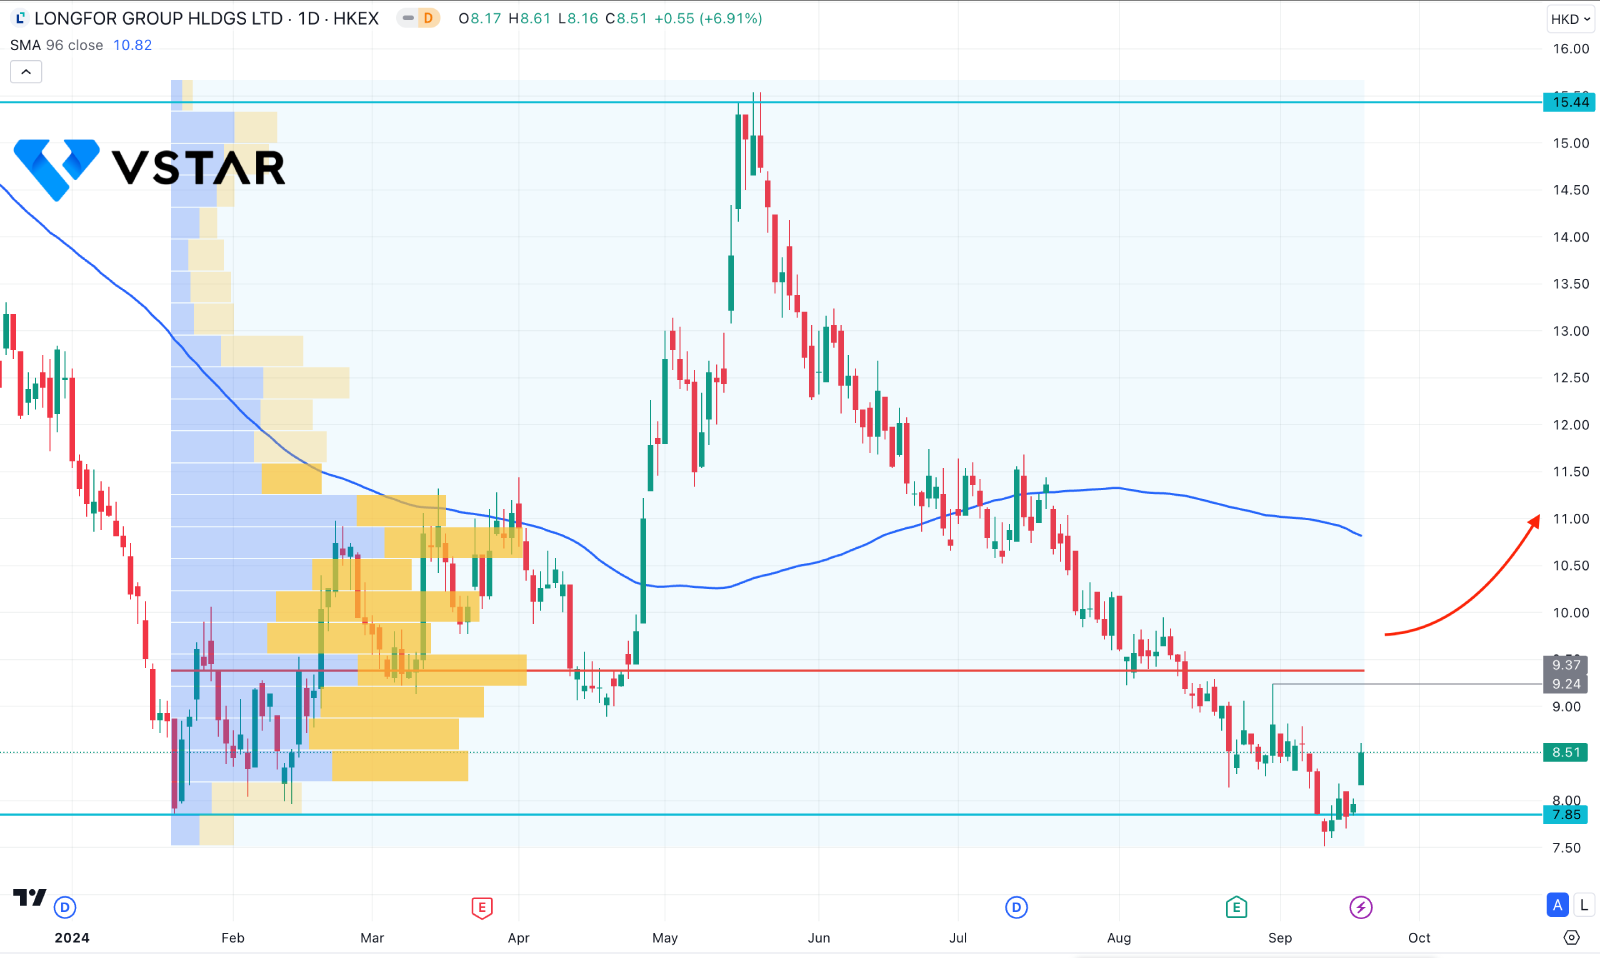
Following the overnight half-percentage-point of Federal Reserve reduction and expectations of more stimulus from Beijing, Chinese real estate stocks spiked higher on Thursday. The Longfor stock (LONGFOR) showed a valid recovery from the bottom, from where more clues are needed to anticipate a trend change.
Why is LONGFOR Moving Higher?
The gains followed the Federal Reserve's 50 basis point interest rate cut to begin its easing cycle. Now, analysts are anticipating the benchmark lending rates from the Chinese central bank on Friday.
According to Lorraine Tan, head of equity research at Morningstar, the People's Bank of China will have more leeway to lower rates due to the Fed's rate cut without being unduly worried about the yuan's resilience.
China's Real Estate Outlook
Additional relaxation of China's monetary policy situations may improve the sentiment in the real estate sector, especially in light of August's weaker-than-expected economic report. It has caused some economists to lower their projections for the nation's growth in 2024.
However, the Chinese real estate market, which has been stuck in a slump for the past few years, might take longer to recover clearly.
Low economic trust and muted consumption sentiment have negatively impacted the demand for homes in China, even though an extensive rescue package to tackle the real estate sector's woes was revealed in May.
LONGFOR's Effect On Property Disposal
According to a filing made on Monday with the Hong Kong Stock Exchange, Longfor Group Holdings sold 495,000 square meters of overall floor space and reported total contracted earnings of 6.51 billion yuan in August.
In the same month, 4.63 billion yuan in contracted earnings attributed to its shareholders were made, which equated to 365,000 square meters of contracted gross floor revenue area.
According to the filing, contracted earnings for the eight months ending August 31 totaled 65.1 billion, with a gross floor area of roughly 4.7 million square meters.
Longfor Group Stock Technical Analysis
In the daily chart of Longfor Group stock price, extensive selling pressure is visible, where the current price is trading at a valid discounted zone.

In the most recent chart, the price is trading at a crucial support level of 7.85 level. The recent price already showed a bearish liquidity sweep from the 7.85 level but failed to rebound with a valid recovery.
The 100 day Simple Moving Average is way above the current price, suggesting a bullish continuation as a mean reversion. Moreover, the high volume level since January 2024 is at 9.37 level, which is just above the 9.24 static level.
Based on the current market outlook, a bullish continuation with a daily candle above the 9.37 level could open the room for reaching the 13.00 level. However, a corrective bullish pressure with a strong bearish reversal from the dynamic 100 day SMA might resume the existing bearish trend towards the 7.00 area.


