After the final chime on September 19, Lennar Corporation (LEN) is scheduled to release its third-quarter fiscal 2024 outcomes, which ended on August 31. The fiscal second quarter's revenues and earnings grew by 9% and 15%, respectively, year over year. The estimated consensus revenue figure is $9.29 billion, indicating a 6.4% increase over the $8.73 billion reported a year ago.
Lennar Q3 Earnings Forecast
Considering higher deliveries, Lennar's third-quarter fiscal residential sales are anticipated to rise from the previous year's level. The business has profited from its sound operating strategy, which prioritizes sales and production growth over cost, land-light tactics, and advantageous pricing and mix of goods.
LEN stated during the second quarter fiscal revenue that it anticipates 20,500–21,000 home deliveries with an average selling price of $420,000–$425,000. As for deliveries, the forecast for the to-be-reported period is 20,570 homes, representing an increase of 10.8% from 18,559 parts a year earlier.
Also, analysts anticipate that the delivered units' average selling price (ASP) will be $424,410, compared to $448,000 a year earlier. This decrease is due to discounting and a lower per-square-foot revenue mix than the previous year.
Lennar Order Forecast
Lennar anticipates 20,000–21,000 new orders, increasing from the 19,666 orders recorded in the third quarter of fiscal 2023. The current estimate for new orders stands at 20,795 homes, indicating a 5.7% increase from the previous year. The low inventory of existing residences for sale will drive future requests for new residences in the housing market. Dynamic pricing models and digital marketing sites are also advantageous.
Lennar anticipates that homebuilding selling, administrative, and general (SG&A) costs will fall between 7.3% and 7.5% of total home sales. The increase is probably the result of increased insurance, digital marketing, and advertising expenses meant to increase direct sales, as well as an increased dependence on brokers brought on by the state of the market.
Due to a stretched valuation, LEN stock is trading marginally above the average and at a premium relative to the industry. This may serve as a warning to fundamentals-focused investors.
Lennar Stock (LEN) Technical Analysis
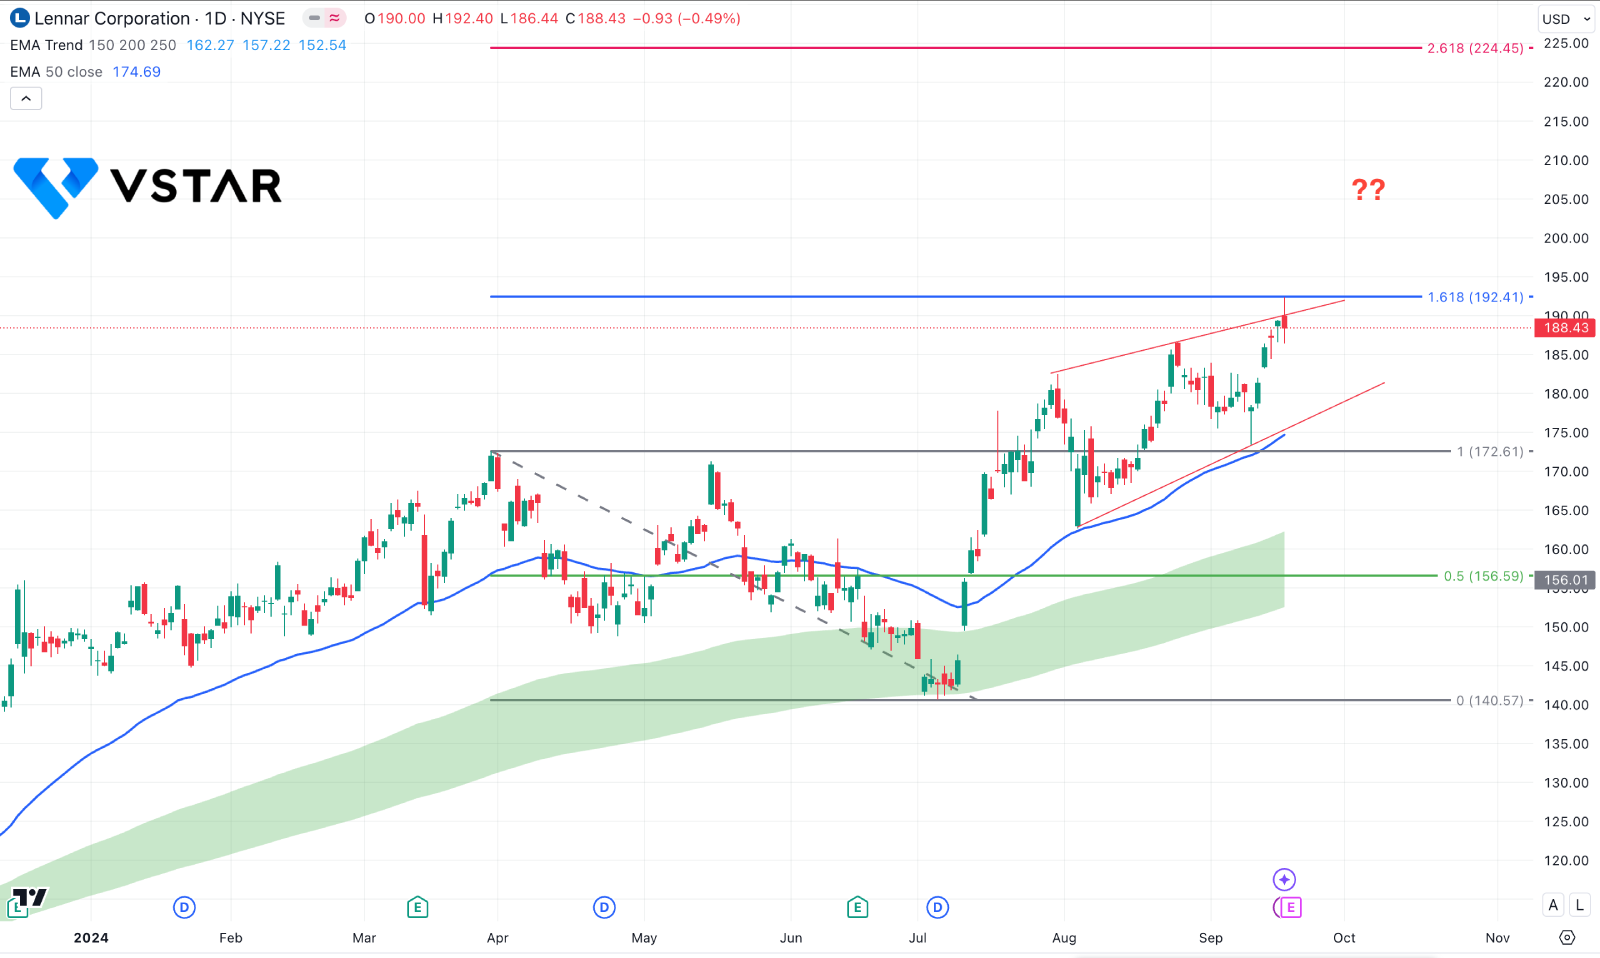
In the daily chart of LEN stock price, the ongoing buying pressure is solid. The current price is hovering at a record high. Now, the real question is whether the price can extend higher or not.

Looking at the major trend, the MA wave suggests an ongoing buying pressure, where a strong gap is visible. It is a sign that the upward pressure is potent, even if there is a space to form a bearish correction.
The 50 day Exponential Moving Average is the immediate support, working in line with the rising wedge pattern.
Based on the daily outlook of LEN, the Lennar stock price is trading at the critical 161.8% Fibonacci Extension level from where the downside pressure might come. However, a solid bearish signal needs a valid wedge breakout with a daily candle below the 172.61 level.
On the other hand, an upbeat earnings result with a bullish continuation momentum might extend the current trend at the 224.48 level in the coming days.


