This week, investors will watch JPMorgan Chase (JPM) to see how rate reductions will affect the larger banking sector as the company launches its third-quarter earnings from major banks.
Banks may then see positive and negative effects from interest rate reductions, with the demand for loans expected to increase but revenue margins possibly declining.
JPMorgan Q3 Earnings Projection
Analysts predict JPMorgan's third-quarter sales will increase by 3% to $41.01 billion. Nonetheless, compared to EPS of $4.33 in the same quarter last year, Q3 earnings are believed to have dropped 7% to $4.02 per share.
Although FY25 sales are predicted to decline by -2%, JPMorgan's profit is now predicted to grow by 9% within the fiscal year 2024 to $172.47 billion.
In terms of financial performance, a 3% EPS boost is anticipated in FY24, and yearly earnings of $16.72 per share are predicted to be essentially flat the following year.
JPM's Performance On Banking Segment
JPMorgan's shares have increased by more than 20% year so far, outpacing the standard of the S&P 500 and big banking peers Citigroup C, Bank of America BAC, and Wells Fargo WFC. This growth can be attributed to the company's excellent market position and financial results.
JPM trades at 12.6X toward earnings, which is roughly in line with Bank of America and the Zacks Banks-Major Regional Industry median, despite having surged over 100% in the previous two years. While JPM is trading at a substantial discount against the benchmark's 24.1X forward P/E multiple, it continues to trade at an approximate earnings premium compared to Wells Fargo and Citigroup.
Furthermore, if the massive financial institution can meet or surpass Q3 estimates and very likely allay worries while providing a positive outlook, particularly concerning increased loan quantities, there may be more upside potential in JPM.
JPM Stock Technical Analysis

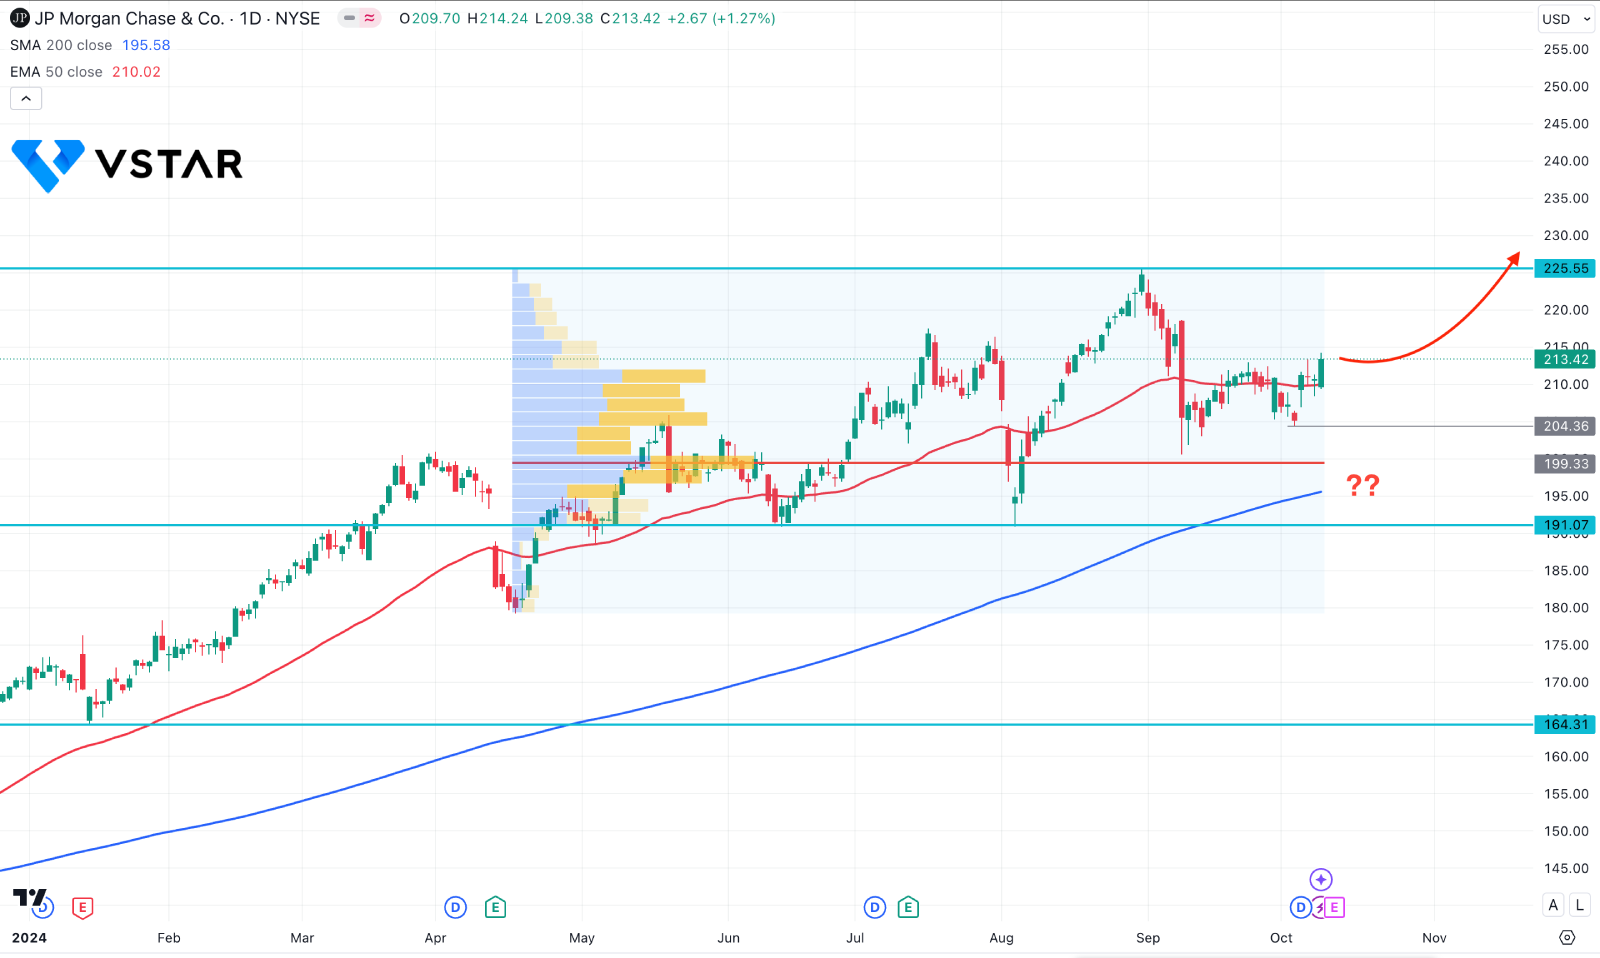
In the daily chart of JPM stock price, the overall market momentum is bullish as the 50-day Exponential Moving Average is carrying the price toward the buyers' side.
In the volume structure, the price is trading at buyers side as the recent price hovers above the 199.33 high volume line.
The major market trend is shown as bullish as the dynamic 200-day Simple Moving Average is below the current price. In that case, we may expect the buying pressure to extend as long as the 200-day SMA is untouched.
On the bullish side, the current continuation is more likely to move higher and test the 255.55 resistance level. However, a prolonged consolidation with a bearish break below the 199.33 level might extend the downside correction, towards the 185.00 area.


