


Johnson & Johnson (JNJ) is expected to disclose its Q2 earnings reports on July 17, where the current expectation is $22.38 billion in revenue and earnings of $2.71 per share.
JNJ Revenue Segment Analysis
The healthcare segment maintained an upbeat expectation, surpassing them in the last four quarters with an average surprise of 4.09%. Overall, JNJ surpassed expectations by 2.65% in the most recent quarter.
According to analysts' forecasts, Stelara sales could come at $2.85 billion, while their model anticipates $2.76 billion. The consensus for Darzalex is $2.89 billion, with their model predicting $2.97 billion. Erleada's consensus is $691.6 million, with their model predicting $682.5 million.
In other products, Invega Sustenna and Uptravi could grow, and new medicines such as Carvykti, Tecvayli, Talvey, and Spravato are likely to contribute to top-line growth.
JNJ Key Financial Metrics
JNJ stock has shown downside pressure of 4.4% year-to-date, lagging the industry's 24% increase. Johnson and Johnson stock has also underperformed the S&P 500 and the sector.
JNJ's current forward P/E ratio is 14.02, which is lower than the industry average of 20.72. From a valuation perspective, the company looks attractive as the current trading level approaches the 52-week low.
JNJ Key Strength: Diversified Business
Johnson and Johnson has shifted its focus to the Pharmaceutical and MedTech sectors due to the division of its Consumer Health segment into Kenvue (KVUE). Both segments have demonstrated growth and are anticipated to maintain this trajectory.
JNJ is planning to make some acquisitions and transactions that will improve its portfolio. The company has increased dividends for 62 consecutive years and also returns value to shareholders through share buybacks and dividend payments.
Nevertheless, ongoing legal expenses resulting from talc-based litigation could affect the business outlook. Numerous women are alleged to have developed ovarian cancer as a result of asbestos in talc products in these petitions.
JNJ Stock Forecast Technical Analysis
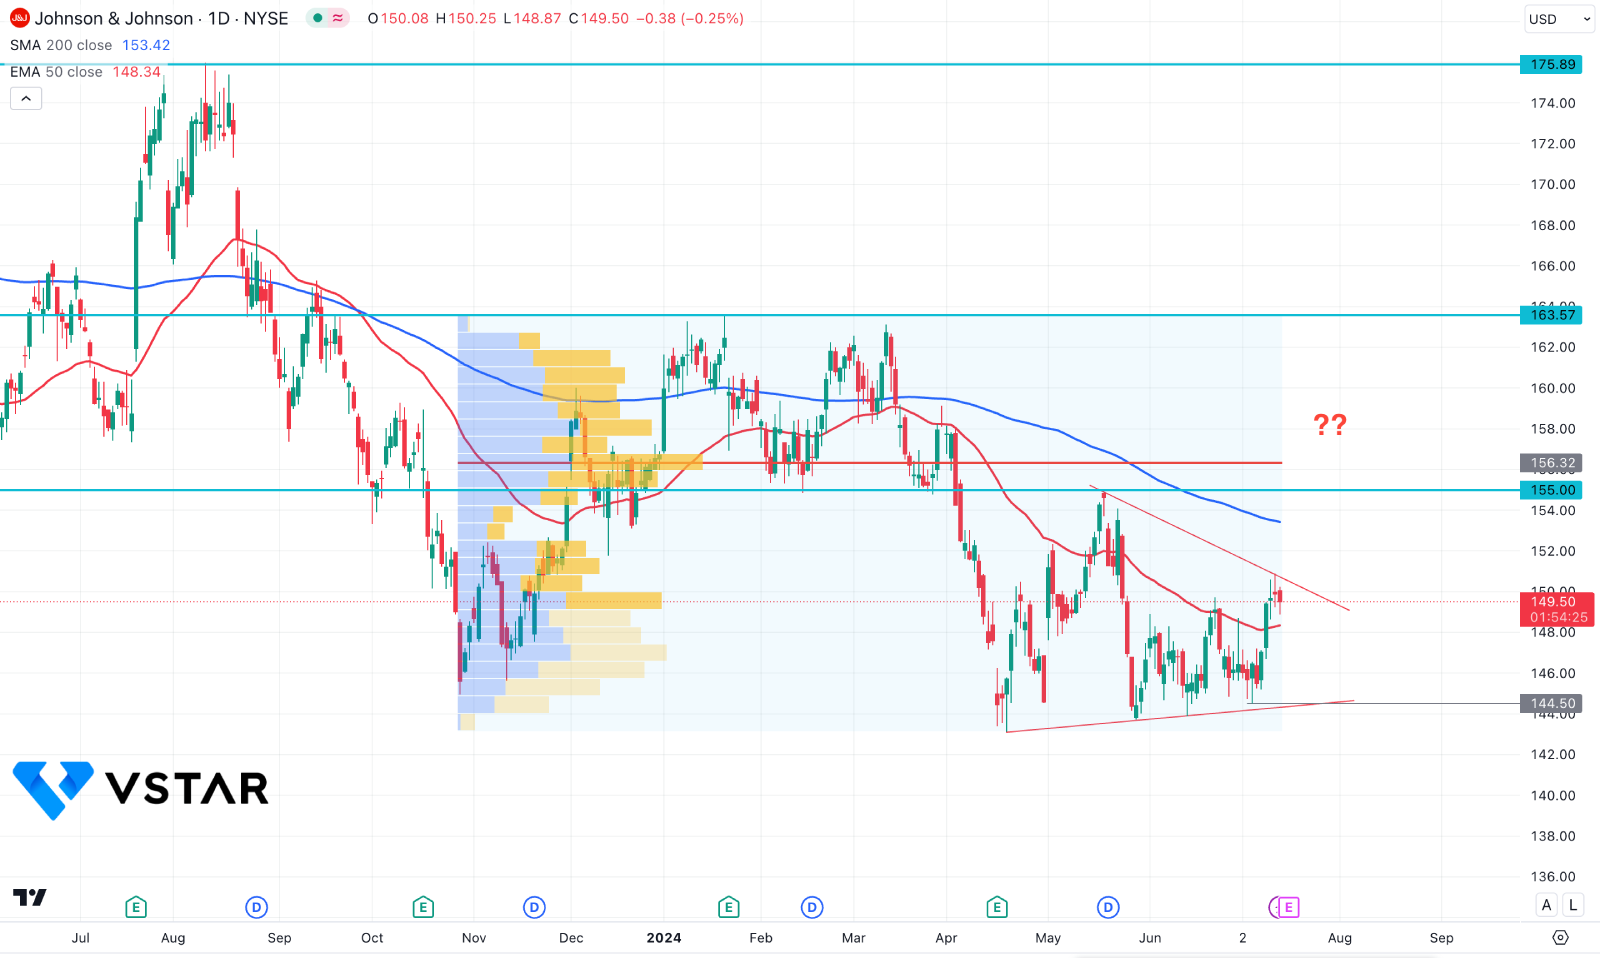
In the daily chart of JNJ stock price, the recent price trades below the 200 day Simple Moving Average, suggesting a major bearish trend. Moreover, a sideways momentum is visible, while the current price hovers within a potential symmetrical triangle formation.
The volume is also supportive to bears as the high-volume line is above the 165.00 static resistance level.
Based on this outlook, a bearish continuation is potent as long as the price trades below the 165.00 static level. In that case, a potential bearish reversal from the 152.00 to 156.32 zone could be a potential bearish opportunity, targeting the 140.00 support level.
The alternative trading approach is to seek a buying pressure after having a valid daily close above the 200 day SMA level. In that case, a stable market above the 156.00 level could extend the momentum toward the 163.57 resistance level.